Quantitative Diagnosis of Fault Severity Trend of Rolling Element Bearings
2015-11-01CUILingliMAChunqingZHANGFeibinandWANGHuaqing
CUI Lingli, MA Chunqing, ZHANG Feibin,*, and WANG Huaqing
1 College of Mechanical Engineering and Applied Electronics Technology, Beijing University of Technology,Beijing 100124, China2 College of Engineering, Jiangxi Agricultural University, Nanchang 330045, China3 School of Mechanical and Electrical Engineering, Beijing University of Chemical Technology,Beijing 100029, China
Quantitative Diagnosis of Fault Severity Trend of Rolling Element Bearings
CUI Lingli1, MA Chunqing1, ZHANG Feibin1,2,*, and WANG Huaqing3
1 College of Mechanical Engineering and Applied Electronics Technology, Beijing University of Technology,Beijing 100124, China
2 College of Engineering, Jiangxi Agricultural University, Nanchang 330045, China
3 School of Mechanical and Electrical Engineering, Beijing University of Chemical Technology,Beijing 100029, China
The condition monitoring and fault diagnosis of rolling element bearings are particularly crucial in rotating mechanical applications in industry. A bearing fault signal contains information not only about fault condition and fault type but also the severity of the fault. This means fault severity quantitative analysis is one of most active and valid ways to realize proper maintenance decision. Aiming at the deficiency of the research in bearing single point pitting fault quantitative diagnosis, a new back-propagation neural network method based on wavelet packet decomposition coefficient entropy is proposed. The three levels of wavelet packet coefficient entropy(WPCE) is introduced as a characteristic input vector to the BPNN. Compared with the wavelet packet decomposition energy ratio input vector, WPCE shows more sensitive in distinguishing from the different fault severity degree of the measured signal. The engineering application results show that the quantitative trend fault diagnosis is realized in the different fault degree of the single point bearing pitting fault. The breakthrough attempt from quantitative to qualitative on the pattern recognition of rolling element bearings fault diagnosis is realized.
rolling bearing fault, quantitative analysis, back-propagation neural network, wavelet packet coefficient entropy,wavelet packet energy ratio
1 Introduction*
The rolling-element bearing is an essential component in mechanical equipment with rotating parts. According to statistics, 30% of faults in rotating mechanical equipment are due to rolling bearing failures[1]. In engineering applications, it is difficult to precisely detect and monitor the signs of wear and injury in the early stages of a fault due to poor working conditions and noise. These defects can cause sudden breakdown of the equipment, often leading to disastrous results. Thus, it is very important to constantly monitor the vibration in the bearings and assess any potential defects in the equipment. Many researchers all over the world have studied many signal processing methods on the fault diagnosis of rolling bearings.
Wavelet transform is a time-frequency signal analysis method established to overcome the limitations of traditional time-domain and frequency-domain analyses that are unable to reflect temporal localized changes in the signal's frequency-domain information. The technique has been praised as a mathematical microscope, a milestone in the history of signal analysis. In the field of fault diagnosis,RAFIEE, et al[2],introduced a new method using the second generation of wavelet matching to track the characteristics of gear faults, and satisfactory results in the fault diagnosis of helicopter transmission systems were obtained in it. Like any typical unstable signal, the vibration signals of rolling bearings contain many transient elements, which makes it highly suitable for wavelet analysis[3-9].
Over the last century, the pattern recognition approach based on artificial neural networks(ANNs) has been used widely because of its strong abilities of self-organizing,self-learning and nonlinear pattern classification[8-9]. These characteristics allow ANNs to successfully approach many non-linear mapping problems[10]. In particular, ANNs exhibit unique advantages in handling nonlinear problems such as vibration signals of rolling bearings[11-12]. The integration of neural networks with other algorithms and research involving their application in fault diagnosis has developed significantly. KUMAR, et al[13]and HU, et al[14],combined neural network and wavelet transform on the rolling bearing fault identification and diagnosis. In the work by WU, et al[15], a fault diagnosis system was successfully applied to the internal combustion engines using wavelet packet transform and artificial neural network techniques. MURUGANATHAM, et al[16], adopted a new technique for bearing fault feature extraction and automatic fault diagnosis based on SSA and ANN.
A back-propagation neural network(BPNN) is a type of split-level, feed-forward neural network which has been widely used in various fields. BPNN, when used in fault diagnosis[17-18], usually employ vibration-signal-related time-domain indicator indices such as peak, RMS, and kurtosis as input vectors. This method is simple and easy and can identify different types of faults. However, due to uncertainty time-domain characteristics in some fault types,identification results of the network are not ideal. Wavelet analysis, however, can achieve excellent results in the time domain. Thus, integrated algorithms using wavelet analysis and BPNN are becoming attractive areas for research. Researchers working on wavelet packet decomposition have used the ratio of energies of the frequency band as characteristic input vectors for the direction of the maintenance of the rotary machine. BPNN, which has yielded satisfactory results in identifying different fault types[19].
However, no studies have been conducted to determine whether these techniques are effective in determining the different severity degrees of the faults. However, it's so important to predict the trend of development of the bearing fault for the machine. HONG, et al[20], conducted fault severity assessment for rolling element bearings by combing the Lempel-Ziv complexity and continuous wavelet transform. ZHAO, et al[21], realized quantitative diagnosis of a spall-like fault of a rolling element bearing by empirical mode decomposition and the approximate entropy method. Therefore, we attempted to realize the quantitative detection of the rolling bearings combing wavelet transform and BPNN. Based on the information derived from the entropy characteristics of the signals from the vibration of rotating mechanical equipment[22], we introduced WPCE of three levels of wavelet packet decomposition as characteristic input vectors to the BPNN. Comparative experiments considering the three-level wavelet packet decomposition energy ratios indicated that the WPCE showed varying sensitivity to different severity degrees of faults and achieved satisfactory results in engineering applications.
2 BP Neural Network
2.1 Network structure
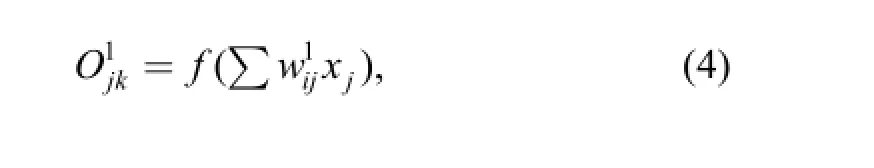
A standard BPNN is composed of three layers of neurons,namely an input layer, a hidden layer and an output layer. Neurons in the same layer do not connect with each other,but connect to other layers. The BP network algorithm contains two phases for error propagation, i.e., pattern forward propagation and pattern backward propagation. Signal data is taken in by the input layer, processed by the hidden layer and given out by the output layer. The output error of the network is obtained by comparing the actual output with the expected output. The error signal is disseminated backward along the network, and the connection weights and thresholds are constantly corrected according to the negative gradient of the error function until the error signal finally achieves the required accuracy. Thus, we can achieve a nonlinear mapping of the input and output signals. The back-propagation neural network model is shown in Fig. 1.
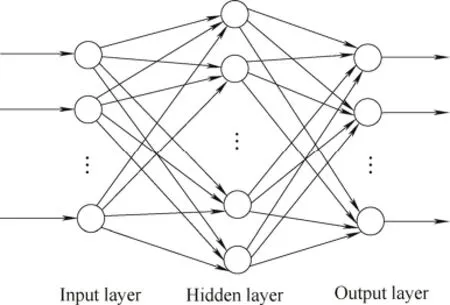
Fig. 1. Back-propagation neural network model
2.2 Network Algorithm
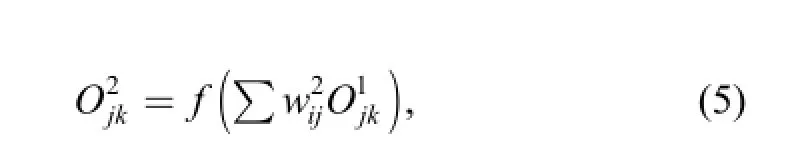
The BPNN learning process includes forward and reverse propagation. The forward propagation process can be expressed as follows:
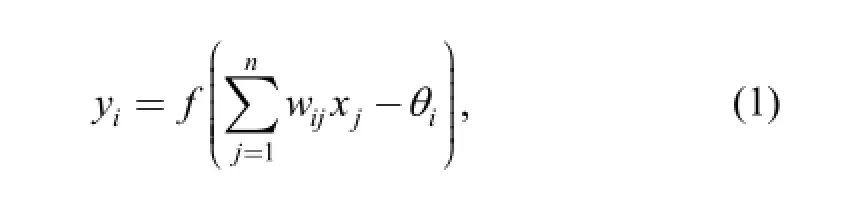
where yiis the ith unit output of the hidden or output layers,xjis the jth unit output of the previous layer, θiis the threshold of the ith node in the present layer, n is the total number of nodes in the previous layer, wijis the link weight of the jth node in the previous layer and the ith node in the present layer, f is the action function.
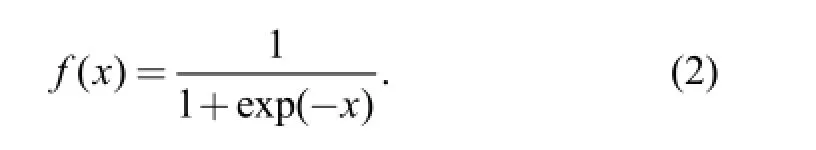
The action function is usually a sigmoid function, which can be expressed as follows:
The error function can be expressed as follows:
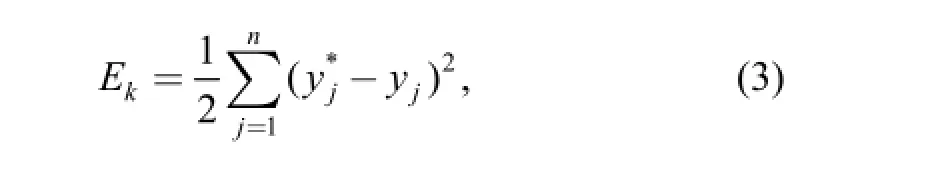
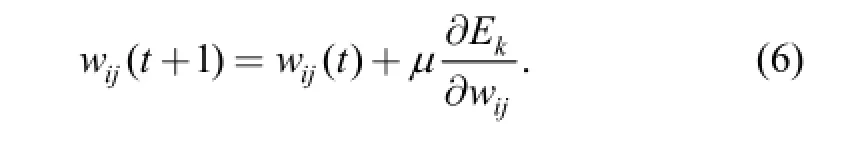
The use of the neural network's self-learning adjustment weight wijrequires that the error of the BP neural network learning algorithm satisfy the condition Ek≤ε. If this condition is not satisfied, then the error in each layer is reverse calculated using the gradient descent method, i.e.,the reverse error propagation process.
Weight correction can be described as follows:
3 Wavelet Packet Coefficient Entropy
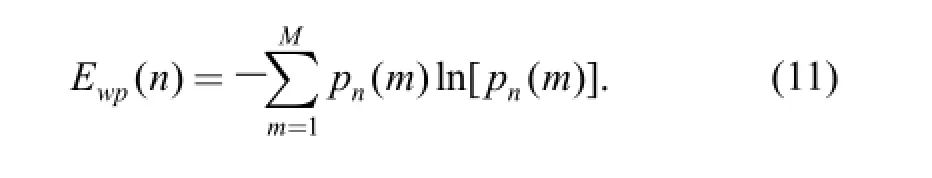
The founder of information theory, Shannon, proposed a measure of information based on a probabilistic statistical model, i.e., the entropy. In information theory, the entropy is a measure of the uncertainty of signal. Shannon entropy can be defined as follows:
If there exists a number of events in a system S, where S={s1, s2,…, sn}, the probability distribution of each event is P={p1, p2,…, pn}, and the information for each event itself is Ii=-piln pi. In addition, if pi=0, then piln(pi)=0.
Entropy is the sum of the information of all events and can be expressed as follows:
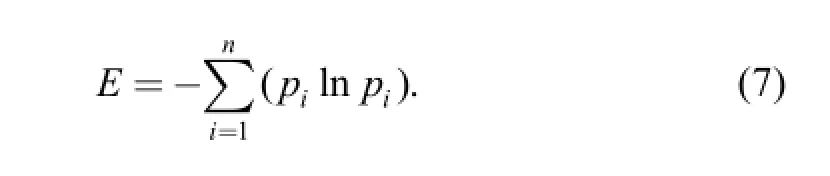
Thus, Shannon Entropy(E) is a measure of the information about a process in a certain state; it reflects signal uncertainty. From the broadband characteristics of pulse signals, we know that the number of impulse elements in a signal is directly proportional to the uniformity of the distribution of vibration energy in the entire frequency component and to the degrees of uncertainty and entropy in the system.
Therefore, wavelet packet transform coefficient entropy can be defined as follows:
Assuming the signal x(t) is decomposed using the wavelet packet transform to the jth identification level,producing 2jsubspaces, the coefficient for each subspace can be expressed as shown below:
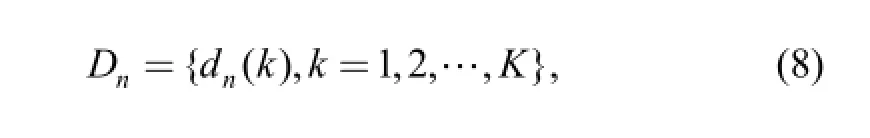
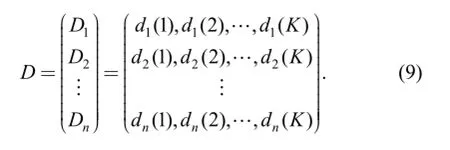
where n=1, 2,…, 2jand K is the length of the wavelet packet coefficient. In this case, all of the subspace wavelet coefficients in the jth identification level will constitute a matrix with the subspace coefficients as the row vectors of the matrix as follows:
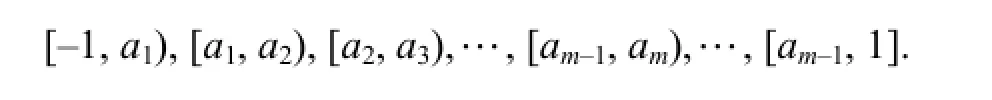
To provide a uniform standard of measure for all signals,all of the matrix elements are normalized to the [-1, 1]interval. The normalization is performed to retain the relative energy information of the different sub-frequency bands(i.e., the spectrum energy distribution of the signal) in the wavelet coefficients. Then, the interval [-1, 1] is divided into M equal-length intervals as follows (in the present study, M=20):
We can assume that the point corresponding to the wavelet packet coefficient Dnin the nth subspace is N in the[am-1, am] interval, because the length of the wavelet packet coefficient Dnis K. Then, the distribution probability of the wavelet coefficient in the interval [am-1, am) can be expressed as follows:
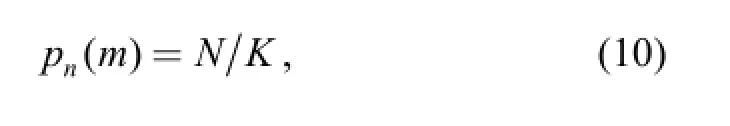
where n represents the nth subspace and m represents the mth interval. Then the wavelet packet transform coefficient entropy for the nth subspace can be defined as follows:
4 Experimental Confirmation
The experimental data were obtained from the Bearing Data Center website of Case Western Reserve University in the USA. As shown in Fig. 2, the test rig was composed of a 2-horsepower electric motor(left), a torque sensor/ encoder(center), a power meter(right) and control circuitry(not shown). The bearing under test supported the electric motor crankshaft. A few single-point pitting faults were induced in the test bearing through electrical discharge machining. The vibration data were collected by an acceleration sensor that is magnetically attached to the shell. The acceleration sensor was installed at the 12 o'clock position relative to the motor drive end and the fan end. The sampling frequency is set to 12 kHz.
Four different severity degrees of inner race single-point pitting faults were evaluated. The pitting diameters were 0.177 8 mm, 0.355 6 mm, 0.533 4 mm and 0.711 2 mm,each with a depth of 0.279 4 mm. Fig. 3 shows the WPCE histograms for different fault severity degree obtained using the aforementioned definition of WPCE.
As shown in Fig. 3, the signal entropy shows large differences in different frequency bands for the different severity degrees of faults. For example, for a pitting diameter of 0.177 8 mm, the entropy is relatively large inthe 1st, 2nd, 3rd, 4th, 7th and 8th frequency bands, whereas for a point pitting diameter of 0.533 4 mm, the entropy is relatively large in the 3rd and 7th frequency bands. Forty groups of training data were collected for each fault and 19 groups were tested. The hidden layer had 15 neurons and the output layer had 4. The maximum convergence number was 1000, the target error was 0.001, and the learning rate was 0.1. The training error change curve shown in Fig. 4 was iterated 10 times, with a relatively fast convergence rate so that it was within the target error level. Vectors (1 0 0 0), (0 1 0 0), (0 0 1 0) and (0 0 0 1) were used to represent the fault levels, which were 0.177 8 mm, 0.355 6 mm,0.533 4 mm and 0.711 2 mm. Results were obtained with an accuracy of 100%. A part of the test results is shown in Table 1.
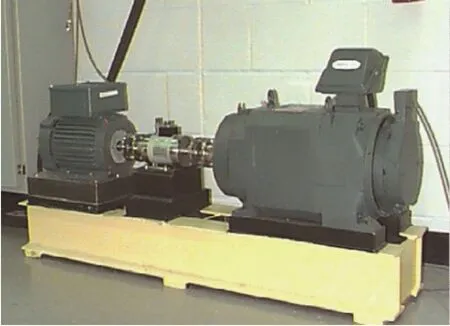
Fig. 2. Test rig of Case Western Reserve University
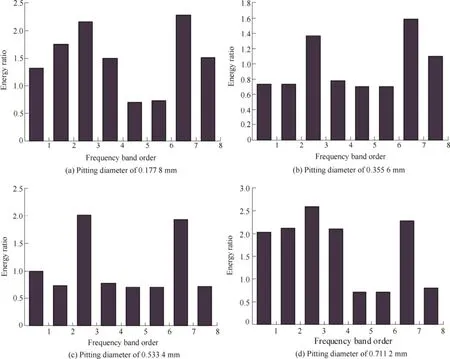
Fig. 3. Wavelet packet coefficient entropy histograms for different severity fault degrees
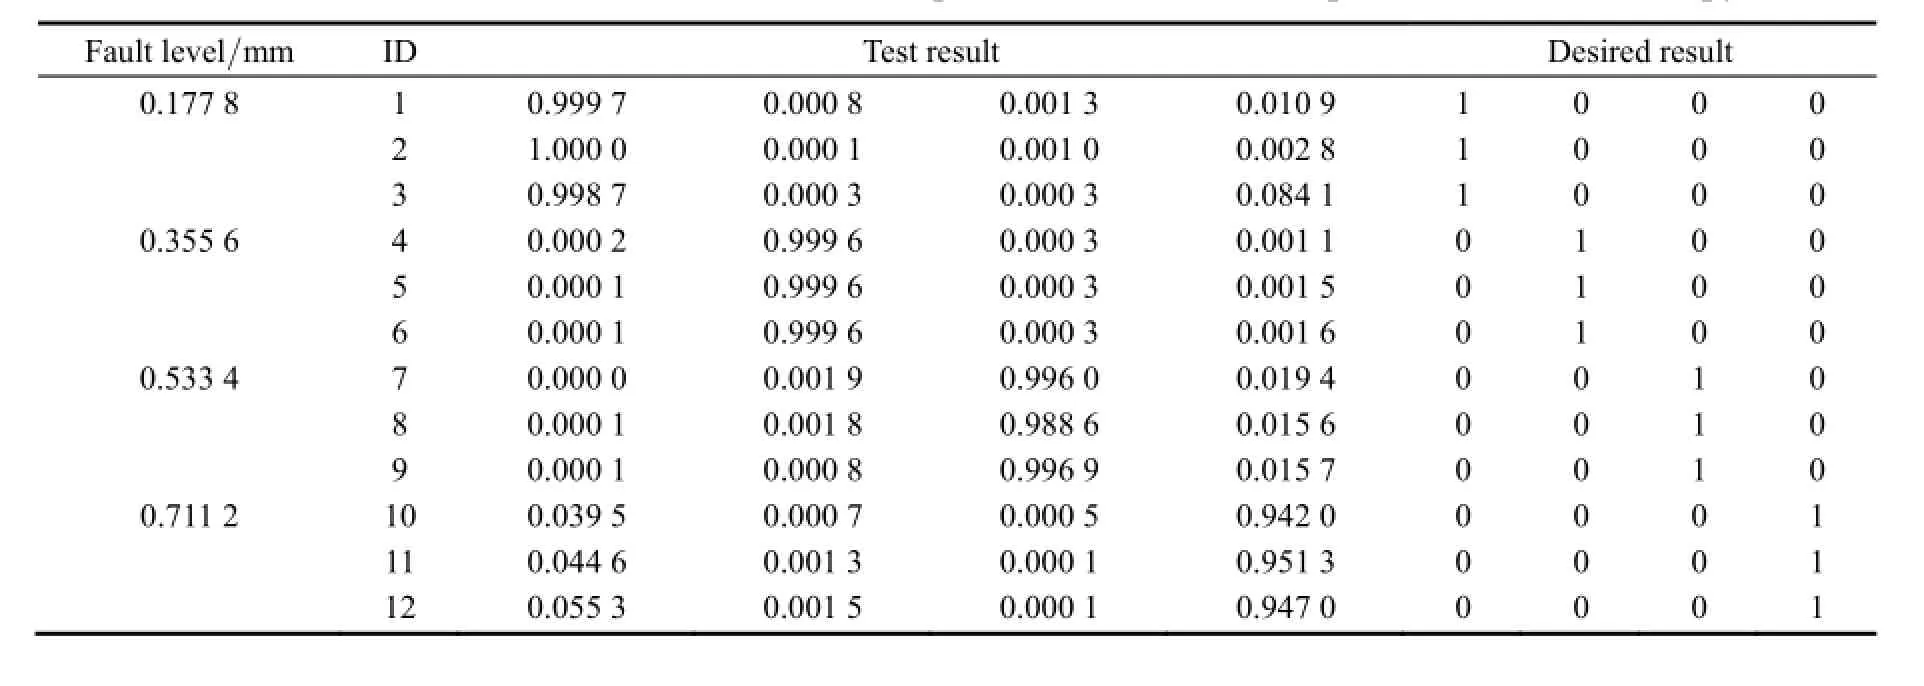
Table 1. Part of the network test results for experimental data wavelet packet coefficient entropy
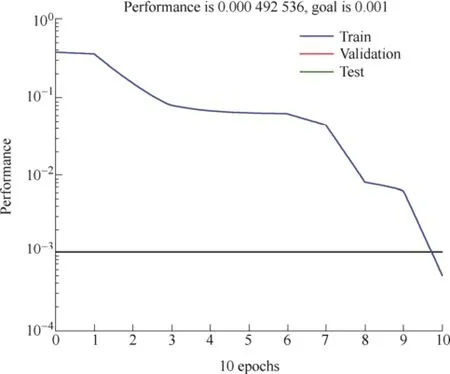
Fig. 4. Training error with wavelet packet coefficient entropy
For the same data samples, we studied the wavelet packet decomposition energy ratios in the three levels and repeated the above analysis to obtain histograms for the energy ratios in different frequency bands for different fault degrees. As shown in Fig. 5, the differences in the wavelet packet energy distributions for different fault severity degrees were not significant and were mostly concentrated in the 3rd and 7th frequency bands. Likewise, the introduction of the three levels of wavelet packet decomposition energy ratios of the above data samples into the BPNN failed to provide ideal results, where the results are shown in Table 2. The maximum value in each dataset that is greater than or equal to 0.6 is considered representative of the fault type of the test results. In this case, all seven groups of results are incorrect. The test accuracy is 90.8%.
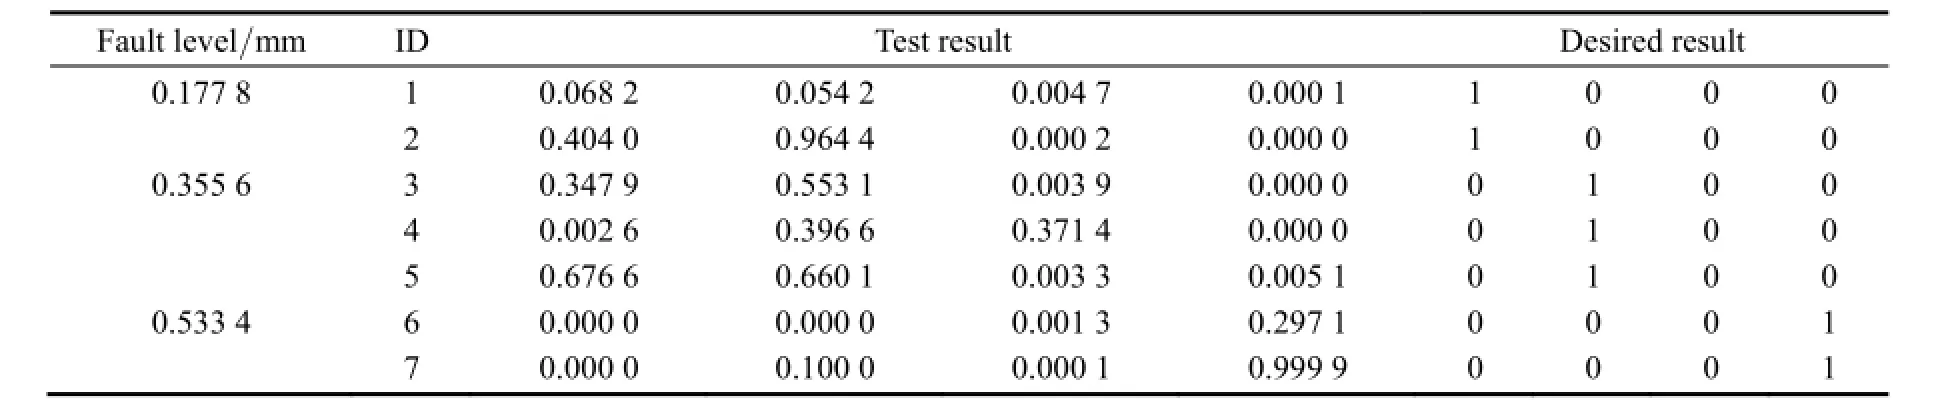
Table 2. Network test results for experimental data wavelet packet energy ratio
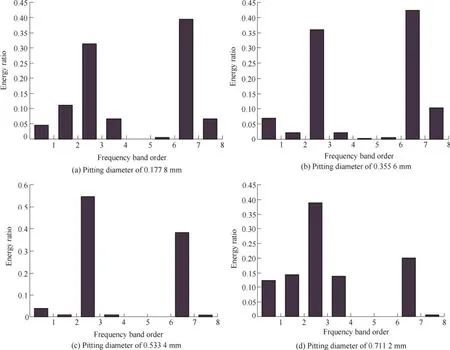
Fig. 5. Wavelet packet energy ratio histograms for different fault degrees
From the above experimental results, we conclude that three levels of WPCE are more sensitive than the energy ratio for the analysis of different levels of the same type of fault, and that they can achieve more ideal results if enteredas characteristic input vectors into BPNN.
5 Application in Engineering
A high-speed wire gearbox real-time monitoring system in a steel company had detected a safety risk at a particular measurement point on December 17, and had displayed a characteristic upward trend in the peak value of the vibration signal at the measurement point beginning December 15. The probability density curve was very steep and significantly deviated from the standard probability density normal distribution. The time-domain curve also contained an impulse. To analyze the early stages of the creation and development of the fault, 48 groups of historical data were extracted for four days—November 15,November 25, December 5 and December 15 and were named type A, B, C and D respectively. Three levels of WPCE were entered into a BP neural network as characteristic input vectors for analysis.
Thirty groups of data from each of the datasets A, B, C and D were randomly selected as training data and 18 groups in each type were selected as the test data. BP network parameters were consistent with the validation part of the experiment. The training error transformation curve is shown in Fig. 6. Due to the complexity of the engineering data, the iteration number required for training reached 49.
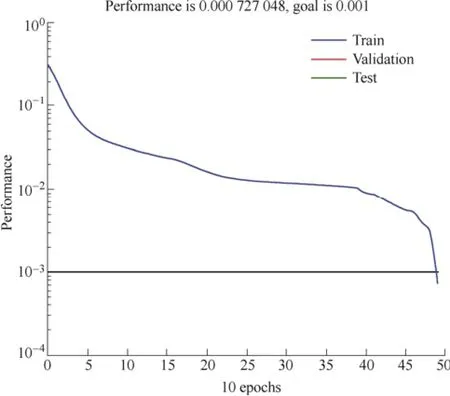
Fig. 6. Network training error curve for engineering data
Vectors (1 0 0 0), (0 1 0 0), (0 0 1 0) and (0 0 0 1) were used to represent the slight, weak, moderate and strong fault degrees, respectively, in the development of the fault. A part of the test results is shown in Table 3. From the above results, we concluded that the fault had developed to a very severity degree on December 15. The gearbox was opened for repair on December 17 and serious outer race point pitting was found in some bearings on the shaft, as shown in Fig. 7.
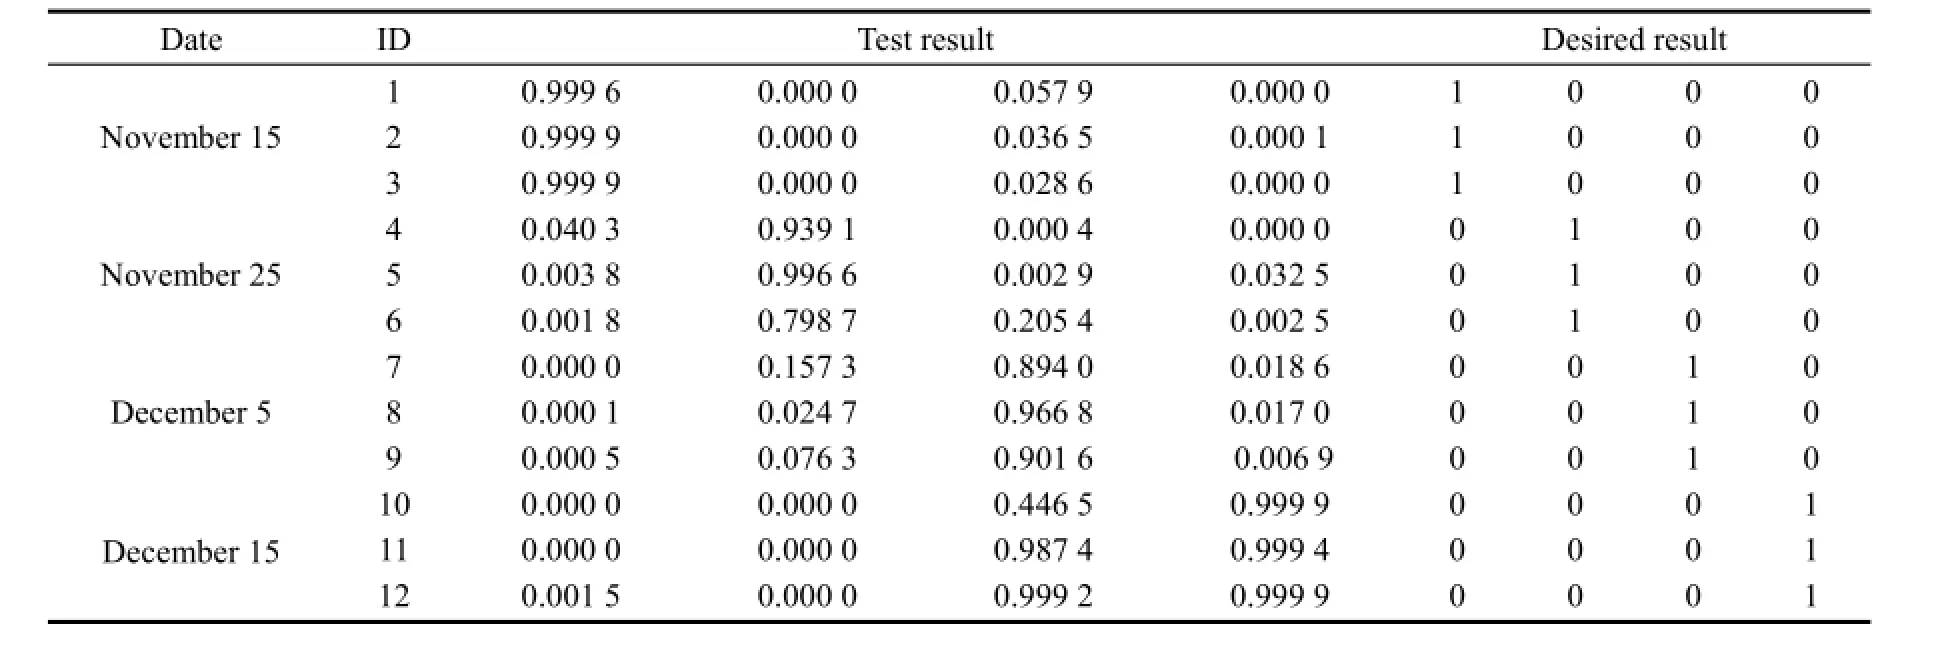
Table 3. Part of network test results for engineering data
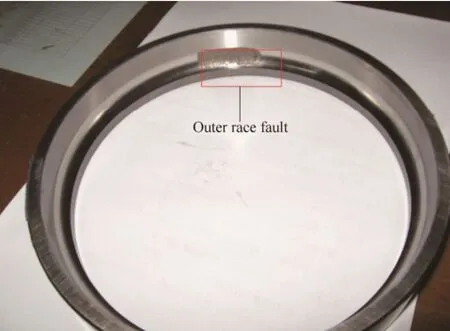
Fig. 7. Outer race fault on bearings in a high-speed wire gearbox in a steel company
6 Conclusions
(1) A new back-propagation neural network method based on wavelet packet decomposition coefficient entropy is proposed to realize the quantitative diagnosis of bearing fault. The experimental results show that WPCE is more sensitive in the recognition of different level of fault with an accuracy of 100% than the energy ratio with an accuracy of 90.8%.
(2) The engineering application has recognized the slight,weak, moderate and strong fault degree of the bearing single point pitting fault. The check result that a serious outer race point pitting has been found in some bearings of the gearbox can also confirm the conclusion.
[1] KONG Y S. Research on fault diagnosis method and application for rolling element bearing based on vibration signal[D]. Dalian: Dalian University of Technology, 2006. (in Chinese)
[2] RAFIEE J, RAFIEE M A, TSE P W. Application of mother wavelet functions for automatic gear and bearing fault diagnosis[J]. Expert Systems with Applications, 2010, 37(6): 4568-4579.
[3] QIU H, LEE J, LIN J, YU G. Wavelet filter-based weak signature detection method and its application on rolling element bearing prognostics[J]. Journal of Sound and Vibration, 2006, 289(4-5): 1066-1090.
[4] ABAD M R A A, AHMADI H, MOOSAVIAN A, et al. Discrete wavelet transform and artificial neural network for gearbox fault detection based on acoustic signals[J]. Journal of Vibroengineering,2013, 15(1): 459-467.
[5] PURUSHOTHAMA V, NARAYANAN S, PRASAD S A N. Multi-fault diagnosis of rolling bearing elements using wavelet analysis and hidden Markov model based fault recognition[J]. NDT&E International, 2005, 38(8): 654-664.
[6] WANG Y, XU G H, LIANG L, et al. Detection of weak transient signals based on wavelet packet transform and manifold learning for rolling element bearing fault diagnosis[J]. Mechanical Systems and Signal Processing, 2015, 54-55: 259-276.
[7] RAJESWARI C, SATHIYABHAMA B, DEVENDIRAN K, et al. Bearing fault diagnosis using wavelet packet transform, hybrid PSO and support vector machine[J]. Procedia Engineering, 2014, 97: 1772-1783.
[8] JACK L B, NANDI A K, MCCORMICK A C. Diagnosis of rolling element bearing faults using radial basis function networks[J]. Applied Signal Processing, 1999, 6(1): 25-32.
[9] SREEJITH B, VERMA A K, SRIVIDYA A. Fault diagnosis of rolling element bearing using time--domain features and neural networks[C]//3rd International Conference on Industrial and Information Systems, Indian Inst Technol Kharagpur, India, Dec 08-10 , 2008: 1-6.
[10] SUBRAHMANYAM M, SUJATHA C. Using neural networks for the diagnosis of localized defects in ball bearings[J]. Tribology International, 1997, 30: 739-752.
[11] LI B, GODDU G, CHOW, M Y. Detection of common motor bearing faults using frequency-domain vibration signals and a neural network based approach[C]//Proceedings of American Control Conference, Philadelphia, PA, Jun 24-26, 1998: 2032-2036.
[12] JAOUHER B A, NADER F, LOTFI S, et al. Application of empirical mode decomposition and artificial neural network for automatic bearing fault diagnosis based on vibration signals[J]. Applied Acoustics, 2015, 89: 16-27.
[13] KUMAR H S, SRINIVASA PAI P S, SRIRAM N S, et al. ANN based evaluation of performance of wavelet transform for condition monitoring of rolling element bearing[J]. Procedia Engineering,2014, 64: 805-814.
[14] HU Y B, XIE J, HU L B. Fault diagnosis of rolling bearing based on neural network and wavelet transform[J]. Machine Design and Research, 2013, 29(6): 33-35. (in Chinese)
[15] WU J D, LIU C H. An expert system for fault diagnosis in internal combustion engines using wavelet packet transform and neural network[J]. Expert Systems with Applications, 2009, 36(3): 4278-4286.
[16] MURUGANATHAM B, SANJITH M A, KRISHNAKUMAR B, et al. Roller element bearing fault diagnosis using singular spectrum analysis[J]. Mechanical Systems and Signal Processing, 2013, 35(1-2): 150-166.
[17] WANG C C, KANG Y, SHEN P C, et al. Applications of fault diagnosis in rotating machinery by using time series analysis with neural network[J]. Expert Systems with Applications, 2010, 37(2): 1696-1702.
[18] YU Y, YU D J, CHENG J S. A roller bearing fault diagnosis method based on EMD energy entropy and BPNN[J]. Journal of Sound Vibration, 2006, 294(1-2): 269-277.
[19] GAO L X, REN Z Q, TANG W L, et al. Intelligent gearbox diagnosis methods based on SVM, wavelet lifting and RBR[J]. Sensors, 2010(10): 4602-4621.
[20] HONG H, LIANG M. Fault severity assessment for rolling element bearings using the Lempel-Ziv complexity and continuous wavelet transform[J]. Journal of Sound and Vibration, 2009, 320: 452-468.
[21] ZHAO S F, LIANG L, XU G H, et al. Quantitative diagnosis of a spall-like fault of a rolling element bearing by empirical mode decomposition and the approximate entropy method[J]. Mechanical Systems and Signal Processing, 2013, 40(1): 154-177.
[22] XIE P, DU Y H. Crack rotor dynamic feature analysis and diagnosis method based on information entropy[J]. Journal of Mechanical Engineering, 2009, 45(1): 195-199. (in Chinese)
Biographical notes
CUI Lingli, born in 1976, is currently an associate professor at Key Laboratory of Advanced Manufacturing Technology, Beijing University of Technology, Beijing, China. Her main research interest is mechanical equipment fault diagnosis.
Tel: +86-136-91178029; E-mail: acuilingli@163.com
MA Chunqing, born in 1990, is currently a master candidate at Key Laboratory of Advanced Manufacturing Technology, Beijing University of Technology, Beijing, China.
E-mail: machunqing1990@163.com
ZHANG Feibin, born in 1986, is currently a teacher at School of Engineering, Jiangxi Agricultural University, Nanchang, China. He received his PhD degree from Beijing University of Technology, Beijing, China, in 2014.
Email: zfbin2008@163.com
WANG Huaqing, born in 1973, is currently a professor at School of Mechanical and Electrical Engineering, Beijing University of Chemical Technology, China. His main research interest is mechanical equipment fault diagnosis.
E-mail: wanghq_buct@hotmail.com
10.3901/CJME.2015.0715.094, available online at www.springerlink.com; www.cjmenet.com; www.cjme.com.cn
* Corresponding author. E-mail: zfbin2008@163.com
Supported by National Natural Science Foundation of China(Grant Nos. 51175007, 51075023)
© Chinese Mechanical Engineering Society and Springer-Verlag Berlin Heidelberg 2015
November 11, 2014; revised July 8, 2015; accepted July 15, 2015
杂志排行

Chinese Journal of Mechanical Engineering的其它文章
- Influence of Alignment Errors on Contact Pressure during Straight Bevel Gear Meshing Process
- Shared and Service-oriented CNC Machining System for Intelligent Manufacturing Process
- Material Removal Model Considering Influence of Curvature Radius in Bonnet Polishing Convex Surface
- Additive Manufacturing of Ceramic Structures by Laser Engineered Net Shaping
- Kinematics Analysis and Optimization of the Fast Shearing-extrusion Joining Mechanism for Solid-state Metal
- Springback Prediction and Optimization of Variable Stretch Force Trajectory in Three-dimensional Stretch Bending Process