Effect of Surface Topography on Stress Concentration Factor
2015-11-01CHENGZhengkunandLIAORidong
CHENG Zhengkun and LIAO Ridong
School of Mechanical Engineering, Beijing Institute of Technology, Beijing 10081, China
Effect of Surface Topography on Stress Concentration Factor
CHENG Zhengkun and LIAO Ridong*
School of Mechanical Engineering, Beijing Institute of Technology, Beijing 10081, China
Neuber rule and Arola-Ramulu model are widely used to predict the stress concentration factor of rough specimens. However,the height parameters and effective valley radius used in these two models depend strongly on the resolution of the roughness-measuring instruments and are easily introduce measuring errors. Besides, it is difficult to find a suitable parameter to characterize surface topography to quantitatively describe its effect on stress concentration factor. In order to overcome these disadvantages, profile moments are carried out to characterize surface topography, surface topography is simulated by superposing series of cosine components, the stress concentration factors of different micro cosine-shaped surface topographies are investigated by finite element analysis. In terms of micro cosine-shaped surface topography, an equation using the second profile moment to estimate the stress concentration factor is proposed, predictions for the stress concentration factor using the proposed expression are within 10% error compared with the results of finite element analysis, which are more accurate than other models. Moreover, the proposed equation is applied to the real surface topography machined by turning. Predictions for the stress concentration factor using the proposed expression are within 10% of the maximum stress concentration factors and about 5% of the effective stress concentration factors estimated from the finite element analysis for three levels of turning surface topographies under different simulated scales. The proposed model is feasible in predicting the stress concentration factors of real machined surface topographies.
surface topography, profile moments, stress concentration factor, finite element method
1 Introduction*
The fatigue life of a machined part depends strongly on its surface quality. The evaluation of surface quality can be divided into two parts, first, the external aspects of topography, texture and second, the internal subsurface aspects of metallurgy, hardness and residual stress[1]. Each aspect of the surface quality interacts with each other and acts in a complex manner in influencing the fatigue performance. In engineering design, the effects of these parameters are generally accounted for by using empirical reduction factors, which would modify the endurance limit of the material[2-4]. However, the use of this empirical method has some limitations due to its restricted area of validity. Indeed, changing the machining process or machining parameters must then be accompanied by a new definition of reduction factors and surface specifications that must be validated by performing new fatigue tests. On the other hand, this empirical method established by time-consuming and expensive fatigue tests is not only conservative in the usage of predicting structure fatigue strength, but also has less scientific basis[5]. Therefore, it is essential to study the effect of machined surface quality on structure fatigue behavior rather than simply relying on empirical reduction factors.
In general, the fatigue strength of engineering components increases with a decrease in the surface roughness[6]. The profile valleys of surface topography can give rise to microscopic stress raisers, The height as well as stress gradient surrounding topological features were found to determine stress concentration leading to fatigue failures[7]. It was reported that the evaluation of fatigue limit of machined specimen is closely related to the stress concentration factor(SCF) induced by surface topography[8-9]. It is therefore of great concern to predict the SCF induced by surface topography.
In order to quantitatively estimate the SCF imposed by surface topography, some valuable achievements were obtained. Neuber rule[10]can be seen as the first expression for evaluating SCF of surface topography. Based on Neuber rule, AROLA and RAMULU[11]suggested another model to predict the SCF. In the case of AISI 4130 CR steel[8],Arola-Ramulu model provided better estimation of the fatigue stress concentration factor than Neuber rule. The height parameters and effective valley radius of surface topography used in these two models are regarded as the most critical parameters in determining the SCF of surface topography. However, it has been demonstrated that surface roughness exhibits a feature of geometric self-similarity and self-affinity[12], by which the height parameters and the effective valley radius depend strongly on the resolution of the roughness-measuring instruments. In addition, the effective valley radius is generally measured by a graphical radius gauge, which is difficult to operate and easily introduce errors to estimate the SCF. To overcome the aforementioned problems, the finite element description of the surface profile was used to analyze the SCF imposed by surface topography. SURARATCHAI, et al[5], interpolated the measured surface profile points with a spline function and built up the finite element model, a linear elastic material model was used to calculate the SCF imposed by surface roughness. AS et al. used the cubic Be'zier spline formulation to interpolate the measured surface profile[13-14],the finite element meshing and calculations were done in the MATLAB toolbox FEMLAB. The highest ten values of SCFs of the valleys were extracted and the highest subsurface stress field at these locations were used to account for crack initiation mechanisms.
Despite enough efforts were made by these researchers,it is still difficult to find a suitable parameter to characterize surface topography to quantitatively describe its effect on SCF. In this study, the machined surface topography is simulated by superposing series of cosine components,finite element method is used to investigate the effect of surface topography on SCF. In terms of the micro cosine-shaped surface topography, an equation using the second profile moment parameter to evaluate the SCF is proposed. And the application of the proposed expression to true surface topography machined by turning is examined.
2 Characterization of Surface Topography
Surface topography can be regarded as a stationary stochastic process, and the true surface topography can be simulated by superposing series of cosine components by means of spectrum analysis[9]. The simulated surface topography can be expressed as
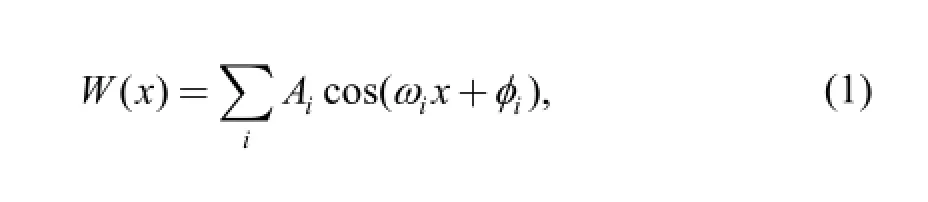
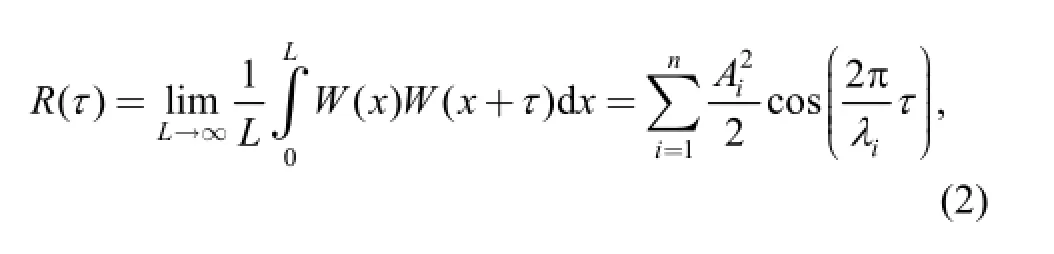
where W(x) is the simulated profile, Aiis the amplitude of i-th cosine wave,is the angle frequency of i-th cosine waveis the cycle of i-th cosine wave anddenotes the phase of the i-th cosine wave. The autocorrelationof the simulated surface topography function is as follows:
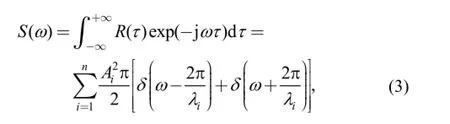
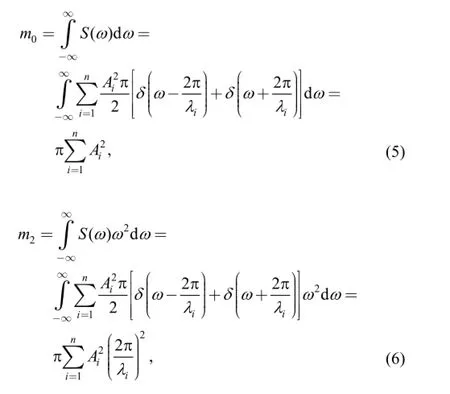
The moments of profile power spectrum is defined as[16]
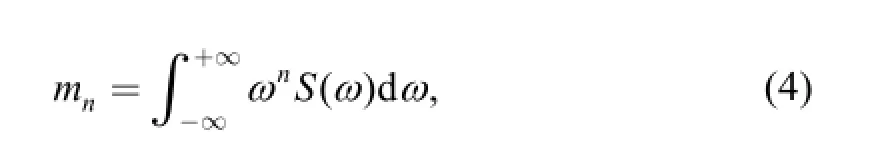
accordingly, the zeroth and second profile moments can be written as
3 Effect of micro cosine-shaped surface topography on stress concentration factor
3.1 Finite element analysis
It is almost impossible to theoretically analyze the SCF of a real complex surface topography. Here, in order to quantitatively analyze the effect of true machined surface topography on SCF, surface topography simplified as one cosine component is evaluated first. Then surface topography simulated by superposing more cosine components will be discussed.
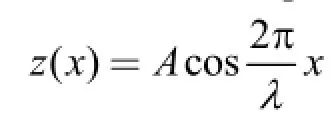
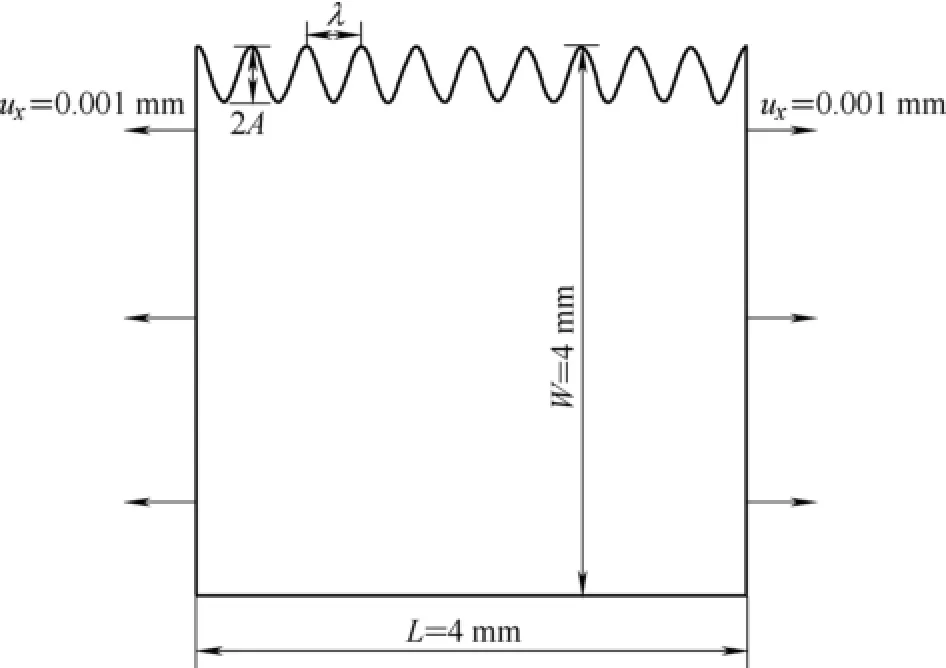
Fig. 1 Schematic illustration of the model analyzed by FEM
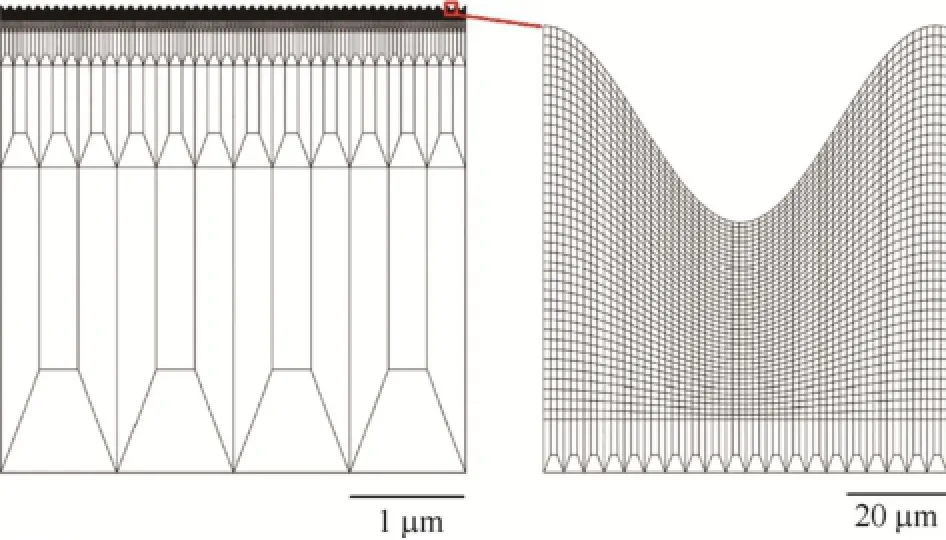
Fig. 2 Finite element mesh of cosine-shaped surface topography
A series of surface topographies were created by changing the wavelengths and valley depths, the SCFs were calculated and shown in Table 1.
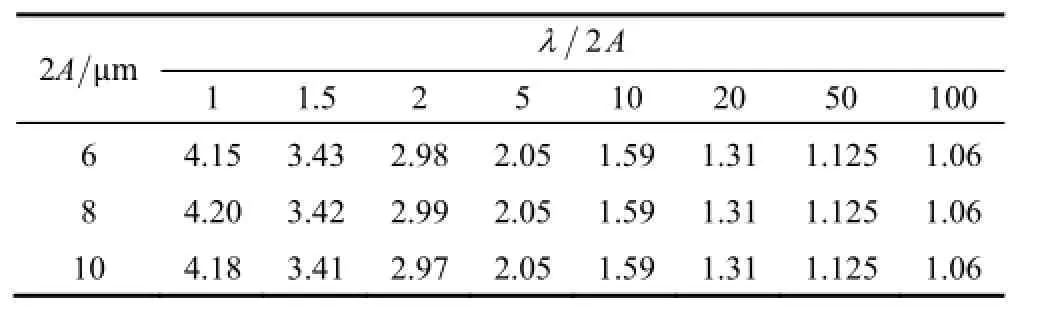
Table 1. SCFs of different cosine-shaped surface topography
It can be obtained from Table 1 that, with a increase of the ratio between wavelength(λ) and depth(2A) of the cosine-shaped micro-notches, the SCF Ktdecreases. Besides, the SCFs are almost equal for a group of models with the same ratio 2.Aλ/
3.2 Effect of the profile moments on stress concentration factor
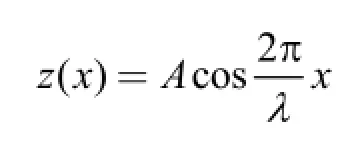
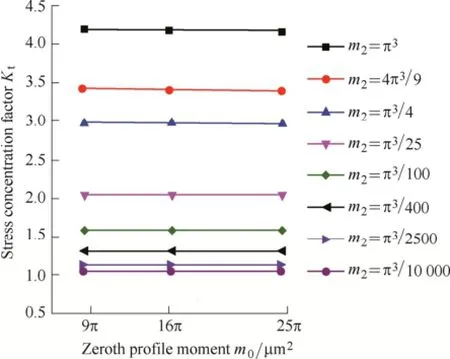
Fig. 3 Relationship between the profile moments and the SCFs
It can be seen from Fig. 3 that the effect of micro cosine-shaped surface topography on SCF is independent on the zeroth profile moment, but closely related to the second profile moment. The SCF grows with a increase of surface second profile moment. The relationship between SCF and the second profile moment of the micro cosine-shaped surface topography is shown in Fig. 4. By fitting the SCFs and the second profile moments, Eq. (7)was obtained, the fitting correlation coefficient is 0.995.
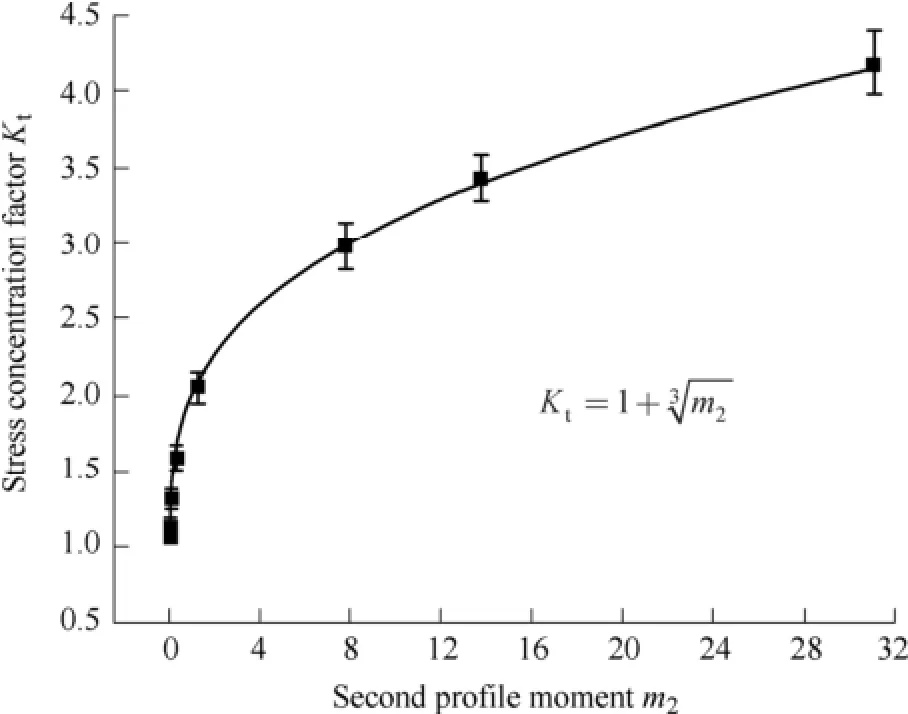
Fig. 4 Relationship between SCF and second profile moment of the cosine-shaped surface topography
3.3 Comparison of models for predicting stress concentration factor
NEUBER[10]proposed a semi empirical expression for SCF induced by surface roughness as follows:
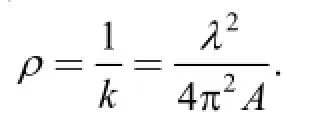
where ρ is the mean radius of profile valleys, n is the state of stress(n=1 represents the shear stress, n=2 represents the tensile stress), λ refers to the ratio between spacing and depth of the asperities and is quite difficult to define for machined surface texture, it has been suggested that 1λ= is an approximate choice for mechanically processed surfaces[8].
AROLA and RAMULU[11]suggested the SCF induced by surface roughness could be calculated according to
where Ktis the effective SCF,is the effective valley radius of surface texture and represents the average radius determined from the dominant profile valleys.
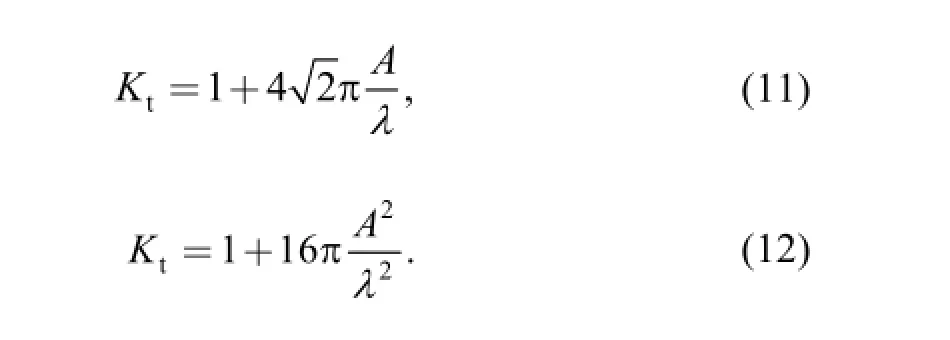
Substituting Ra, Ry, Rzand ρ of the micro cosineshaped surface topography into Eq. (8) and Eq. (9), Neuber rule and Arola_Ramulu model can be transformed into Eq.(11) and Eq. (12) respectively:
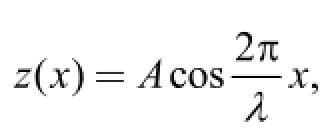
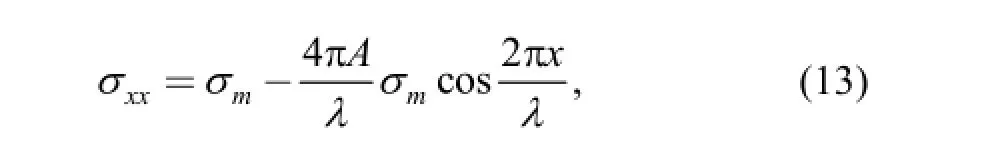
wheremσ is the nominal stress andxxσ is the surface stress along the applied load direction, the SCF of such surface topography is obtained as follows:
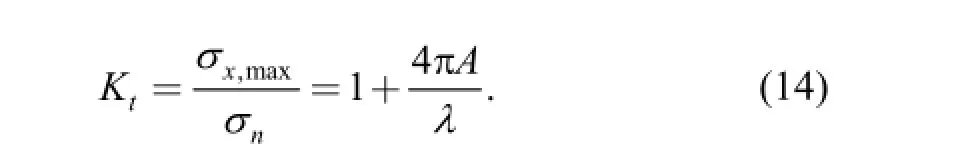
Based on the parameters of micro cosine-shaped surface topographies in Table 1, Fig. 5 shows the comparison betweenby each formula method(Eqs. (7),(11), (12), (14)) andby the FEM. The SCF can be predicted within 10% error by Eq. (7), and the greater 2Aλ/ is, the closer thecomes toFrom Fig. 5, when the micro cosine-shaped surface topography satisfies 2A/λ<0.2, the SCF can be predicted within ±10% error by Eq. (14). The smaller 2Aλ/ is, the closer thecomes to, and the predicted results by Eq. (14) is more precise than the predicted results by Eq. (7). Fig. 5 also shows that the SCF predicted by Arola-Ramulu model is more conservative than the SCF predicted by Neuber rule under the condition of 2A/λ<0.65. However, the predicted results by Eq.(11) and Eq. (12) are not accurate compared to the results by the FEM analysis except for 2A/λ<< 1.
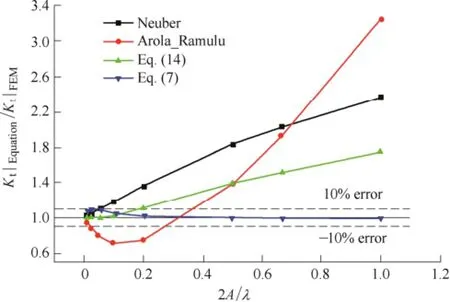
Fig. 5 Comparison analysis between each model result and the FEM result
4 Stress Concentration Factor of Surface Topography Machined by Turning
In this section, the proposed model for the micro cosine-shaped surface topography is extended to the real machined surface topography. The validity of the proposed equation was examined by using the real surface topography of 42CrMo steel. Three levels of surface topographies were processed by turning on the surface of 42CrMo steel bars, respectively, Ra=3.07 μm; Ra=5.19 μm; Ra=7.82 μm, which are shown in Fig. 6. Surface topography of each specimen is measured by TR300 stylus roughness measuring instrument.
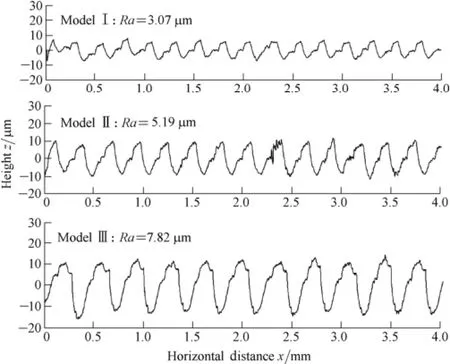
Fig. 6 Turning surface topography
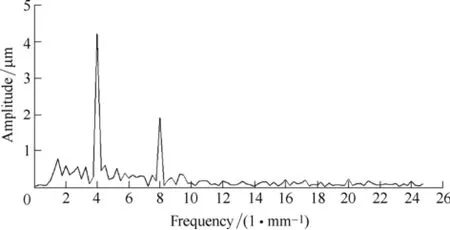
Fig. 7 Amplitude and frequency analysisof true surface topography of model I
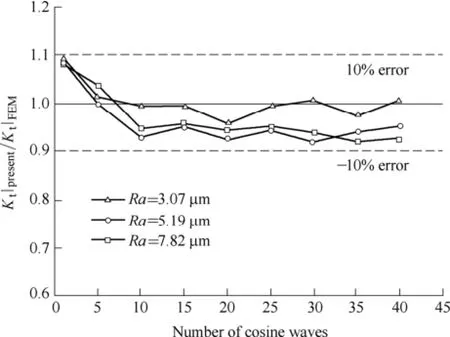
Fig. 8 Relation between Kt|present/ Kt|FEMand the numberof cosine waves to simulate true surface topography
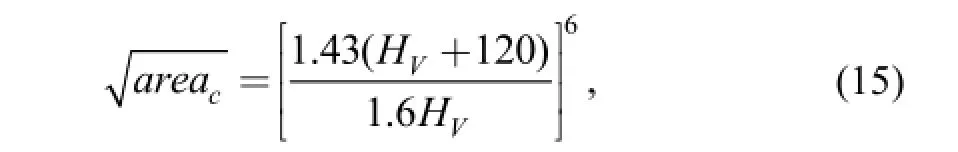
where HVis a micro Vickers hardness, for surface topography, the lower limit of defect depthminc is approximately given by the following equation[19]:
Because the defect with depth smaller thanminc has no effect on the fatigue limit, so surface topography can be coarse-gained, the high frequency components are removed from the topography profile so as to meet the following equation[20]:
Fig. 9 shows the analyzed surface topography, the solid line is the machined surface topography of model I; the chained line is the simulated surface topography of model I. Fig. 10 shows Ktand σ1/σx∞of the profiles in Fig. 9. σx∞is the nominal stress and σxxis the surface stress along the applied load direction. The solid line is the σ1/σx∞distribution of the simulated surface topography of model I which was calculated by FEM method, the open circle and triangle marks were the highest 10 SCFs and the maximum SCF of the simulated surface topography. All peaks on the σ1/σx∞distribution occur at the valley roots of the simulated surface topography in Fig. 9 and the direction of the σ1corresponds to that of the σx∞. The maximum Ktvalue occurs at the horizontal position xj= 1.9 mm in the simulated surface topography, where the valley of simulated surface topography is deeper than the rue machined surface topography, so the maximum Ktalculated by FEM with the simulated surface topography ontains some errors. Therefore, the maximum Ktcannot be used to fully characterize the intensity of stress concentration induced by surface topography. Here, the effective SCFis introduced to replace Ktto describe the intensity of stress concentration imposed by surface topography, the mean value of the highest 10 SCFs of the simulated surface topography is the effective SCF as follows:
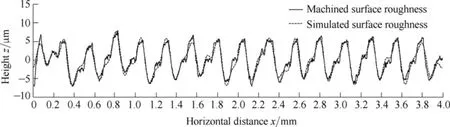
Fig. 9 Machined surface topography and simulated surface topography of Model I
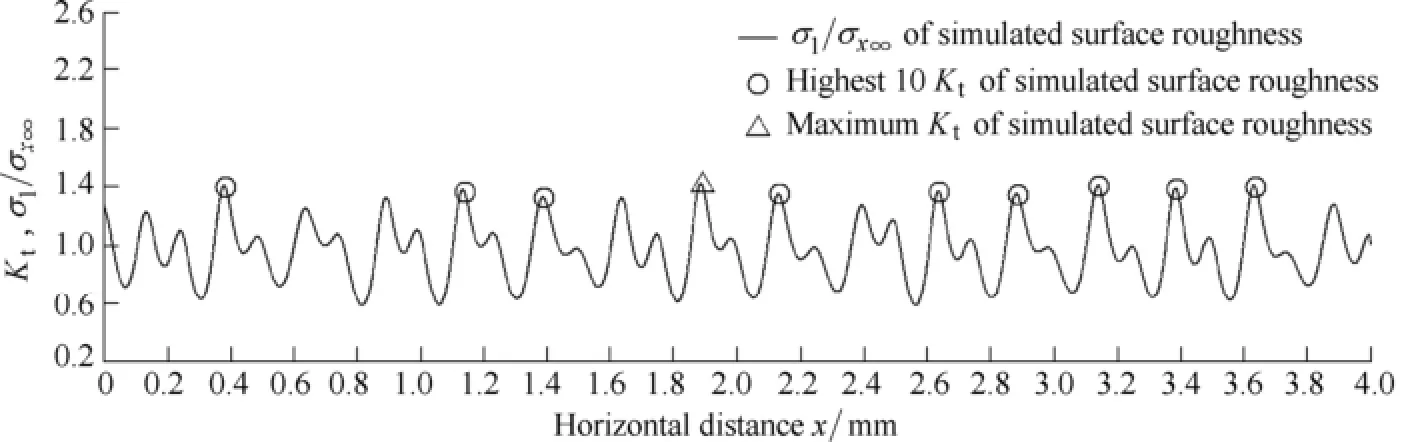
Fig. 10 SCF and equivalent stress distribution of Model I
Surface topography of model I, II, III are coarse-gained by Eqs. (15), (16), (17) and the SCF of the three models are estimated by the present method of Eq. (7). Table 2 shows the SCF of different models based on the present method(Eq. (7)) and the SCFs and the effective SCFs of different models due to FEM analysis. It can be concluded that the SCF of surface topography can be approximately predicted by the present method of Eq. (7) with the second profile moment of simulated surface topography.
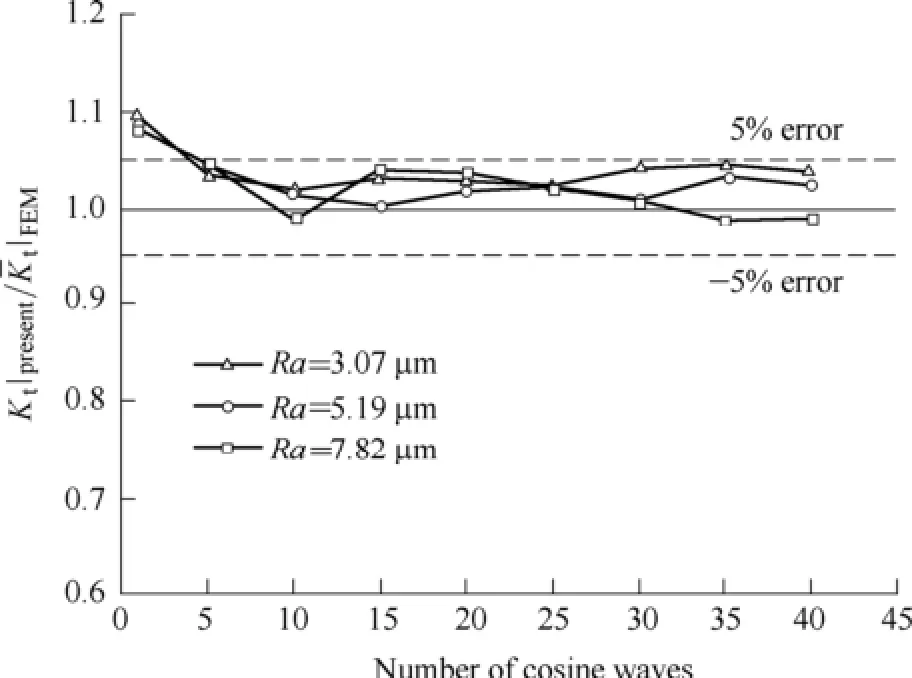
Fig. 11 Relation betweenand the number of cosine waves to simulate true surface topography
Table 2 shows the maximum Ktmay be underestimated by Eq. (7) compared with FEM solutions, because the valley radius of the weakest position is underestimated by cutting off high order wave components in simulating true surface topographies. However, the effective SCFcan be well estimated by Eq. (7) compared with FEM solutions. AS et al. numbered the highest ten values of Ktof rough specimens and investigated the crack initiation positions[5],the results indicated that the crack initiation occurs at the valley with the highest subsurface stress field rather at the valley with maximum Kt. Therefore, it is meaningful to use the effective SCFto characterize the total intensity of stress concentration imposed by surface topography. Though Eq. (7) is obtained by FEM analysis of micro cosine-shaped surface topography, it is effective to estimate the effective SCFof true surface topography machined by turning. The proposed method is convenient to predict the effective SCF of machined surface topography for it is escaped to measure the effective valley radius of surface texture.
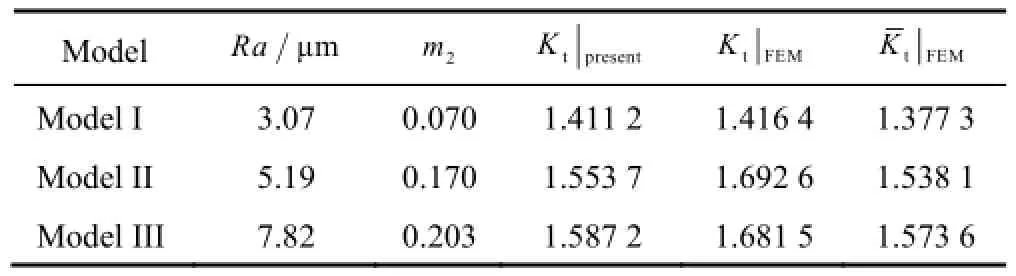
Table 2. FEM and present solutions of different models
5 Conclusions
(1) The SCF induced by surface topography is closely associated with the simulated scale of surface texture, in order to predict the SCF imposed by surface topography, a practical method using the second profile moment to estimate the SCF of the surface topography is proposed.
(2) The effect of surface topography on SCF can be characterized by the second profile moment. When the surface topography is simplified as micro cosine-shaped topography, the SCF induced by such surface topography can be predicted within 10% error using the proposed equation. Compared with the FEM analysis, the results predicted by the proposed model is more precise than the results predicted by Neuber rule and Arola-Ramulu model.
(3) The validity of the proposed model is examined by using the real surface topography machined by turning. Surface topography is simulated by superposing several cosine components, the SCF of surface topography can be predicted by the proposed model under different simulated scale. Comparing the SCF estimated by the proposed model with the maximum SCF calculated by FEM, all of the SCF are within about 10% error. Comparing the SCF estimated by the proposed model with the effective SCF calculated by FEM, all of the SCF are within about 5% error except for the single cosine wave to simulate surface topography.
Acknowledgements
The authors would like to acknowledge professor LV Wei and LI Chengui for their discussion and encouragement throughout the preparation of the manuscript.
[1] GRIFFITHS B. Manufacturing surface technology. surface integrity and functional performance[M]. London: Penton Press, 2001.
[2] JUVINALL R C. Engineering considerations of stress, strain and strength[M]. McGraw-Hill, 1967.
[3] JUVINALL R C, MARSHEK K M. Fundamentals of machine component design[M]. New York: John Willey & Sons, Inc., 1991.
[4] MCKELVEY S A, FATEMI A. Surface finish effect on fatigue behavior of forged steel[J]. International Journal of Fatigue, 2012,36: 130-145.
[5] SURARATCHI M, LIMIDO J, MABRU C, et al. Modeling the influence of machined surface roughness on the fatigue life of aluminium alloy[J]. International Journal of Fatigue, 2008, 30: 2119-2126.
[6] ZAHAVI E, TORBILO V. Fatigue design: life expectancy of machine parts[M]. 1st ed. Boca Raton, Florida: CRC Press, 1996.
[7] ARDI D T, LI Y G, CHAN K H K, et al. The effects of machined topography on fatigue life of a nickel based superalloy[C]//2nd CIRP Conference on Surface Integrity(CSI), Nottingham, Britain,May 28-30, 2014, 13: 19-24.
[8] AROLA D, WILLIAMS C L. Estimating the fatigue stress concentration factor of machined surfaces[J]. International Journal of Fatigue, 2002, 24: 923-930.
[9] AONO Y, NOGUCHI H. Fatigue limit reliability of axisymmetric complex surface[J]. International Journal of Fracture, 2005, 131: 59-78.
[10] NEUBER H. Kerbspannungslehre[M]. Berlin: Springer, 1958.
[11] AROLA D, RAMULU M. An examination of the effects from surface texture on the strength of fiber-reinforced plastics[J]. Journal of Composite Materials, 1999, 33(2): 101-123.
[12] MAJUMDAR A, TIEN C L. Fractal characterization and simulation of rough surfaces[J]. Wear, 1990, 136: 313-327.
[13] AS S K, SKALLERUD B, TVEITEN B W, et al. Fatigue life prediction of machined components using finite element analysis of surface topography[J]. International Journal of Fatigue, 2005, 27: 1590-1596.
[14] AS S K, SKALLERUD B, TVEITEN B W. Surface roughness characterization for fatigue life predictions using finite element analysis[J]. International Journal of Fatigue, 2008, 30: 2200-2209.
[15] CHIFFRE L De, LEONARDO P, TRUMPOLD H, et al. Quantitative characterization of surface texture[J]. Annals of the CIRP, 2000, 49(2): 635-652.
[16] THOMAS T R. Rough surfaces[M]. 2nd ed. London: Imperial College Press, 1999.
[17] FREUND L B, SURESH S. Thin film materials: Stress, defect formation and surface evolution[M]. Cambridge: Cambridge University Press, 2003.
[18] NOVOVIC D, DEWES R C, ASPINWALL D K, et al. The effect of machined topography and integrity on fatigue life[J]. International Journal of Machine Tools and Manufacture , 2004, 44: 125-134.
[19] MURAKAMI Y. Metal fatigue: effects of small defects and nonmetallic inclusions[M]. Elsevier, 2002.
[20] MIYAZAKI T, AONO Y, NOGUCHI H. A practical stress analysis for predicting fatigue limit of metal with axisymmetric complex surface[J]. International Journal of Fracture, 2007, 143: 355-367.
Biographical notes
CHENG Zhengkun, born in 1986, is currently a PhD candidate at Research Center for Power Machinery, School of Mechanical Engineering, Beijing Institute of Technology, China. His research interest is structural strength and reliability analysis, focusing on metal fatigue behavior induced by machining defects.
Tel: +86-10-13011298564; Email: zhengkun2005@163.com
LIAO Ridong, born in 1972, is currently a professor at Beijing Institute of Technology. He received his PhD degree from Beijing Institute of Technology, China, in 1999. His research interests include structure strength and surface reinforcement technology.
Tel: +86-10-68913041; E-mail: liaord@bit.edu.cn
10.3901/CJME.2015.0424.047, available online at www.springerlink.com; www.cjmenet.com; www.cjme.com.cn
* Corresponding author. E-mail: liaord@bit.edu.cn
Supported by National Defense Preliminary Research Project of China(Grant No. 104010205)
© Chinese Mechanical Engineering Society and Springer-Verlag Berlin Heidelberg 2015
January 20, 2014; revised April 17, 2015; accepted April 24, 2015
杂志排行

Chinese Journal of Mechanical Engineering的其它文章
- Influence of Alignment Errors on Contact Pressure during Straight Bevel Gear Meshing Process
- Shared and Service-oriented CNC Machining System for Intelligent Manufacturing Process
- Material Removal Model Considering Influence of Curvature Radius in Bonnet Polishing Convex Surface
- Additive Manufacturing of Ceramic Structures by Laser Engineered Net Shaping
- Kinematics Analysis and Optimization of the Fast Shearing-extrusion Joining Mechanism for Solid-state Metal
- Springback Prediction and Optimization of Variable Stretch Force Trajectory in Three-dimensional Stretch Bending Process