The Im pact of Surface Properties on Downward Surface Shortwave Radiation over the Tibetan Plateau
2015-04-20WANGLeidiDarenandHEQing
WANG Leidi,L¨U Daren,and HE Qing
1Key Laboratory of Middle Atmosphere and Global Environmental Observation,Institute of Atmospheric Physics, Chinese Academy of Sciences,Beijing100029
2University of Chinese Academy of Sciences,Beijing100049
The Im pact of Surface Properties on Downward Surface Shortwave Radiation over the Tibetan Plateau
WANG Leidi1,2,L¨U Daren∗1,and HE Qing1
1Key Laboratory of Middle Atmosphere and Global Environmental Observation,Institute of Atmospheric Physics, Chinese Academy of Sciences,Beijing100029
2University of Chinese Academy of Sciences,Beijing100049
The complexity of inhomogeneous surface–atmosphere radiation transfer is one of the foremostproblems in the field of atmospheric physics and atmospheric radiation.To date,the influence of surface properties on shortwave radiation has not been wellstudied.The daily downward surface shortwave radiation of the latest FLASHFlux/CERES(Fast Longwave And Shortwave Fluxes Time Interpolated and Spatially Averaged/Clouds and the Earth’s Radiant Energy System)satellite data was evaluated againstin situdata.The comparison indicated that the differences between the two data sets are unstable and large over rugged terrain compared w ith relatively flat terrain,and the mean absolute error of the satellite products reaches 31.4 W m-2(12.3%)over rugged terrain.Based on the SSF(single satellite footprint)/CERES product,the influence of surface properties on the distribution of downward surface shortwave radiation(DSSR)was analyzed.The influence of surface properties on DSSR over the Tibetan Plateau is about tw ice as large as that in two other regions located at the same latitude(eastern China–western Pacific and subtropical North Pacific).A simulation was carried out w ith the help of the I3RC(International Intercomparision of Three-Dimensional Radiation Code)Monte Carlo 3D radiative transfer community model.The results showed that DSSR increases as surface albedo increases.Moreover,the impact of surface albedo on DSSR is larger if the spatial distribution of clouds is more non-uniform.It is hoped that these results w ill contribute to the developmentof 3D radiative transfer models and the improvementof satellite inversion algorithms.
shortwave radiation,surface properties,Tibetan Plateau,satellite remote sensing
1.Introduction
Solar radiation is a significant source of heat for the earth–atmosphere system.The heterogeneity of surface solar radiation could affect the radiative energy budget,weather systems and climate change.The solar flux received by the surface involves the attenuation of insolation by scattering and absorption caused by atmospheric gases,aerosols,cloud particles,and surface properties.Among others,surface parameters generally include altitude,gradient,slope direction and surface albedo.Different surface properties result in different dynam ic and thermodynam ic processes,which influence the exchange of matter and energy between the land surface and the atmosphere.The surface albedo characterizes the surface reflection of solar radiation.It determ ines energy exchange between the surface and atmosphere, and it is a key factor influencing Earth’s climate system. Even a small change in surface albedo could shift the energy balance of the earth–atmosphere system,and result in regionaland globalclimate change(Wang etal.,2002;Stroeve et al.,2005).Over the Tibetan Plateau,the mean surface elevation is 4000 m above sea level.Its protruding nature w ith high elevation and complex surface properties results in equally complex weather and cloud systems over the region.There is a 3D radiative transfer problem in the inhomogeneous surface–atmosphere system.However,most radiative transfermodels and satellite inversion algorithms are highly simplified.Compared to atmospheric composition and clouds,the effects of surface properties on downward surface shortwave radiation(DSSR)have notbeen wellstudied until now.Thus,it is worth exploring the effects of surface properties on DSSR.
As an important complement to ground observations, satellite remote sensing provides data w ith preferable continuity and homogeneity in both time and space,and has become an effective way to study surface radiation budgets. However,satellite products may be severely biased due to input data inaccuracy,algorithm errors,and the influence of surface properties and elevation differences(Yang et al.,2006).Thecomplexityofspatialorientationandtheoptical propertiesofthesurfacehavesofarbeeninvestigatedina relativelylimitednumberofradiativetransferschemes(e.g., DubayahandRich,1995;Wangetal.,2005;Liouetal.,2007; Helbigetal.,2009;Leeetal.,2013;St¨ockli,2013).Theireffectsonthesurfacesolarradiationbudgethavenotbeenwell accountedforinthemostwidelyappliedradiativetransfer schemesinwhichthelowerboundaryisassumedtobeunobstructed,horizontal,andhomogeneous.Therefore,itisnecessarytovalidatesatellitedataagainstinsituobservations, becausesuchvalidationsnotonlyguaranteedataqualitybut alsoprovideusefulinformationtoimprovetheretrievalalgorithms.Meanwhile,climatesimulationsrequireaccurateand stableradiationbudgetdata,andtheproductsobtainedfrom spaceareusefulforclimateresearch(Ohringetal.,2005).
TheTibetanPlateauhasgreatimpactsonenergyandwatercyclesatbothregionalandglobalscales,makingita usefulresearchareafortestingthequalityofdataandthe estimationalgorithms.Yangetal.(2006,2008,2010)assessedthesatellite-estimatedsurfacedownwellingshortwave irradianceofISCCP-FD(InternationalSatelliteCloudClimatologyProject-FluxData)andGEWEX-SRB(GlobalEnergyandWaterCycleExperiment-SurfaceRadiationBudget)byusingtheinsitudataofseveralsurfacesitesover theTibetanPlateau.Comparisonsindicatedthattheerrors ofsatelliteproductsarespatiallydependentoverTibet,and discrepanciesbetweendifferentproductsareusuallylarger inthepresenceofhighlyvariableterrain.Guietal.(2009, 2010)comparedISCCP-FDandCERES-FSW(Cloudsand theEarth’sRadiantEnergySystem-MonthlyGriddedRadiativeFluxesandClouds)hourlysurfacesolarradiationwith groundmeasurements.Theresultsshowedthattheaccuracy ofsatellite-estimateddatacannotmeettherequirementsof researchcommunities,andsatellite-estimateddataoverthe TibetanPlateaumustbesubstantiallyimproved,especially fortheshortwavecomponents.
ObservationsshowthatthedownwardshortwaveradiationoverTibetismuchhigherthanthatoversealevelalong thesamelatitude(Maetal.,2005;Wangetal.,2013).Inadditiontothehighelevation,thereareseveralwest–eastelongatedhighmountainsandmanyhillsleadingtothecomplex terrain.Thecomplexterraincanaffectsolarradiationindirect(DubayahandRich,1995;DubayahandLoechel,1997; Kangetal.,2002;Wangetal.,2005;Ryuetal.,2008;Helbig etal.,2009)andindirect(Kuwagataetal.,2001;Kurosaki andKimura,2002)ways.Besidesclouds,theleadinguncertaintiesinsurfacefluxesoriginatefromthesurfaceandnearsurfaceatmosphericproperties(Zhangetal.,2006,2007).
Accordingtotheresultsofa3DMonteCarlophotontracingprogram,themeansurfacesolarfluxoveraregionwith complextopographycandeviatefromasmoothsurfacebyas muchas10–50Wm-2foranalbedoof0.2,andtheanomaliesofsolarfluxinclear–skyconditionscanbeasmuchas 600Wm-2(Liouetal.,2007).GiventhealtitudinaldependenceofDSSR,cautionisneededwhenapplyingcurrent satellitedatatoplateauregions.Groundmeasurementsover theTibetanPlateaucanbeusedasabenchmarkforevaluating satellitealgorithmsathighelevations(Yangetal.,2006).
Mostevaluationsofsatelliteproductshavebeenperformedinlowelevationareaswithsmoothsurfaces,andhigh accuracyhasbeenshown.AsforthequalityofsatelliteproductsovertheTibetanPlateau,mostpreviousstudieshavefocusedsolelyonrelativelyshortperiodsofseveralmonths, andhavenotevaluatedthelatestFLASHFlux(FastLongwaveAndShortwaveFluxesTimeInterpolatedandSpatially Averaged)/CERESproduct.Itisunknowntowhatextent surfacepropertiesinfluencesatellite-estimatedDSSR.The transferofshortwaveradiationundertheco-existenceof3D cloudsandcomplexsurfacepropertiesstillrequiresexploration.
Theremainderofthepaperisarrangedasfollows.Section2introducesthedatasetsandprocessingusedinthe study.Insection3,theDSSRfromthelatestFLASHFlux/ CERESdataoverawholeyearisassessedagainstthree groundsitesovertheTibetanPlateau,andtheimpactofsurfacepropertiesonthesatellite-estimatedDSSRisanalyzed. Then,theshortwaveradiationfluxtransferredthroughtwo typesofcloudsissimulatedusingastate-of-the-artmodel. Finally,theoverallconclusionsofthestudyandsomefurther discussionarepresentedinsection4.
2.Materialsandmethods
2.1.Insitudata
Insituobservationsfromthreesitesareadoptedinthis study(Fig.1):
(1)Yangbajain[(30.088◦N,90.540◦E);4350m]:This siteislocatedonthesouthernsideofNyainqentanglhaMountaininthecenteroftheTibetanPlateau.Itisannexedtothe InstituteofHighEnergyPhysicsoftheChineseAcademyof Sciences.
(2)TheNamCoMonitoringandResearchStationfor MultisphereInteractions[(30.774◦N,90.988◦E);4730m]. ThissiteislocatedonthesoutheastshoreofNamCoLake, 220kmawayfromLhasa.ItwasestablishedbytheInstitute ofTibetanPlateauResearch,ChineseAcademyofSciences in2005.
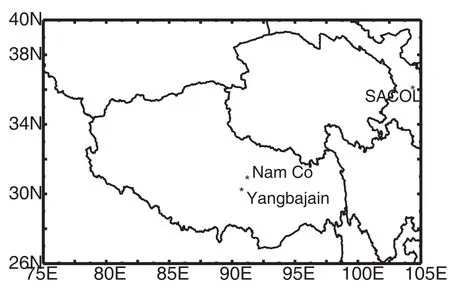
Fig.1.LocationsoftheYangbajain,NamCoandSACOLsites.
(3)TheSemi-AridClimateandEnvironmentObservatoryofLanzhouUniversity[knownasSACOL;(35.946◦N,104.137◦E);1965.8m].ThissiteisnearthecityofLanzhou, onthesouthernbankoftheYellowRiverinnorthwestern China.Inparticular,thissiteisveryclosetothegeometric centerofChina’smainland.
Thevaluesofsurfaceshortwaveirradianceweremeasuredbypyranometersateachsite[Yangbajain:TBQ-2-BI,HUATRON,Beijing,China(1-minresolution);NamCo: Model-CM,Kipp&Zonen,TheNetherlands(5-minresolution);SACOL:Model-CM,Kipp&Zonen,TheNetherlands (1-minresolution)].ThesensitivityoftheTBQ-2-B-Ipyranometeris10.22×10-6VW-1m2.TheTBQ-2-B-Ipyranometeriscomparabletootherpyranometers,andiswidely usedinmeteorologicalstations.Allthreesolarpyranometers wererigorouslytestedbeforeinstallation.Thetimesequence oftheinsitudataisfromApril2009toMarch2010atYangbajainandNamCo,andfromJanuary2009toAugust2010 atSACOL.Toacquirethebestpossibledataforsolarradiation,dailyqualityassurancechecksareessential.Thequality controlproceduresarederivedfromWMO(WorldMeteorologicalOrganization)andGeigeretal.(2002)withminor modifications.
2.2.Satellitedata
Byimprovingthesceneidentificationandincreasingthe sensitivityofangulardistributionmodels,CERESimproves theTOAfluxaccuracyforindividualcloudtypes,thereby providingamorereliabledatasetforstudyingradiativeprocessesandradiativeforcingbycloudtype(Loebetal.,2003). CEREShasfourlevelproducts.OurworkusedtheSSF(SingleScannerFootprint)productfromlevel2andFLASHFlux Version2Gfromlevel3.Theotherproductsafterlevel2are basedonthelevel2products.TheSSFproductcontainsone hourofinstantaneousCERESdataforasinglescannerinstrument.TheSSFcombinesinstantaneousCERESdatawith sceneinformationfromahigherresolutionimagersuchas VIRS(Visible/InfraredScanner)onTRMM(TropicalRainfallMeasuringMission)orMODIS(Moderate-Resolution ImagingSpectroradiometer)onTerraandAqua.EachSSF granulecontainsonehourofdata,whichisapproximately two-thirdsofanorbitfromasingleCERESinstrument.The widthoftheSSFswathislimitedtothewidthoftheimager swathwithwhichtheCERESdatawereconvolved.Each SSFfieldofview(FOV)representsonescannermeasurement.Measurementsaretakenevery0.01seconds.Accordingtodifferentalgorithms,theSSFcanbedividedintotwo products:the“A”modelproduct(Lietal.,1993)and“B”modelproduct(Guptaetal.,2001).
2.3.Methods
Thegriddedsatellitedatawerebilinearlyinterpolated ontothelocationsoftheinsitudata,sothesatelliteandin situdatacanbecompared.Itshouldbenotedthatdeviation existsinthegroundobservationsthemselves,andthevalidationtechniquesalsoproduceerrorsbecauseoftheinhomogeneousdistributionofmeteorologicalvariables.Thestatistical methodsusedinthisworkfollowpreviousstudies(Huang, 2004;Houborgetal.,2007;KimandLiang,2010;Yanget al.,2010).Thestatisticsarereportedinabsolute(Wm-2) andrelativeunits(percentageofaveragemeasuredglobalirradiance).Thestatisticsinabsoluteunitsaregivenby

andthestatisticsinrelativeunitsaregivenby

whereeandmrepresentsatellitepredictionsandgroundmeasurements,respectively;¯eand¯maretheaveragesofsatellite predictionsandgroundmeasurements,respectively;Nrepresentsthenumberofsamples;MErepresentsmeanerror; MAErepresentsmeanabsoluteerror;Rrepresentsthecorrelationcoefficient;andRMSDrepresentsroot-mean-square deviation.
InthisstudyweusedtheI3RCMonteCarlo3Dradiative transfercommunitymodel(I3RC-community-monte-carlo). Thismodelhasbeentestedandfoundtobesuperiorandmore efficientincomputingthedownwellingfluxthanSHDOM (SphericalHarmonicDiscreteOrdinateMethod)(Cahalanet al.,2005;PincusandEvans,2009).Theheartofthemodel isamonochromaticintegrator,andmoredetailscanbefound inPincusandEvans(2009).Nevertheless,therearetwomajorlimitationsofthismodel:First,thecurrentcodecannot solveatmosphericmolecularabsorptionproblems.Second, thecurrentcodecanonlydealwithLambertiansurfaces.In ourstudy,thesimulationused109photonstoguaranteeprecision,basedonthesuggestionofEvansandMarshak(2005).
Toensurebetteraccuracyforexaminingtheinterplayof thesurface,cloudsandsolarradiation,weperformedsimulationsatanonabsorbingwavelengthofcloudsinthevisiblespectrum(0.675µm)andanabsorbingwavelengthin thenear-infraredspectrum(2.13µm)underdifferentsurfacealbedoswithoutconsideringtheatmosphere.Unfortunately,thetopographiceffectwasnotimplementedbecause ofthelimitationofthecurrentMonteCarlocode.Thesetting ofsomebasicparametersfollowsthatofPincusandEvans (2009).Forallcalculations,thesunazimuthwassetto0◦(inthisstudy,0◦meansthatthesun’sraysaredirectedfrom thedirectionofincreasingx),andthesunzenithwassetto 30◦.Inthisstudy,astratocumulusfield(Moengetal.,1996)andacumulusfield(StevensandLenschow,2001)areused astheinputoftheMonteCarlomodel.Figure2showsthe twocloudfields.Moreinformationaboutthesetwoclouds canbefoundinWangetal.(2014).
3.Results
3.1.Comparisonsofsatelliteandinsitudata
First,weplottedthedaytimesolarradiationagainsttime. Dayswithaverysmoothcurvewereconsideredasclear-sky daysbecausecloudsleadtoclearfluctuationofsolarradiation.Figures3a,candeshowthescatterdiagramsforallallskydaysandFigs.3b,dandfforclear-skydays.Forallallskydays,therearelargedifferencesbetweenthetwoproducts.Amongthedifferentsites,thesatelliteerrorsaresmaller atSACOL,whichhasarelativelyflatsurfacecomparedtothe othertwositeswiththeirruggedterrain.ThecorrelationcoefficientsbetweenFLASHFluxandtheobservationare0.899, 0.884and0.966forYangbajain,NamCoandSACOL,respectively.Themeanabsoluteerrorsofsatellite-estimated dataare26.69Wm-2(10.96%),31.38Wm-2(12.26%)and 18.84Wm-2(15.93%),respectively.Theroot-mean-square errorsforthethreesitesrangefrom12.92%to16.86%.

Fig.2.(a,b)Liquidwatercontent(units:gm-3),(c,d)effectiveparticleradius(units:µm),and(e,f) opticaldepth(units:1)atwavelength0.67µmof(a,c,e)stratocumulusand(b,d,f)cumulus.Note: thephotographscorrespondingtothecloudopticaldepthatwavelength0.67µmwereadoptedfromI3RC: http://i3rc.gsfc.nasa.gov/casesnew.html.[ReprintfromWangetal.(2014)]

Fig.3.Scatter diagrams of the DSSR of FLASHFlux/CERES products versus in situ observations (units:W m-2):(a,b)Yangbajain;(c,d)Nam Co;(e,f)SACOL.R represents correlation;ME represents mean error;MAE represents mean absolute error;and RMSD represents root-mean-square deviation.
Underclear-skyconditions(Figs.3b,d,f),theDSSRresultsbasedontheFLASHFlux/CERESproductsandinsitu datashowamuchbetterrelationshipthanthatunderall-sky conditions.AtYangbajainandNamCo,theFLASHFlux value tends to be lower than ground measurements on every clear-sky day.The mean error is-16.57 W m-2(-6.66%) for Yangbajain,-17.09 W m-2(-6.34%)for Nam Co,and -4.39 W m-2(-0.95%)for SACOL.At the same time,the RMSD is very small,which suggests the difference between the two datasetsisvery stable.The satellite productsare more consistent w ith surface measurements under cloudless conditions than under all-sky conditions.The differences indicate that the satellite errors partly result from the algorithms, which ignore 3D cloud properties.The quality of the satellite inversion productsis spatially dependent,and tends to be better for the area w ith smooth terrain.
The mean error forallall-sky days is negative at Yangbajain and Nam Co,and positive at SACOL.The positive bias at SACOL site may be mainly attributable to the underestimation of the aerosol amount in the retrieval process,especially foraerosol in the sub-thin-cloud layer(Hayasaka etal., 2006).Very low aerosol optical values have been observed over the Tibetan Plateau because of the sparse population and m inimal industrialactivity(Cong etal.,2009).Therefore,at Yangbajain and Nam Co,the DSSR is much less affected by aerosols.The causes of the negative biases atYangbajain and Nam Co are not immediately obvious.The negative biases may be due to the neglect of 3D radiative effects under the conditionsof the heterogeneouscloudsand complex surface, satellite overestimation ofaerosolopticaldepth,orother reasons.
But how does the error between satellite and in situ measurements differ among the twelve months of the calendar year? Figure 4 shows the MAE and RMSD as a function of the calendar month.The MAE and RMSD vary w ith month.At Yangbajain,the MAE varies from 7.58%up to 26.56%w ith the highest value in June,and the RMSD varies from 9.49%up to 18.35%w ith the highest value in May.At Nam Co,the MAE ranges from 8.69% to 33.82%w ith the lowest value in January and the highest value in May,and the RMSD ranges from 10.07%to 22.99%w ith the lowest value in January and the highest value in May. At SACOL,the error changes smoothly throughout the year,except in a few months.There is apeakoftheMAE(26.05%)inSeptember.TheRMSDremainsatabout11%,withahighestvalueof24.18%in Septemberandsecondhighestvalueof18.39%inNovember.

Fig.4.TheerrorofFLASHFlux/CERESDSSRforallall-sky daysineverymonth:(a)meanabsoluteerror;(b)root-meansquaredeviation.
Theerrorvariesatdifferentsiteswithdifferentsurface properties.TheerroratSACOLisrelativelystableoverthe wholeyear,whichisprobablyrelatedtotherelativelystable cloudactivity.AtYangbajainandNamCo,theerrorinMay andJuneislargerthanthatofothermonths.Thepeakerror inMayandJuneisassociatedwiththelargecloudamount duringthattime(HuoandL¨U,2012).ThelargeRMSDindicatesthatthespatialandtemporalvariabilityofcloudscontributestoconsiderableuncertaintyinMayandJune.The differencesbetweentheFLASHFluxandsurfacemeasurementsaredifferentamongdifferentsites.Thesedifferences areunstableandlargeoverruggedterraincomparedwithrelativelyflatterrain,especiallywhencloudactivityishighly frequent.Theaboveresultsindicatelargeuncertaintyinthe couplingbetween3Dheterogeneouscloudsandcomplexsurfacepropertiesonradiativetransferprocesses.Thecomplex surfacepropertiescaninducecomplexweathertypesandsky conditions,whicheventuallyformsacomplexphysicalrole toaffecttheradiationtransferprocess.
3.2.Thespatialvariationofsatellite-derivedinstantaneousDSSR
ThissubsectiondescribedtheworkusingtheSSF/ CERESinstantaneousorbitproducts.Thecoefficientofvariability(CV),whichismainlyusedtocomparethedispersion ofthedifferentgroups,istheratioofthestandarddeviation tothecorrespondingaverageofasetofdata.Inorderto evaluatetheeffectofsurfacepropertiesonthedistribution ofDSSR,threeregionswerechosentoobtaindomainaverages.Thesethreeregionswerelocatedatthesamelatitudes(26◦–40◦N)butatdifferentlongitudes:easternChina–westernPacific(ECWP,105◦–135◦E),subtropicalNorthPacific(NP,150◦–180◦E),andtheTibetanPlateau(TP,75◦–105◦E).Basedondigitalelevationdataattheresolutionof 500mfromSRTM(ShuttleRadarTopographyMission), NASA,Fig.5showstheelevationoftheTPandECWPregion.Thewhiteregionontherightrepresentstheocean.The NPregionischaracterizedbyseasurfaceandisnotshown inFig.5.Clear-skyconditionsweredefinedasoccurring whentheclearareapercentagecoverageatthesubpixelresolutionwasgreaterthan99.9%.Duringtheperiod1April 2009to31March2010,themonorailtrackswithinanhour thatcontainedclear-skysamplingpoints(M)ofmorethan 500werechosenasourexperimentaldatabase;thenumber ofsuchtrackswas145intheTPregion,190intheECWP region,and54intheNPregion.
Figure6showsthevariationofthespatialCVofDSSRin the1htrack,plottedbytheordinalnumberofeligibletracks (N)fromJanuarytoDecemberonthehorizontalaxisandthe CVontheverticalaxis.Thenumberabovethehorizontalaxis representsthemonthcorrespondingtoN,andsomemonths arenotmarkedinthefigurebecauseoftheinexistenceof eligibleorbitsortoofeweligibletracks.Theseunmarked monthsincludeJune,JulyandAugustfortheTPregion(Fig. 6a),andJanuaryfortheNPregion(Fig.6c).Themonths betweenAprilandSeptemberarereferredtoasthesummer halfyear,andothersarereferredtoasthewinterhalfyear. Ifthemonorailtrackswithinanhourthatcontainedclear-sky samplingpointsofmorethan800werechosen,thenumber ofsuchtrackswas56intheTPregion,128intheECWP region,and15intheNPregion.ThedistributionsofthespatialCVforthesamplingpointsofmorethan800werethe sameasthoseforthesamplingpointsofmorethan500,so thefiguresforthesamplingpointsofmorethan800arenot shown.
TheCERESproductsdonotfullyaccountfortheimpactofthevariedsurfaceproperties,especiallytheimpact ofcomplextopography.TheerrorsincomputingtheradiativetransfercaninfluencetheDSSRresults.Therearetwo waysinwhichthesurfaceinfluencestheCV:oneisthenature oftheradiativetransferrelatedtothesurface,andtheotheris thelimitationofthesatelliteinversionalgorithminresolving thesophisticatedsurfaceproperties.Itishardtocompletely separatethesetwoeffectsundercurrentconditions.However,thereareonlyslightdifferencesbetweenthe“A”model productsandthe“B”modelproductsintheirspatialCVsof DSSRunderclear-skyconditions(Fig.6),whichsuggests thattheDSSRerrorinducedbythelimitationsofthesatellite inversionalgorithmhaslittleimpactontheCV.Therefore, thenatureoftheradiativetransferisthedominantfactorin theoccurrenceofthedifferentCVinthedifferentregions. TheinfluenceofsurfacecharacteristicsontheDSSRdisplays annualvariation,andthisannualvariationpresentsthesame patternastheshapeoftheopeningupoftheparabolicinthe threedifferentareas.TheannualvariabilitiesoftheCVin theTPandECWPregionsmaybemainlyattributabletothe shadingeffect.Theshadingeffectisrelativelysmallwhenthe solaraltitudeangleishigh,whichwouldleadtothelowerCV inthesummerhalfyear.IntheNPregion,thewavechanges mayleadtotheannualvariabilityoftheCV.Thewavesare closelyrelatedtothewindspeeds.Inwinter,theNPregion takesthebruntoftheprevailingwesterlies,whichresultsinthe high w ind speeds.In summer,the w ind speeds are relatively small in the NP region because of the influence of the subtropicalhigh pressure.The CV ranges from about1%to 17%in the TP.The overall ranges of CV in the ECWP and NP regions are very sim ilar,and the CV varies from 1%up to 13%.The ranges of CV are similar in the NP and ECWP regionsprobably because the entire NP region and abouthalf of the ECWP region are covered by ocean.The land surface of the ECWP region is much less variable than that of the TP region,while the underlying surface of the NP region is mainly affected by waves.The sim ilar ranges of the CV in the ECWP and NP regions may indicate that the influence of huge waves on the CV can be as large as thatof the land surface.
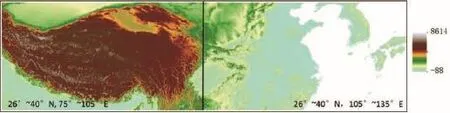
Fig.5.Elevation(at the resolution of 500 m from SRTM,NASA)of the TP and ECWP regions (units:m).The white region on the right represents the ocean.

Fig.6.Coefficient of spatial variation for SSF/CERES DSSR:(a)Tibetan Plateau(TP);(b) eastern China–western Pacific(ECWP);(c)subtropical North Pacific Ocean(NP).The number of clear pixels is larger than 500 in one hour on the satellite scanning track;“A”and“B”respectively represent the satellite data from the“A”model and“B”model.The horizontal axis shows the ordinal number of eligible tracks N from January to December.The number above the horizontalaxis represents the month corresponding to N.
In the three regions w ithin the same latitudes,solar radiation in the TP is the most strongly affected by the underlying surface conditions.Table 1 illustrates the spatial CV of DSSR in the three areas.In the situation of M being greater than 500,the average CV is 9.44%for the TP region,4.95%for the ECWP region,and 3.49%for the NP region.In the situation of M being greater than 800,the average CV is 10.5%for the TP region,5.11%for the ECWP region,and 3.55%for the NP region,respectively.The sunlight or solar fluxes that reach the surface can be physically grouped into the follow ing five components:direct flux,diffuse flux,direct-reflected flux,diffuse-reflected flux,and coupled flux.The direct-reflected flux,which consistsofphotons directly from the sun w ithoutencountering scattering,and aresubsequently reflected by surrounding terrain,is the dom inantcomponentcontributing to the differentDSSR between the flatsurface and the surface w ith complex topography(Lee et al.,2013).As can be seen from the above,the impact of underlying surface conditions is the lowest in the NP region and the greatest in the TP region,which is about tw ice as large as that in the other two regions.

Table 1.Statistics for the DSSR under clear-sky conditions.

Fig.7.The variation of SSF/CERES DSSR in one hour on the satellite scanning track(units:W m-2):(a,b) Tibetan Plateau(TP);(c,d)Eastern China–western Pacific(ECWP);(e,f)subtropical North Pacific Ocean(NP). Both the height in the verticaldirection and the coloring stands for the value of DSSR.The dark spots at the bottom of each panel represent the locations under clear skies.Taking(a)as an example,the label“2010030908”means between 0800 and 0859 on 9 March 2010 UTC.
Figure 7 demonstrates the variation of DSSR in one hour for several satellite scanning tracks when M is greater than 800.The days chosen in Figs.6a–f are very close,and the DSSR for a large region as a whole has no obvious change in one or two days,so the variationsare comparable.Figures 7a and e show the variation in the TP and NP regions on the same day(9 March 2010 UTC),respectively.The clear-sky sampling pointsin the monorailtrack w ithin an hourare 1256 for Fig.7a,and 814 for Fig.7e.The CV of DSSR is 5.98% for the TP region and 3.17%for the NP region.A lthough the distribution of clear-sky sampling points can affect the CV, the surface properties still contribute the most to the DSSR and its CV.Figures 7b and f are for two tracks w ith similar clear-sky sampling points(1036 and 1091,respectively)on nearby days.The spatial CV of DSSR is 6.95%in the TP region and 4.10%in the NP region.Figures 7c and d show the spatial variation of DSSR w ithin one hour for two tracks in the ECWP region.M is 2722 for Fig.7c and 851 for Fig.7d. The CV is 2.55%and 4.95%,respectively.The above case analyses show that the underlying surface properties affect the distribution of DSSR the mostin the TP region.
3.3.Simulation by the I3RC model
Shortwave flux transmittance(T)is the ratio of the surface horizontal solar radiation to extraterrestrial radiation (Liou,2002).Under the concurrence of variable surface albedo and 3D clouds,what is the effect of surface albedo on the shortwave flux transm ittance?As an example,Fig.8 shows the distributions of the shortwave flux transmittance of stratocumulusclouds.Figures8a–d are for the wavelength of 0.675µm,and Figs.8e–h are for the wavelength of 2.13 µm.Foreach simulation ata certain wavelength,the surface albedo was 0.0 for Figs.8a and e,0.2 for Figs.8b and f,0.4 for Figs.8c and g,and 0.6 for Figs.8d and h.For the regions w ith white color,the transm ittance is greater than 1.0, which means that the enhancementof the radiation caused by cloud cover is more evident than the reducing effect.We know thatsuch a phenomenon is mainly induced by scattered radiation resulting from the underlying surface and inhomogeneous structure of clouds in principle.From the figures,we conclude that the distributions of shortwave radiation transmittance in the three domains are similar,which is mainly caused by the structure of clouds.The average T at0.675µm is 0.686,0.745,0.815 and 0.900 for a surface albedo of 0.0, 0.2,0.4 and 0.6,and at2.13µm it is 0.512,0.548,0.589 and 0.638,respectively.It is clear that the shortwave flux transmittance increases as the surface albedo increases.
Another example is for the impactof cumulus cloud on the distribution of the shortwave flux transm ittance(Fig.9). Figures 9a–d are at 0.675µm,and Figs.9e–h are at 2.13 µm.The average T at0.675µm is 0.900,0.929,0.959,and 0.992 for a surface albedo of 0.0,0.2,0.4 and 0.6,respec-

Fig.8.Simulated shortwave flux transm ittance of stratocumulus cloud atwavelengths(a–d)0.675 µm and(e–h)2.13µm.The surface albedos are 0.0 in(a,e),0.2 in(b,f),0.4 in(c,g)and 0.6 in(d, h).
tively,and at 2.13µm it is 0.860,0.880,0.901 and 0.923, respectively.For cumuluscloud,the effectsofsurface albedo on downward shortwave radiation flux are weaker than for stratocumuluscloud.Thisisbecause the stratocumuluscloud field has a much more complex structure than thatof cumulus cloud.Surface properties have a strongereffecton solar radiation under the sky ofmore complex 3D clouds.The largest effectoccurs in regions w ith cloud gaps.This is mainly attributed to the increase of the diffuse radiation,while the direct solar radiation component is almost unaffected.If the spatial changes of cloud properties(e.g.cloud optical thickness,liquid water content,effective particle radius,cloud coverage and geometry)are more complex,the role of surface albedo on DSSR is stronger.At the same time,we can see that DSSR w ill increase as surface albedo increases.As the surface albedo increases,more photons w ill be reflected to the sky instead of reaching the ground,and participate in the processesofmultiple scattering.A proportion of those re-flected photons w ill transfer to the ground through a complex physicalprocess.

Fig.9.Simulated shortwave flux transm ittance of cumulus cloud atwavelengths(a–d)0.675 µm and(e–h)2.13µm.The surface albedos are 0.0 in(a,e),0.2 in(b,f),0.4 in(c,g)and 0.6 in(d,h).
Previous studies on surface albedo have paid much more attention to its effecton the upward surface shortwave radiation than itseffecton the DSSR(e.g.,Lietal.,1993;Gupta et al.,2001;Ma and Pinker,2012;Qin etal.,2012).Our study shows thatsurface albedo has an important role in the value of DSSR itself.Given the importance of the upward surface shortwave radiation based on surface albedo and DSSR,it is necessary to consider the effect of surface albedo on the surface radiation budget.Surface albedo is a dynam ic parameter.It can change notonly w ith the variation of surfaceconditions,suchasthephysicalandchemicalpropertiesof soil,butalsowiththesun’sangle.Surfacealbedoitselfis complexanduncertain.Atpresent,theproblemoftheerror duetosurfacealbedointhesatelliteinversionandradiative transferalgorithmisachallengeinthefieldofatmospheric science.Furtherstudyisstillneeded.
4.Conclusionanddiscussion
4.1.Conclusion
Asabasicproblemintheearth–atmospheresystem,detailedstudiesoftheradiativetransferprocesscontributeto furtherresearchonclimatechangeandthephysicsofremote sensing.IntheTPregion,itsprotrudingnaturewithhigh elevationandcomplexsurfacepropertiesresultsinequally complexweatherandcloudsystems.Asaresult,presentradiativetransfermodelsandsatelliteinversionalgorithmscannotmeetthenecessaryrequirements.Satelliteremotesensing hasbecomemoreandmorewidelyusedinthegeosciences. However,satellitedatashouldbeevaluatedagainstinsituobservationsbeforebeingused.TheTPischaracterizedbyhigh elevationandcomplexsurfaceproperties,andthusactsasa usefulbenchmarkforevaluatingsatellitedata.InsituobservationsatYangbajain,NamCo,andSACOLwereadoptedin thisstudytoevaluateFLASHFluxsatellitedata.Theeffects ofsurfacepropertiesontheDSSRwereanalyzedbycomparingtheTP,ECWPandNPregions.TheI3RCmodelwas usedtostudytheeffectsofsurfacealbedoontheDSSR.The mainresultscanbesummarizedasfollows:
(1)Underclear-skyconditions,thesatelliteproductsand insitudataareconsistentwithacorrelationof0.992atYangbajain,0.991atNamCosite,and0.998atSACOL.Themean absoluteerrorofsatellite-estimatedproductsisabout6.7%at Yangbajain,6.3%atNamCo,and3.4%atSACOL.Under all-skyconditions,theerrorincreasessignificantlybecause thepresentalgorithmsignore3Dcloudproperties.Thequalityofthesatelliteinversionproductsisspatiallydependent, andittendstobebetterforsmootherterrain.Theerrorincreasesandbecomesmorevariablewiththeincreasingcomplexityofsurfaceproperties.
(2)TheCVwasusedtoevaluatetheeffectofsurface propertiesonthedistributionofDSSR.Theworkwasperformedbychoosingthreeregionslocatedatthesamelatitudes(26◦–40◦N),includingtheTPregion(75◦–105◦E), theECWPregion(105◦–135◦E),andtheNPregion(150◦–180◦E).TheCVhasanannualcycle,whichishigherinthe winterhalfyearandlowerinthesummerhalfyear.ThemaximumCVreachesabout17%intheTPregion,andabout 13%intheothertworegions.Whentheclear-skysampling pointsofthemonorailtrackwithinanhouraregreaterthan 500,theaverageCVis9.44%fortheTPregion,4.95%for theECWPregion,and3.49%fortheNPregion.Whenthe clear-skysamplingpointsaregreaterthan800,theaveraged CVis10.5%,5.11%and3.55%,respectively.Theimpactof underlyingsurfacefeaturesintheTPregionisabouttwiceas largeasintheECWPorNPregions.
(3)TheI3RCnumericalsimulationsshowedthatsurface albedoaffectsDSSRdramatically.DSSRincreasesassurfacealbedoincreases,andtheimpactofsurfacealbedoon DSSRislargerifthespatialdistributionofcloudsismore non-uniform.Surfacealbedoisjustoneoftheparametersof surfaceproperties.Itisnecessarytoconsidertheeffectof surfacealbedoonthesurfaceradiationbudget.
4.2.Discussion
Currentsatelliteproductsfacegreatchallengesoverthe TPbecauseofthecomplexsurfaceandskyconditions.SurfacepropertiesdramaticallyaffectthedistributionofDSSR overtheTP,whichinturnwillmodulatetheenergycycleand furtherleadtoaseriesofclimaticandmeteorologicalconsequences.Thepresentstudyqualitativelyandquantitatively indicatedthattheeffectofsurfacefeaturesisanabsoluterestrictionfortheprecisionofcurrentradiativetransfermodelsandsatelliteinversionalgorithms.Inareaswithacomplexsurface,thevariabilityofthatunderlyingsurfaceand itsradiativepropertiescombinetogeneratecomplicatedspatialandtemporalpatternsofsurfaceradiationbudgets.Underclear-skyconditions,shortwavesurfaceeffectscanleadto surfacetemperaturedifferencesofupto2.5K,andlongwave effectstodifferencesofupto1K(Mannersetal.,2012).The TPhasverydifferentcharacteristicsofDSSRcomparedto otherregions.Moreattentionshouldbepaidtotheeffectof theunderlyingsurfaceonthesurfaceradiationbalance.
Intermsoftheeffectofsurfaceproperties,mostpreviousstudieshavesimplyperformedtheirworkunderclearskyconditions(e.g.Liouetal.,2007;Mannersetal.,2012; Leeetal.,2013).However,theEarth’saveragecloudfraction isabouttwothirds(Madduxetal.,2010),andthecomplexityofsurfacepropertiescaninduceequallycomplexweather typesandskyconditions.Complexsurfacesand3Dclouds coexistmostofthetime.Inoursimulation,onlythesurfacealbedoeffectwasinvestigatedundertheskywith3D cloudsbecauseofthelimitationofthecurrentI3RCMonte Carlocode.Oursimulationshowedthattheimpactofsurface albedoonDSSRislargerifthespatialdistributionofclouds ismorenon-uniform.Theproblemwillbemorecomplex ifthetopographiceffectisaddedintotheradiativetransfer model.Inthefuture,weintendtoperformstudiesofthetopographiceffectbyimprovingtheI3RCMonteCarlomodel, orbyusingothereffectivemodels.Thepresentworkcanbe usedasafoundationuponwhichwecanbuildandthinkabout howtoextractthesurfaceshortwaveradiationvaluesbyusing moreaccuratemethodsandsatellitedata.Itisimperativeto establishinhomogeneoussurface–atmospherecouplinginto radiativetransfermodels.
Acknowledgements.ThisresearchwassupportedbytheNationalNaturalScienceFoundationofChina(GrantNo.41127901) andtheStrategicPriorityResearchProgram–ClimateChange:CarbonBudgetandRelevantIssues(GrantNo.XDA05040300).The authorswouldliketothankProfs.HUANGJian-Ping,ZHANGWu, MAYao-Ming,XUANYue-Jian,andCHENHong-Binfortheir provisionofinsitudata.TheauthorswouldalsoliketothankProf.TamasVARNAIandProf.RobertPINCUSfortheirmanysuggestionsanddiscussionsontheMonteCarlomodel.
REFERENCES
Cahalan,R.F.,andCoauthors,2005:TheI3RC:Bringingtogether themostadvancedradiativetransfertoolsforcloudyatmospheres.Bull.Amer.Meteor.Soc.,86(9),1275–1293.
Cong,Z.Y.,S.C.Kang,A.Smirnov,andB.Holben,2009: AerosolopticalpropertiesatNamCo,aremotesiteincentralTibetanPlateau.Atmos.Res.,92(1),42–48.
Dubayah,R.C.,andS.Loechel,1997:Modelingtopographicsolar radiationusingGOESdata.J.Appl.Meteor.,36(2),141–154.
Dubayah,R.C.,andP.M.Rich,1995:TopographicsolarradiationmodelsforGIS.Int.J.GeographicalInform.Syst.,9(4), 405–419.
Evans,K.F.,andA.Marshak,2005:Numericalmethods.3DRadiativeTransferinCloudyAtmospheres.A.MarshakandA. B.Davis,Eds.,Springer,Berlin,261–274.
Geiger,M.,L.Diabate,L.Menard,andL.Wald,2002:Aweb serviceforcontrollingthequalityofmeasurementsofglobal solarirradiation.SolarEnergy,73(6),475–480.
Gui,S.,S.L.Liang,andL.Li,2009:ValidationofsurfaceradiationdataprovidedbytheCERESovertheTibetanPlateau. 200917thInternationalConferenceonGeoinformatics,Fairfax,VA,1–6.
Gui,S.,S.L.Liang,K.C.Wang,andL.Li,2010:Assessmentof threesatellite-estimatedlandsurfacedownwellingshortwave irradiancedataSets.IEEEGeosci.RemoteSens.Lett.,7(4), 776–780.
Gupta,S.K.,D.P.Kratz,Jr.P.W.Stackhouse,andA.C. Wilber,2001:TheLangleyparameterizedshortwavealgorithm(LPSA)forsurfaceradiationbudgetstudies(version1.0).NASA/TP-2001-211272.
Hayasaka,T.,K.Kawamoto,G.Shi,andA.Ohmura,2006:Importanceofaerosolsinsatellite-derivedestimatesofsurface shortwaveirradianceoverChina.Geophys.Res.Lett.,33, L06802,doi:10.1029/2005GL025093.
Helbig,N.,H.L¨owe,andM.Lehning,2009:Radiosityapproach forthesurfaceradiationbalanceincomplexterrain.J.Atmos. Sci.,66,2900–2912.
Houborg,R.,H.Soegaard,W.Emmerich,andS.Moran,2007: Inferencesofall-skysolarirradianceusingTerraandAqua MODISsatellitedata.Int.J.RemoteSens.,28(20),4509–4535.
Huang,J.Y.,2004:MeteorologicalStatisticalAnalysisandForecastMethod.ChinaMeteorologicalPress,Beijing,298pp.(in Chinese)
Huo,J.,andD.R.L¨U,2012:CloudamountanalysisatYangbajingofTibetin2009–2010usingall-skyimages.Climaticand EnvironmentalResearch,17(4),393–399.(inChinese)
Kang,S.,S.Kim,andD.Lee,2002:Spatialandtemporalpatterns ofsolarradiationbasedontopographyandairtemperature. CanadianJournalofForestResearch,32(3),487–497.
Kim,H.Y.,andS.L.Liang,2010:Developmentofahybrid methodforestimatinglandsurfaceshortwavenetradiation fromMODISdata.RemoteSens.Environ.,114,2393–2402.
Kurosaki,Y.,andF.Kimura,2002:RelationshipbetweentopographyanddaytimecloudactivityaroundTibetanPlateau.J. Meteor.Soc.Japan,80(6),1139–1355.
Kuwagata,T.,A.Numaguti,andN.Endo,2001:Diurnalvariation ofwatervaporoverthecentralTibetanPlateauduringsummer.J.Meteor.Soc.Japan,79,401–418.
Lee,W.L.,K.N.Liou,andC.C.Wang,2013:Impactof3-DtopographyonsurfaceradiationbudgetovertheTibetan Plateau.Theor.Appl.Climatol.,113,95–103.
Li,Z.,H.G.Leighton,K.Masuda,andT.Takashima,1993:EstimationofSWfluxabsorbedatthesurfacefromTOAreflected flux.J.Climate,6(2),317–330.
Liou,K.N.,2002:AnIntroductiontoAtmosphericRadiation.2nd ed.,AcademicPress,Boston,583pp.
Liou,K.N.,W.Lee,andA.Hall,2007:Radiativetransferin mountains:ApplicationtotheTibetanPlateau.Geophys.Res. Lett.,34,L23809,doi:10.1029/2007GL031762.
Loeb,N.G.,N.M.Smith,S.Kato,W.F.Miller,S.K.Gupta, P.Minnis,andB.A.Wielicki,2003:Angulardistribution modelsfortop-of-atmosphereradiativefluxestimationfrom thecloudsandtheEarth’sradiantenergysysteminstrument ontheTropicalRainfallMeasuringMissionsatellite.PartI: Methodology.J.Appl.Meteor.,42,240–265.
Ma,Y.,andR.T.Pinker,2012:Modelingshortwaveradiative fluxesfromsatellites.J.Geophys.Res.,117,D23202,doi: 10.1029/2012JD018332.
Ma,Y.,andCoauthors,2005:Diurnalandinter-monthlyvariation oflandsurfaceheatfluxesoverthecentralTibetanPlateau area.Theor.Appl.Climatol.,80,259–273.
Maddux,B.,S.A.Ackeman,andS.Platnick,2010:ViewinggeometrydependenciesinMODIScloudproducts.J.Atmos. OceanicTechnol.,27(9),1519–1528.
Manners,J.,S.B.Vosper,N.Roberts,2012:Radiativetransferoverresolvedtopographicfeaturesforhigh-resolution weatherprediction.Quart.J.Roy.Meteor.Soc.,138,720–733.
Moeng,C.H.,andCoauthors,1996:Simulationofastratocumulustoppedplanetaryboundarylayer:Intercomparisonamong differentnumericalcodes.Bull.Amer.Meteor.Soc.,77(2), 261–278.
Ohring,G.,B.Wielicki,R.Spencer,B.Emery,andR.Datla,2005: Satelliteinstrumentcalibrationformeasuringglobalclimate change.Bull.Amer.Meteor.Soc.,86,1303–1314.
Pincus,R.,andK.F.Evans,2009:Computationalcostandaccuracyincalculatingthree-dimensionalradiativetransfer:ResultsfornewimplementationsofMonteCarloandSHDOM. J.Atmos.Sci.,66,3131–3146.
Qin,J.,K.Yang,S.Liang,andW.Tang,2012:Estimationofdaily meanphotosyntheticallyactiveradiationunderAll-Skyconditionsbasedonrelativesunshinedata.J.Appl.Meteor.Climatol.,51,150–160.
Ryu,Y.,S.Kang,S.K.Moon,andJ.Kim,2008:Evaluationof landsurfaceradiationbalancederivedfrommoderateresolutionimagingspectroradiometer(MODIS)overcomplexterrainandheterogeneouslandscapeonclearskydays.Agric. Forest.Meteorol.,148(10),1538–1552.
Spencer,J.W.,1971:Fourierseriesrepresentationoftheposition ofthesun.Search,2,172.
Stevens,B.,andD.H.Lenschow,2001:Observations,experiments,andlargeeddysimulation.Bull.Amer.Meteor.Soc., 82(2),283–294.
St¨ockli,R.,2013:TheHelioMontSurfaceSolarRadiationProcessing.ScientificReportMeteoSwiss,No.93,122pp.
Stroeve,J.,J.E.Box,F.Gao,S.Liang,A.Nolin,andC.Schaaf, 2005:AccuracyassessmentoftheMODIS16-dayalbedo productforsnow:ComparisonswithGreenlandinsuitmea-surements.RemoteSens.Environ.,94(1),46–60.
Wang,K.C.,X.J.Zhou,J.M.Liu,andM.Sparrow,2005:Estimatingsurfacesolarradiationovercomplexterrainusing moderate-resolutionsatellitesensordata.Int.J.RemoteSens., 26(1),47–58.
Wang,L.D.,D.R.L¨u,andW.X.Zhang,2013:StudyoncharacteristicofsolarradiationatNamCoandYangbajainin Qinghai-XizangPlateau.PlateauMeteorology,32(2),315–326.(inChinese)
Wang,L.D.,D.R.L¨u,andJ.Huo,2014:ObservationandsimulationofabnormaltransmittanceoverYangbajing,Tibet.AtmosphericandOceanicSciencesLetters,7,190–197,doi: 10.3878/j.issn.1674-2834.13.0086.
Wang,S.,R.F.Grant,D.L.Verseghy,andT.A.Blac,2002:Modellingcarbondynamicsofborealforestecosystemsusingthe Canadianlandsurfacescheme.ClimaticChange,55(4),451–477.
Yang,K.,T.Koike,P.Stackhouse,C.Mikovitz,andS.J.Cox, 2006:AnassessmentofsatelliteSurfaceradiationProducts forhighlandswithTibetinstrumentaldata.Geophys.Res. Lett.,33,L22403,doi:10.1029/2006GL027640.
Yang,K.,R.T.Pinker,Y.M.Ma,T.Koike,M.M.Wonsick, S.J.Cox,Y.C.Zhang,andP.Stackhouse,2008:Evaluationofsatelliteestimatesofdownwardshortwaveradiation overtheTibetanPlateau.J.Geophys.Res.,113,D17204,doi: 10.1029/2007JD009736.
Yang,K.,J.He,W.J.Tang,J.Qin,andC.C.K.Cheng,2010: Ondownwardshortwaveandlongwaveradiationsoverhigh altituderegions:ObservationandmodelingintheTibetan Plateau.Agric.Forest.Meteor.,150(1),38–46.
Zhang,Y.C.,W.B.Rossow,andJr.P.W.Stackhouse,2006: Comparisonofdifferentglobalinformationsourcesusedin surfaceradiativefluxcalculation:Radiativepropertiesofthe near-surfaceatmosphere.J.Geophys.Res.,111,D13106,doi: 10.1029/2005JD006873.
Zhang,Y.C.,W.B.Rossow,andJr.P.W.Stackhouse,2007:Comparisonofdifferentglobalinformationsourcesusedinsurface radiativefluxcalculation:Radiativepropertiesofthesurface. J.Geophys.Res.,112,D01102,doi:10.1029/2005JD007008.
:Wang,L.D.,D.R.L¨u,and Q.He,2015:The impactofsurface properties on downward surface shortwave radiation over the Tibetan Plateau.Adv.Atmos.Sci.,32(6),759–771,
10.1007/s00376-014-4131-2.
(Received 20 June 2014;revised 11 October 2014;accepted 22 October 2014)
∗Corresponding author:L¨U Daren
Email:ludr@mail.iap.ac.cn
©Institute of Atm ospheric Physics/Chinese Academ y of Sciences,and Science Press and Springer-Verlag Berlin Heidelberg 2015
杂志排行
Advances in Atmospheric Sciences的其它文章
- Characterization of Organic Aerosols in Beijing Using an Aerodyne High-Resolution Aerosol M ass Spectrometer
- Dryland Expansion in Northern China from 1948 to 2008
- Numerical Simulations of Heavy Rainfallover Central Korea on 21 Sep tember 2010 Using the WRF M odel
- Precipitation Changes in Wetand Dry Seasons over the 20th Century Simulated by Two Versions of the FGOALS M odel
- Projections of the Advance in the Startof the Grow ing Season during the 21st Century Based on CM IP5 Simulations
- Deep Convective Clouds over the Northern Pacific and Their Relationship w ith Oceanic Cyclones