Deep Convective Clouds over the Northern Pacific and Their Relationship w ith Oceanic Cyclones
2015-04-20YIMingjianFUYunfeiLIUPengandZHENGZhixia
YIM ingjian,FU Yunfei,LIU Peng,and ZHENG Zhixia
1University of Science and Technology of China,Hefei230026
2Anhui Provincial Academy of Environmental Sciences,Hefei230022
3State Key Laboratory of Severe Weather,Chinese Academy of Meteorological Sciences,Beijing100081
Deep Convective Clouds over the Northern Pacific and Their Relationship w ith Oceanic Cyclones
YIM ingjian1,2,FU Yunfei∗1,3,LIU Peng1,2,and ZHENG Zhixia1
1University of Science and Technology of China,Hefei230026
2Anhui Provincial Academy of Environmental Sciences,Hefei230022
3State Key Laboratory of Severe Weather,Chinese Academy of Meteorological Sciences,Beijing100081
Based on combined CloudSat/CALIPSO detections,the seasonal occurrence of deep convective clouds(DCCs)over the m idlatitude North Pacific(NP)and cyclonic activity in w inter were compared.In w inter,DCCs are more frequent over the central NP,from approximately 30◦N to 45◦N,than over other regions.The high frequencies are roughly equal to those occurring in this region in summer.Most of these DCCs have cloud tops above a 12 km altitude,and the highest top is approximately 15 km.These w intertime marine DCCs commonly occur during surface circulation conditions of low pressure,high temperature,strong meridionalw ind,and high relative hum idity.Further,the maximum probability of DCCs, according to the high correlation coefficient,was found in the region 10◦–20◦east and 5◦–10◦south of the center of the cyclones.The potential relationship between DCCs and cyclones regarding their relative locations and circulation conditions was also identified by a case study.Deep clouds were generated in the warm conveyor beltby strong updrafts from baroclinic flow s.The updrafts intensified when latentheatwas released during the adjustmentof the cyclone circulation current.This indicates that the dynam ics of cyclones are the primary energy source for DCCs over the NP in w inter.
CloudSat,deep convective clouds,marine cyclones,northern Pacific
1.Introduction
Deep convective clouds(DCCs)are common in low latitudes during summer(Mapes and Houze,1993;Liu et al., 1995;Hall and Vonder Haar,1999;Gettelman etal.,2002). With the developmentof satellite technology,particularly for the remote sensing of clouds and precipitation,greatprogress has been made in the study of DCCs(Alcala and Dessler, 2002;Luo etal.,2008;Luo etal.,2011).DCCs can extend from near the surface to a high level above the tropopause. Because of their large depths and high tops,DCCs play an important role in the Earth’s climate system via their influence on precipitation and radiation(Stephens,2005;Stephens etal.,2008;Feng etal.,2011;Lietal.,2013).
Approximately 1.3%of tropicalconvective systems reach 14 km,and 0.1%of these systems penetrate the tropical tropopause.Overshooting convection is more frequent over land than over the ocean,especially over Central A frica,Indonesia and South America(Liu and Zipser,2005).Because the activities of deep convection are generally attributed to the large-scale seasonal m igration of the intertropical convergence zone(ITCZ)and the Indian and East Asian, South American and A frican monsoons,the distribution of deep convection is usually consistentw ith these general circulation systems(Liu etal.,2007,2012).Mostextreme deep convection events occur in the western Pacific(December–March)and in the Indian monsoon regions(July–September) (Jiang et al.,2004).The peak depth and strength of deep convection is associated w ith the strong interactionsof tropical clouds,precipitation and radiation in summer(Lin etal., 2006;Liet al.,2013).The characteristic features of tropical deep convection have been studied in recentyears due to the rapid developmentof remote sensing technology(Liu et al.,1995;Dessler,2002;Yuan and Li,2010).These deep convection events and their associated precipitation play an importantrole in regionalweathervariationsand in the crosstropopause transportof chem ical tracer gases(Poulida etal., 1996;Sherwood and Dessler,2000).
However,whether the deep convection events in the extratropics are sim ilar to those that occur in tropical regions has yet to be determined.Generally,the convective activities that occur in the extratropics are weaker than those that occur in the tropics,especially in w inter(Liu et al.,2012). However,there are exceptions in some areas.The most notable exception is in the North Pacific(NP),where stormtrackshaveadistinctpathduringborealwinter(Changand Fu,2002;Changetal.,2002).Everyyear,dozensofstrong cyclonesaregeneratedinthewestportionoftheoceanand migrateeastwardfromNovembertothenextApril(Gulev etal.,2001;Rodionovetal.,2007).Thesecyclonesusually forminlowlatitudesandthendeveloprapidly.Theircentral pressureatsealevelfallsatarateof24hPad-1(Sanders andGyakum,1980).Becauseofthevigorousdevelopment ofthesesynoptic-scalesystems,strongjetstreamsandverticalmotionarealsocommon(Hollandetal.,1987).When thereissufficientaccumulationofmoisturetoachievesaturation,deepcloudsaregeneratedintheupliftedflows(Govekaretal.,2011).Theopticalthicknessoftheseconvective deepcloudsisusuallylarge,whichisexpectedtoaffectthe radiationfluxsignificantly.Moreover,anextendedvertical transferthatissustainedindeepconvectioncanalsoplaya roleinthecross-tropopauseexchangeofatmosphericconstituents(Fischeretal.,2003).Ourunderstandingofdeep convectionandembeddeddeepcloudsoverthewintertime oceanhasremainedincompleteduetothesparsecoverage ofground-basedandship-basedobservations.Thisdilemma hasrecentlybeenaddressedassatelliteremotesensingnow routinelycollectsdataonglobalclouds;thus,DCCsover theoceancanbecharacterized(Luoetal.,2008).Weused CloudSat/CALIPSOdatainthisstudytofocusonDCCsover theNPandtoinvestigatetheirrelationshipwithcyclonicactivity.Thisstudyaimstorevealthecharacteristicsofdeep convectionintheextratropicsduringthecoldseason;thus, itmayadvanceunderstandingoftheeffectsonconvectionof synoptic-scaleoceaniccyclones.
2.Data
CloudstructuredatafromCloudSat/CALIPSOwereused inthisstudytoillustratetheverticaldevelopmentofconvectionsystems.TheCloudSatsatelliteorbitstheEarthapproximately14.5timesperdayata750kmorbit.Thecloud profilingradar(CPR)onCloudSatoperatesatafrequency of94GHz,pointsnominallytowardsthenadirandemits apulseof3.3microseconds.Thebackscatteredsignalsare over-sampledandaveragedtoproduceanominalfootprint of1.4kmacross-trackand2.5kmalong-trackandaverticalsamplingof~250m(Maceetal.,2007).TheCloud-Satdatawerealsocombinedwithmeasurementsfromthe CALIPSOCloud-AerosolLidarwithOrthogonalPolarization(CALIOP;hereafterreferredtoastheLidar)toproduceanauthoritativemaskofhydrometeorcoverage.The CPRandtheLidararedesignedtoflyinclosesynchronization.Theobvioussynergyofthesecombinedobservationalcapabilitiesissignificant.Consideringtheabilityof theCPRtoprobeopticallythicklarge-particlelayersand theabilityoftheLidartosenseopticallythinlayersand tenuouscloudtops,thetwoinstrumentshavethepotential toprovideacompletedepictionofcloudgeneration(Mace etal.,2009;NaudandChen,2010).The2B-CLDCLASSLIDARdatausedinthisstudyidentifycloudtypesbyprimarilycombininginformationavailablefromtheCloudSat andCALIPSOsatellites.Itclassifiescloudsbyusingverticalandhorizontalcloudproperties,thepresenceorabsence ofprecipitationfromCloudSatandCALIPSO,cloudtemperaturefromECMWF(EuropeanCentreforMedium-Range WeatherForecasts),andupwardradiancefromMODIS (Moderate-ResolutionImagingSpectroradiometer)measurements(Wangetal.,2013).TheCPR(CloudSat)andLidar (CALIPSO)provideverticalcloudprofilesandhorizontalextentsofclouds,whichprovideimportantinformationondifferentiatecloudtypes.
TheERA-Interimarchivefrom2007to2010,whichwas producedbyECMWF,wasalsousedinthisstudy,including variablessuchaspotentialvorticity(PV),pressure,temperature,windspeed,andrelativehumidity.ThePVwasusedto definetropopauseheight,andtheothervariableswereusedto revealtheatmosphericconditionsbothinthestatisticalanalysisandinacasestudy.ERA-Interimisareanalysisofthe globalatmospherethatcoversthedata-richperiodsince1979 (originally,ERA-Interimstartedin1989,buta10-yearextensionto1979–88wasproducedin2011)andcontinuesinreal time(Deeetal.,2011).ThedatasetfromERA-Interimis widelyusedinclimateandweatheranalyses.Itincludesnot onlytheprincipleatmosphericfields,suchassealevelpressure,temperature,windandrelativehumility,butalsoindirectvariables,suchasPVandconvectiveavailablepotential energy(CAPE).Thedatausedherehaveaspatialresolution of1.5◦×1.5◦and60verticallevels,withatoplevelof0.1 hPa.
3.Statisticalanalysismethod
Thedeepconvectioninthetropicalandsubtropicalregionsduringsummerusuallyextendsfromthelowlevelsto abovethetropopause.Ithasbeendeterminedthat~1.3% ofconvectionoccursovera14kmdepth,and~0.1%occurs overa17kmdepth(LiuandZipser,2005).Oneofthehighest cloudtopsobserved,whichoccurredovernorthernAustralia, formedataheightofmorethan19km(AlcalaandDessler, 2002).Tocategorizedeepconvection,AlcalaandDessler (2002)referredtotopsexceeding10kmas“deepconvection”andtopsexceeding14kmas“overshootingconvection”.This indexisnotappropriateforthedeepconvectionthatoccurs overtheNPinwinterbecausethetroposphereisthinnerthan itisinthetropics.IntermsofPV,whichisaquantitythat isconservedunderadiabaticandfrictionlessconditions,the tropopauseisfrequentlydefinedby2PVU(potentialvorticityunites)(Hoskinsetal.,1985;Gougetetal.,2000),where 1PVU=10-6Km2kg-1s-1.This“dynamicaltropopause definition”ideallyrepresentstheconceptofthetropopauseas aquasi-impermeablediscontinuoussurface.Obviously,the tropopauseheightisexactlytheheightofthe2PVUisosurfacewhenthetropopauseisnotfolded.Tropopausefoldscan bedefinedasregionswhereverticalsoundingsrevealmultiplecrossingsofthetropopause.Whenthetropopausefolds, the2PVUisosurfaceisverticallyintersectedatleasttwice, i.e.,multipletropopausesexist(Sprengeretal.,2003).Figures1aandbshowthetropopausefoldfrequencydistribu-tionsovertheNPforwinter(December–January–February; DJF)andsummer(June–July–August;JJA).Thefoldfrequencyatacertainlocationrepresentsthepercentageofinstances(dailyECMWFfieldshavebeenanalyzed)inwhicha foldisidentifiedatthislocationduringtheparticularseason. Duringbothseasons,tropopausefoldsaremostfrequentin thesubtropicsbetween20◦Nand40◦N,wherethemaximum occurrencesareapproximately0.12duringDJFandapproximately0.04duringJJA.Wedefinedthetropopauseheightof thefoldastheaverageheightofitsupperandlowerboundarytoreducetheinfluenceofthedoubletropopausewhen identifyingDCCs.
Figures1canddshowtheaveragetropopauseheight anditsstandarddeviationforDJFandJJA.Thehighest tropopauseoccursovertheWestPacificduringDJF.The tropopausedescendssharplywithincreasinglatitude.North of40◦N,theheightdropstolessthan10km.Thetropopause ishigherduringJJAthanDJF,exceptovertheWestPacific, andhasasmallerstandarddeviation.Theaveragetropopause heightinthemidlatitudesisapproximately11km.Because ofthelargevariationinthetropopausebetweenwinterand summer,itisnotappropriatetouseaconstantheighttodefineDCCs,suchasthatusedbyAlcalaandDessler(2002) forthetropics.
4.Statisticalanalysisresults
4.1.DistributionofDCCs
Inthisstudy,wecollectedthealtitudedataofcloudlayer topsandbasesinsummerandwinterfrom2007to2010.We defined“deepclouds”asthecloudlayersthathaveabase below3kmandatopabovethein-situtropopause(wedefinedthetropopauseheightofthefoldastheaverageheight ofitsupperandlowerboundary).TheDCCdataweregriddedinto1.5◦×1.5◦forDJFandJJA,asshowninFig.2.Note thattheaveragenumberofobservationsbytheCPR/Lidarin eachgridwasgreaterthan5000,whichislargeenoughto avoidthespuriousbiasintroducedbythisapproach.Figure 2showsamuchgreaterdifferenceintheDCCoccurrences betweenwinterandsummer.DuringJJA,highfrequencies ofDCCsoccuroveralargeregionfromsoutheasternAsia totheEastPacific.Particularly,theDCCsoccurmostfrequentlyineasternAsiaandthewesternPacific,whichare regionsdominatedbyAsiansummermonsoons(Wanget al.,2001).Thesedistributionsaregenerallyconsistentwith previousstudiesbasedontheTRMMPR(TropicalRainfall MeasuringMissionPrecipitationRadar)(AlcalaandDessler, 2002;Liuetal.,2012).Thedefinitionofdeepconvection workswellinthemidlatitudes,whereCloudSat/CALIPSO fillstheTRMMPRdetectiongapnorthof38◦N(Kummerow etal.,1998).DuringDJF,theoccurrenceofDCCsoverland greatlydecreases,especiallyinEastAsiaandtheWestPacific.However,theDJFoccurrenceremainsapproximately equaltotheJJAoccurrenceovertheoceannorthof30◦N. ThecomparisonbetweenDJFandJJAsuggeststheimportanceofDCCsovertheNPinwinterbecausetheDCCactivitiesdonotweakenfromsummertowinter,asseeninEast AsiaandtheWestPacific.Notethatthehighoccurrenceregionroughlycoincideswithasectionoftheprevailingstorm tracksinborealwinter(Zhangetal.,2004).Ingeneral,most cyclonesarenotstrongintheirearlystageswhentheyareoverthewesternportionoftheNP;theygenerallyexhibita maturestageandpeakdeptharoundthedatelineaftercontinuouslydeepeningduringtheireastwardmigration(Gyakum etal.,1989).Thejetstreamflowaroundcyclonesandtheir associatedupdraftsalsopeakwhenthecyclonesaredeepest (Ding,2005;Yietal.,2012).Thesecirculationconditions provideafavorabledynamicforcefordeepconvection,resultinginlargeroccurrencesofDCCsincentralandeastern portionsoftheNP.BecauseoftheparticularfeaturesofDCCs inDJFandtheirpotentialrelationshiptomarinecyclones,we subsequentlyonlyfocusontheDCCsinDJF.

Fig.1.(a,b)Seasonaloccurrencesofadoubletropopause,and(c,d)averagetropopauseheightandstandard deviation(units:km):(a,c)winter(December–February);(b,d)summer(June–August).
4.2.VerticalextensionofDCCs
ToidentifytheverticalextensionoftheseDCCs,cloud topheight(CTH)informationforDJFwereselectedandaveragedoverthedesignatedarea.Figure3ashowsthevariationofCTHsoverarangeoflongitudes.Mostcloudtops occurataheightof9–14km.Thehighestcloudtops,which occurwestofthedateline,areashighas15km.Figure3b showstheCTHvariationwithlatitude.Fromlowlatitudesto highlatitudes,thehighestcloudtopsdescendgradually,but theoccurrenceshavedifferentvariations.ThetopsofDCCs occurmostfrequentlyataheightofapproximately12km northof30◦N.
TheoccurrencesofDCCsfromCloudSat/CALIPSOappeartobehighestintheITCZ;thisfindingvalidatesthemajor hypothesisofpreviousstudies,whichemphasizesthatintense convectiveactivitiesoccurinthisarea(notshown).However,itisimportanttonotethatDCCsdistinctlydecreasebetween15◦NandtheTropicofCancer,wherethelarge-scale descentoftheHadleycirculationdominates.Inthemidlatitudes,from30◦Nto45◦N,thecloudtopsareslightlylower thanthoseinlowlatitudes,buttheoccurrenceismuchhigher andnearlyequaltothatinsummer.TheDCCsinwinteroccurmuchmorefrequentlyovertheoceanandoverthebelt wheretheconcentratedDCCsinwinterareveryclosetothe agglomerationofcyclones(Changetal.,2002;Wangetal., 2007;Zhangetal.,2012).Ingeneral,theDCCsinthewintertimemidlatitudeoceanappeardifferentfromthosethatoccur inthesummerITCZ.Ithasbeenestablishedthatthethermodynamicforceisveryweakduringwinter,butitisverystrong inthesummerconvectiveregionswheredeepconvectiveactivitiesoccur.Thus,wehypothesizethatthisdeep,marine convectioninwinterisassociatedwithanessentialmechanismthatdiffersfromconvectionthatisthermallydriven.
4.3.Relationshipwithcyclones

Fig.2.Occurrenceofdeepconvectivecloudsin(a)winter(December–February)and(b)summer(June–August).

Fig.3.Occurrenceofcloudtopheightsinwinter(December–February):(a)latitudinaloccurrenceaveraged from30◦Nto60◦N;(b)longitudinaloccurrenceaveragedfrom120◦Eto120◦W.

Fig.4.Probability density of the anomalies during DCCs for(a)surface pressure(units:hPa),(b)2-m temperature(units:K),(c)10-m velocity of zonal w ind(units:m s-1),(d)10-m velocity of meridional w ind(units: m s-1),(e)2-m relative hum idity(units:%),and(f)convective available potential energy(CAPE)(units: J kg-1).
ToclarifythepotentialrelationshipofDCCswithatmosphericcirculationconditionsandcyclonesthatfrequently occurovertheNPinwinter,wecalculatedtheprobabilitydistributionoftheanomaliesforseveralfundamentalquantities oftheatmosphericcirculationandtheoriginalCAPEwhen DCCsoccur.Thesurfacepressure,temperatureandrelative humidityat2m,thezonalandmeridionalwindvelocityat 10m,andtheCAPEdatawereobtainedfromtheECMWF 6-hourlydataset.AsshowninFig.4,thereisobviouslylower surfacepressure,higher2mtemperatures,stronger10m meridionalwinds,andahigher2mrelativehumiditywhen DCCs occur.At times,the zonal w ind greatly decelerates, but thissituation is notdominant;the w ind speed deviation is ambiguous.Approximately 45%of the sampleshave a CAPE value near 0,and the probability density decreases sharply w ith the increase in CAPE.These features indicate the circulation conditions near DCCs.The surface below DCCs is characterized by warm and moistair,low pressure and meridionalacceleration.CAPE is often used as an indicative index for estimating the potential convection development(Ye et al.,2006),buta large CAPE value does notnecessarily mean deep convection w ill occur.A large number of DCCs occur w ith small CAPE values in the NP in w inter.Although partially contributed by the coarse resolution of the ERA-interim,the small value posed problems for an explanation in terms of pure thermal initiation,which plays an important role in tropicalconvection;however,the large numberof DCCs appears to have a close connection to the atmospheric circulation.This finding motivated us to determine the relationship between DCCs and cyclones,which represent the mostprom inenttype ofweathersystem over the NP in w inter.
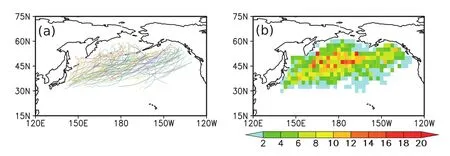
To clarify the potential linkage between DCCs and cyclones,we identified and traced all cyclones thatoccurred in the NP from 2007 to 2010.All of these cyclones exhibited centralpressures less than 975 hPa for at least24 hours.Figure 5 shows the statistical results of these cyclones.Mostof them originated in the western partof the NP at low latitudes, then m igrated toward the northeast and dissipated near the high latitudes or the western coastof the American continent (Fig.6a).The highest occurrence was around the dateline, near 45◦N(Fig.6b),and appeared close to the region w ith intense DCCs.To quantify the linkage in the relative locationsbetween cyclonesand DCCs,we calculated the correlation coefficients between the frequenciesof the cyclones and the DCCs.The coefficients were based on the frequency of the central low pressure in a fixed region and the frequency of the DCCs w ithin a moving w indow using the same region size(Fig.6a).The offset longitude and offset latitude between the designated fixed and moving regionswere called∆LON and∆LAT,respectively,and were assigned as the coordinate indices of the calculated correlation index.The calcu-lation was performed for a∆LON range from-10 to 30 and a∆LAT range from-5 to 15 to produce a correlation index distribution(Fig.6b).The regions w ith larger correlation index values have a higher probability of DCC formation.As shown in Fig.6b,the maximum index occurs 10◦–20◦east of the cyclone centerand 5◦–10◦south of the cyclone center. Figure 6b depicts the pattern in the geographic relationship between the cyclones and DCCs;the southeastern portion of a cyclone is the mostconvective and tends to have higheroccurrences of deep clouds.Thus,the strongest convection is not located near the center of the cyclone system but is most likely to occur in the warm conveyorbeltalong the outeredge ofa cold front,which is in agreementw ith the classic cyclone model.

Fig.5.(a)Tracks and(b)occurrences of cyclones in w inter.

Fig.6.Schematic diagram of the(a)calculation methods and(b)distribution of the correlation coefficients.
5.Case study
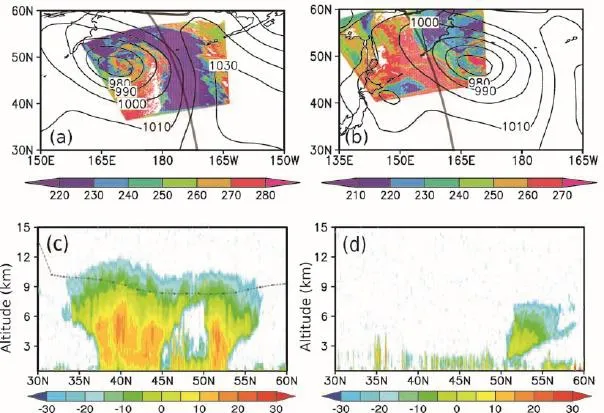
The analysisof the DCCsand the circulation environment indicates the typical characteristic features and inherentprocesses of their relationship.However,a typical case study is necessary to obtain more detailed cyclone characteristics. Among the thousands of cloud profi les in the study area,we chose the strong cyclonesw ith deep cloudsthatwere detected in the Northwest Pacific on 8 February 2009.On that day, CloudSat passed over the Northwest Pacific tw ice at 0058 UTC and 0237 UTC,as shown in Fig.7.The fi rst satellite track passed over the eastern partof the cyclone.The radar reflectivity of the CPR along this track clearly indicated a deep cloud located between 40◦N and 45◦N.The cloud extended from a low level to above 10 km in the verticaldirection,and most of its top was above the tropopause.The region w ith the DCCs had cold cloud top temperatures(based on MODIS),and was located in a largercold beltin the spiral arm of the cyclone.Approximately 2 hours later,CloudSat passed over the western part of the cyclone again,when it was at the tail of the cold belt of the spiral arm.A long the second track,there were no deep clouds as detected in the fi rst track,except for a mid-level cloud in the northwestern partof the cyclone.This case study offered a directunderstanding of the deep clouds in the NP in w inter.The location of DCCs along the southeastern leading edge of the cyclone provides convincing evidence for the conclusions of the statistical results in the previous section.
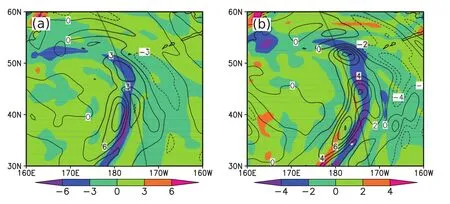
This typical case provides detailed characteristics of the DCCs and the associated cyclone.Therefore,our study focused on the analysis of the surrounding atmospheric circulation environment.As shown in Fig.8,the low-level(850 hPa)converging flow and the high-level(200 hPa)diverging flow in the southeastern part of the cyclone migrated from west to east.At 0000 UTC,the high-level diverging flow lagged behind the low-levelconverging flow.Then,itmoved northeastand strengthened.At0600 UTC,the diverging flow region extended from 30◦N to north of50◦N,almostcovering the entire low-level converging flow region.It is reasonable to deduce that the lower convergence and the upper divergence were concurrentduring the m igration process,and the time and location of the concurrence was consistentw ith the DCCs.The strong verticalmotion generated during the con-currence reveals that the large-scale baroclinicity played an important role in the developmentof the convection.

Fig.7.Two satellite passes of the cyclone:(a,b)surface pressure(contours,units:gpm)and cloud top temperature(shading,units:K);(c,d)vertical cross sections of radar reflectivity factors along the tracks(units: dB Z).The solid gray line in(a,b)represents the orbitof CloudSat;the gray dashed line in(c)represents the tropopause.

Fig.8.Divergence(units:10-5s-1)on the isobaric surface(shading,850 hPa;contours,200 hPa:(a)0000 UTC 8 February 2009;(b)0600 UTC 8 February 2009.The solid gray line in(a,b)represents the orbit of CloudSataccording to Figs.7a and b.
Some studies have emphasized the importance of the moisture content of the low-level troposphere in the development of deep convection(Derbyshire et al.,2004;Kuang and Bretherton,2006).Derbyshire etal.(2004),for instance, documented the sensitivity of convective development in a w ide range of environmental relative humidity levels.Their results showed that a wet environment is favorable for deep convection because the entrainmentof wetterenvironmental air leads to weaker evaporative cooling and positive buoyancy.As shown in Fig.9,the distributionsof relative humidity,temperature and w ind vectors were consistent w ith the divergence in Fig.8.The leading edge of the cyclone,especially the southwestern part,most notably had the strongest poleward flow,w ith a maximum velocity exceeding 50 m s-1.This warm air advection transported abundantmoisture into the cyclonic system.At the same time,the negative temperature gradientduring the conveyance caused the relative hum idity to approach saturation rapidly.Note that the wettest air was found in the warm and moist transfer belt,where updraftsprevail.Abundantwatervapor,warm airadvection and updrafts create the most favorable environmental conditions forenhancing the depth of convection.

Fig.9.Relative hum idity(shading,units:%),temperature(contours,units:K)and stream vectors(arrows, units:m s-1)on the isobaric surface of 850 hPa:(a)0000 UTC 8 February 2009;(b)0600 UTC 8 February 2009.

Fig.10.(a)Regionalaveraged(40◦–45◦N,180◦–175◦W)relative hum idity(shading,units:%),temperature(contours, units:K)and verticalvelocity vectors(units:Pa s-1)in the time–pressure cross section.(b)The contours of the vertical velocity(units:Pa s-1)in the same cross section.
The temperature,velocity and hum idity were averaged over the most convective region(40◦–45◦N,180◦–175◦W) to revealprecisely how the characteristic featuresvaried w ith time(Fig.10).Initially,a temperature anomaly occurred. Because the air temperature above 300 hPa dropped sharply to less than 220 K on 7 February,weak sinking motion began in the high-levelair.However,the air temperature below 300 hPa was warming at this time.This temperature structure increased the atmospheric instability.Aftera slow and gradual increase over dozens of hours,the warming of the low-level airbecame significantin the daytime hoursof7 February,and the lifting started at the m id-level.As the lifting strengthened,an updraftdeveloped from the sea surface to above 200 hPa.This indicates that there was an explosive development of deep convection.The updraft in this convection system peaked at1 Pa s-1at nightfall on 7 February.The relative humidity increased prior to the strongest lift;however,this increase was not very significant and appeared only in the m id-level for a brief time.When the strongest vertical motion was triggered,the hum idity peaked and moistened the air over a w ide vertical range.The time series of the basic meteorological variables describes the regional variation of the convection.The deep convection strengthened follow ing enhanced instability and increased moisture.The time–pressure cross section shows that the strong updraftmotion started at 0000 UTC 7 February and peaked 24 hours later(Fig.10b). The updraftextended from the surface to above 200 hPa.The geographicaland temporal correlations between the updraftandDCCsalsoindicatethecloserelationshipofthesefactors.
6.Conclusion
Characteristicfeaturesofdeepcloudsthatextendfrom theatmosphericboundarylayertothetropopauseweredescribedusingaclimatologicalanalysisandatypicalcase studybasedoncloudinformationfromthecombinedobservationsoftheCloudSatCPRandtheCALIPSOLidar.The resultsdemonstratedthatparticularDCCfeaturesoccurover theNPinwinter.UnliketheoccurrenceofsummerDCCs, whicharemorefrequentinEastAsiaandtheWestPacific, winterDCCsoccurmainlyovertheNP.From30◦Nto45◦N, winterDCCsaremostfrequent,approximatelyequaltothe numberinsummer.Mostofthecloudshaveatopabove12 kminaltitude.Thehighestcloudtops,whichoccurtothe westofthedateline,areashighas15km.
Thestatisticsofthecirculationconditionsshowedthat thereisobviouslylowsurfacepressure,high2-mtemperatures,strong10-mmeridionalwinds,andhigh2-mrelative humiditywhenDCCsoccur;however,thezonalwindand CAPEdeviationsareambiguous.Further,thecorrelationbetweenthelocationsoftheDCCsandthecyclonecenteris strongbetween10◦and20◦east,and5◦and10◦south,ofthe centerofthecyclone.Thus,theoutersoutheasternareaofthe cycloneismostbeneficialfortheoccurrenceofDCCs.
ThecasestudyrevealeddetailedcharacteristicsofacycloneinwhichDCCswereembedded.Inthespiralarmof thecyclone,abeltwithverycoldcloudtopsexisted.Adeep convectivecloudwasdetectedbytheCPRwhenitcrossed thisbelt.Thedeepconvectivecloudlocated17◦eastand 6◦southofthecenterofthecyclone,wherethewarmconveyorbeltwaslocated.Warmandmoistlow-levelairwas liftedwhenthehigh-leveldivergingflowmigratedalongwith thelow-levelconvergingflow.Latentheatreleasedfrom thecondensationofcloudparticlesstrengthenedtheupdraft. Thisrapidstrengtheningofthecycloneresultedindeepconvectivemotionthatstretchedfromthelowlevelstoabove thetropopause.Asindicatedbysatelliteobservations,thick cloudsweregenerated.
ThisstudycharacterizesDCCsthatoccuroutsideofthe tropicsinwinter.Fromabasicdynamicperspective,boththe climatologicalstatisticsandthecasestudyconfirmthatthe developmentofDCCsoverthemidlatitudeoceaninwinteris closelyrelatedtosynoptic-scalecyclones.Thedeepconvectionalongtheprevailingwinterstormtracksisimportantdue toitspotentialeffectsintheatmosphere.
Acknowledgements. Theauthorsthankthereviewersfortheir commentsandrecommendations,theNASACloudSatprojectfor providingtheCloudSat/CALIPSOdataset,andtheECMWFInterim Reanalysisprojectforprovidingtheglobalatmosphericdata.This workwasfundedbytheNationalNaturalScienceFoundationof China(GrantNos.41105031,41230419,91337213and41205126), theChinaSpecialFundforMeteorologicalResearchinthePublic Interest(GrantNos.GYHY201306017andGYHY201306077),the StrategicPriorityResearchProgram(GrantNo.XDA05100303), theMajorStateBasicResearchDevelopmentProgram(GrantNo. 2010CB428601),andEnvironmentalPublicWelfareScientificResearch(GrantNo.201209006).
REFERENCES
Alcala,C.M.,andA.E.Dessler,2002:Observationsofdeep convectioninthetropicsusingtheTropicalRainfallMeasuringMission(TRMM)precipitationradar.J.Geophys. Res.,107(D24),AAC17-1–AAC17-7,doi:10.1029/2002JD 002457.
Chang,E.K.M.,andY.F.Fu,2002:Interdecadalvariationsin NorthernHemispherewinterstormtrackintensity.J.Climate, 15,642–658.
Chang,E.K.M.,S.Y.Lee,andK.L.Swanson,2002:Stormtrack dynamics.J.Climate,15,2163–2183.
Dee,D.P.,andCoauthors,2011:TheERA-Interimreanalysis: Configurationandperformanceofthedataassimilationsystem.Quart.J.Roy.Meteor.Soc.,137,553–597.
Derbyshire,S.H.,I.Beau,P.Bechtold,J.Y.Grandpeix,J.M. Piriou,J.L.Redelsperger,andP.M.M.Soares,2004:Sensitivityofmoistconvectiontoenvironmentalhumidity.Quart. J.Roy.Meteor.Soc.,130,3055–3079.
Dessler,A.E.,2002:Theeffectofdeep,tropicalconvectiononthe tropicaltropopauselayer.J.Geophys.Res.,107(D3),ACH 6-1–ACH6-5,doi:10.1029/2001JD000511.
Ding,Y.,2005:AdvancedSynopticMeteorology.2nded.,China MeteorologicalPress,585pp.(inChinese)
Feng,Z.,X.Q.Dong,B.K.Xi,C.Schumacher,P.Minnis,andM. Khaiyer,2011:Top-of-atmosphereradiationbudgetofconvectivecore/stratiformrainandanvilcloudsfromdeepconvectivesystems.J.Geophys.Res.,116(D23),D23202,doi: 10.1029/2011JD016451.
Fischer,H.,andCoauthors,2003:Deepconvectiveinjectionof boundarylayerairintothelowermoststratosphereatmidlatitudes.Atmos.Chem.Phys.,3,739–745.
Gettelman,A.,M.L.Salby,andF.Sassi,2002:Distributionand influenceofconvectioninthetropicaltropopauseregion.J. Geophys.Res.,107(D10),ACL6-1–ACL6-12,doi:10.1029/ 2001JD001048.
Gouget,H.,G.Vaughan,A.Marenco,andH.G.J.Smit,2000: Decayofacut-offlowandcontributiontostratospheretroposphereexchange.Quart.J.Roy.Meteor.Soc.,126, 1117–1141.
Govekar,P.D.,C.Jakob,M.J.Reeder,andJ.Haynes,2011: Thethree-dimensionaldistributionofcloudsaroundSouthernHemisphereextratropicalcyclones.Geophys.Res.Lett., 38(21),L21805,doi:10.1029/2011GL049091.
Gulev,S.K.,O.Zolina,andS.Grigoriev,2001:ExtratropicalcyclonevariabilityintheNorthernHemispherewinterfromthe NCEP/NCARreanalysisdata.ClimateDyn.,17,795–809.
Gyakum,J.R.,J.R.Anderson,R.H.Grumm,andE.L.Gruner, 1989:NorthPacificCold-Seasonsurfacecycloneactivity: 1975–1983.Mon.Wea.Rev.,117,1141–1155.
Hall,T.J.,andT.H.VonderHaar,1999:Thediurnalcycleof westPacificdeepconvectionanditsrelationtothespatialand temporalvariationoftropicalMCSs.J.Atmos.Sci.,56,3401–3415.
Holland,G.J.,A.H.Lynch,andL.M.Leslie,1987:AustralianEast-Coastcyclones.1.SynopticoverviewandCase-study. Mon.Wea.Rev.,115,3024–3036.
Hoskins,B.J.,M.E.McIntyre,andA.W.Robertson,1985:On theuseandsignificanceofisentropicpotentialvorticitymaps. Quart.J.Roy.Meteor.Soc.,111,877–946.
Jiang,J.H.,B.Wang,K.Goya,K.Hocke,S.D.Eckermann,J. Ma,D.L.Wu,andW.J.Read,2004:Geographicaldistributionandinterseasonalvariabilityoftropicaldeepconvection: UARSMLSobservationsandanalyses.J.Geophys.Res.,109, D03111,doi:10.1029/2003JD003756
Kuang,Z.M.,andC.S.Bretherton,2006:Amass-fluxscheme viewofahigh-resolutionsimulationofatransitionfromshallowtodeepcumulusconvection.J.Atmos.Sci.,63,1895–1909.
Kummerow,C.,W.Barnes,T.Kozu,J.Shiue,andJ.Simpson, 1998:TheTropicalRainfallMeasuringMission(TRMM) sensorpackage.J.Atmos.OceanicTechnol.,15,809–817.
Li,W.,C.Schumacher,andS.A.McFarlane,2013:RadiativeheatingoftheISCCPupperlevelcloudregimesanditsimpact onthelarge-scaletropicalcirculation.J.Geophys.Res.,118, 592–604.
Lin,B.,B.A.Wielicki,P.Minnis,L.Chambers,K.M.Xu,Y.X. Hu,andA.Fan,2006:Theeffectofenvironmentalconditionsontropicaldeepconvectivesystemsobservedfromthe TRMMsatellite.J.Climate,19,5745–5761.
Liu,C.T.,andE.J.Zipser,2005:Globaldistributionofconvectionpenetratingthetropicaltropopause.J.Geophys.Res., 110(D23),D23104,doi:10.1029/2005JD006063.
Liu,C.T.,E.J.Zipser,andS.W.Nesbitt,2007:Globaldistributionoftropicaldeepconvection:Differentperspectivesfrom TRMMinfraredandradardata.J.Climate,20,489–503.
Liu,G.S.,J.A.Curry,andR.S.Sheu,1995:Classificationof cloudsoverthewesternequatorialPacific-Oceanusingcombinedinfraredandmicrowavesatellitedata.J.Geophys.Res., 100(D7),13811–13826,doi:10.1029/95JD00823.
Liu,P.,Y.Wang,S.Feng,C.Y.Li,andY.F.Fu,2012:Climatologicalcharacteristicsofovershootingconvectiveprecipitationin summerandwinteroverthetropicalandsubtropicalregions. ChineseJournalofAtmosphericSciences,36,579–589.(in Chinese)
Luo,Y.L.,R.H.Zhang,W.M.Qian,Z.Z.Luo,andX.Hu,2011: IntercomparisonofdeepconvectionovertheTibetanPlateau-AsianmonsoonregionandsubtropicalNorthAmericainborealsummerusingCloudSat/CALIPSOdata.J.Climate,24, 2164–2177.
Luo,Z.Z.,G.Y.Liu,andG.L.Stephens,2008:CloudSatadding newinsightintotropicalpenetratingconvection.Geophys. Res.Lett.,35(19),L19819,doi:10.1029/2008GL035330.
Mace,G.G.,R.Marchand,Q.Q.Zhang,andG.Stephens,2007: GlobalhydrometeoroccurrenceasobservedbyCloudSat: Initialobservationsfromsummer2006.Geophys.Res.Lett., 34(9),L09808,doi:10.1029/2006GL029017.
Mace,G.G.,Q.Q.Zhang,M.Vaughan,R.Marchand,G. Stephens,C.Trepte,andD.Winker,2009:Adescription ofhydrometeorlayeroccurrencestatisticsderivedfromthe firstyearofmergedCloudsatandCALIPSOdata.J.Geophys. Res.,114(D8),D00A26,doi:10.1029/2007JD009755.
Mapes,B.E.,andR.A.Houze,1993:Cloudclustersandsuperclustersovertheoceanicwarmpool.Mon.Wea.Rev.,121, 1398–1415.
Naud,C.M.,andY.H.Chen,2010: AssessmentofISCCPcloudinessovertheTibetanPlateauusingCloudSat-CALIPSO.J.Geophys.Res.,115(D10),D10203,doi: 10.1029/2009JD013053.
Poulida,O.,R.R.Dickerson,andA.Heymsfield,1996:Stratospheretroposphereexchangeinamidlatitudemesoscaleconvective complex:1.Observations.J.Geophys.Res.,101(D3),6823–6836.
Rodionov,S.N.,N.A.Bond,andJ.E.Overland,2007:TheAleutianLow,stormtracks,andwinterclimatevariabilityinthe BeringSea.DeepSeaResearchPartII,54,2560–2577.
Sanders,F.,andJ.R.Gyakum,1980:Synoptic-dynamicclimatologyofthebomb.Mon.Wea.Rev.,108,1589–1606.
Sherwood,S.C.,andA.E.Dessler,2000:Onthecontrolofstratospherichumidity.Geophys.Res.Lett.,27,2513–2516.
Sprenger,M.,M.Maspoli,andH.Wernli,2003:Tropopause foldsandcross-tropopauseexchange:AglobalinvestigationbaseduponECMWFanalysesforthetimeperiodMarch 2000toFebruary2001.J.Geophys.Res.,108,doi:10.1029/ 2002JD002587.
Stephens,G.L.,2005:Cloudfeedbacksintheclimatesystem:A criticalreview.J.Climate,18,237–273.
Stephens,G.L.,andCoauthors,2008:CloudSatmission:Performanceandearlyscienceafterthefirstyearofoperation.J. Geophys.Res.,113,doi:10.1029/2008JD009982.
Wang,B.,R.G.Wu,andK.M.Lau,2001:Interannualvariability oftheAsiansummermonsoon:ContrastsbetweentheIndian andthewesternNorthPacific-eastAsianmonsoons.J.Climate,14,4073–4090.
Wang,X.M.,X.K.Zou,andP.M.Zhai,2007:Researcheson extratropicalcyclonevariabilityinthenorthernhemisphere. AdvancesinClimateChangeResearch,3(3),154–157.(in Chinese)
Wang,Z.,D.Vane,G.Stephens,andD.Reinke,2013:Level2 combinedradarandlidarcloudscenarioclassificationproductprocessdescriptionandinterfacecontroldocument.Jet PropulsionLaboratoryCaliforniaInstituteofTechnology,38 pp.
Ye,A.F.,Z.F.Wu,W.J.Xiao,S.Hu,andY.C.Liu,2006:A studyofapplicationofCAPEinsevereconvectiveweather prediction.JournalofTropicalMeteorology,22(5),484–490. (inChinese)
Yi,M.J.,Y.F.Fu,P.Liu,Z.W.Heng,Y.Gao,andX.Y.Hong, 2012:Analysisofthevariationofatmosphericcomposition intheuppertroposphereduringastrongconvectionineastern Chinainsummer.ChineseJournalofAtmosphericSciences, 36(5),901–911.(inChinese)
Yuan,T.L.,andZ.Q.Li,2010:Generalmacro-andmicrophysical propertiesofdeepconvectivecloudsasobservedbyMODIS. J.Climate,23,3457–3473.
Zhang,X.D.,J.E.Walsh,J.Zhang,U.S.Bhatt,andM.Ikeda, 2004:Climatologyandinterannualvariabilityofarcticcycloneactivity:1948–2002.J.Climate,17,2300–2317.
Zhang,Y.X.,Y.H.Ding,andQ.P.Li,2012:Interdecadalvariationsofextratropicalcycloneactivitiesandstormtracksinthe NorthernHemisphere.ChineseJournalofAtmosphericSciences,36(5),912–928.(inChinese)
:Yi,M.J.,Y.F.Fu,P.Liu,and Z.X.Zheng,2015:Deep convective clouds over the northern Pacific and their relationship w ith oceanic cyclones.Adv.Atmos.Sci.,32(6),821–830,
10.1007/s00376-014-4056-9.
(Received 29 April2014;revised 7 October 2014;accepted 31 October 2014)
∗Corresponding author:FU Yunfei
Email:fyf@ustc.edu.cn
©Institute of Atm ospheric Physics/Chinese Academ y of Sciences,and Science Press and Springer-Verlag Berlin Heidelberg 2015
杂志排行
Advances in Atmospheric Sciences的其它文章
- Characterization of Organic Aerosols in Beijing Using an Aerodyne High-Resolution Aerosol M ass Spectrometer
- Dryland Expansion in Northern China from 1948 to 2008
- Numerical Simulations of Heavy Rainfallover Central Korea on 21 Sep tember 2010 Using the WRF M odel
- Precipitation Changes in Wetand Dry Seasons over the 20th Century Simulated by Two Versions of the FGOALS M odel
- Projections of the Advance in the Startof the Grow ing Season during the 21st Century Based on CM IP5 Simulations
- A Diagnostic Analysis on the Effectof the Residual Layer in Convective Boundary Layer Development near M ongolia Using 20th Century Reanalysis Data
