Dryland Expansion in Northern China from 1948 to 2008
2015-04-20LIYueHUANGJianpingJIMingxiaandRANJinjiang
LIYue,HUANG Jianping,JIM ingxia,and RAN Jinjiang
Key Laboratory for Semi-Arid Climate Change of the Ministry of Education, College ofAtmospheric Sciences,Lanzhou University,Lanzhou730000
Dryland Expansion in Northern China from 1948 to 2008
LIYue,HUANG Jianping∗,JIM ingxia,and RAN Jinjiang
Key Laboratory for Semi-Arid Climate Change of the Ministry of Education, College ofAtmospheric Sciences,Lanzhou University,Lanzhou730000
This study examines the expansion ofdrylandsand regionalclimate change in northern China by analyzing the variations in aridity index(AI),surface air temperature(SAT),precipitation and potentialevapotranspiration(PET)from 1948 to 2008. It is found that the drylands of northern China have expanded remarkably in the last 61 years.The area of drylands of the last15 years(1994–2008)is 0.65×10⁶km2(12%)larger than that in the period 1948–62.The boundary of drylands has extended eastward over Northeast China by about2◦of longitude and by about1◦of latitude to the south along the m iddleto-lower reaches of the Yellow River.A zonalband of expansion of sem i-arid regions has occurred,stretching from western Heilongjiang Province to southern Gansu Province,while shifts to the eastof semi-arid regions in dry subhumid regions have also occurred.Results show that the aridity trend of drylands in northern China is highly correlated w ith the long-term trend of precipitation and PET,and the expansion of sem i-arid regions plays a dom inant role in the arealextentof drylands,which is nearly 10 times larger than thatin arid and subhumid regions.
aridity index,dryland expansion,climate variation,northern China
1.Introduction
Drylands are areas where precipitation is scarce and typically unpredictable,and can be divided into four subtypes: hyper-arid,arid,sem i-arid,and dry subhum id areas.Drylands cover about41%of Earth’s land surface,are home to about35%of the world’s population,and have some of the highest levelsofpoverty(GLP,2005;M illennium Ecosystem Assessment,2005;Mortimore,2009).Drylands are characterized by a dry climate and a low nutrition contentand water conservation capacity of soil.The ecosystems of drylands are vulnerable and sensitive to climate change and human activities(Dietz etal.,2004;Reynolds etal.,2007;Reed et al.,2012).Feng and Fu(2013)showed that global drylands have expanded in the last 60 years,and w ill continue to expand in the 21stcentury.Expansions of drylands have a direct consequence for desertification,defined as land degradation in arid,semi-arid and dry subhumid areas resulting from various factors,including climatic variations and human activities[United Nations Convention to Combat Desertification (UNCCD),1994].Some form of severe land degradation is present in 10%–20%of drylands,a figure that is likely to expand substantially in the face of climate change and population grow th(Reynolds et al.,2007).In drylands,the combination of climatic variability and imprudent land use can adversely alter the region’s climate(Nicholson,2011).
Recent research has revealed thatdrying trends over drylands underglobalwarm ing can be detected from both observations and model simulations(Ma and Fu,2006,2007;Fu etal.,2008;Overpeck and Udall,2010;Dai,2013),and increases in the extentand severity of desertification or degradation,which can be attributed to both climate change and human activities(Sun,2000;Wang et al.,2003;Yang et al., 2005;Wang et al.,2006).An important consequence of the expansion of drylands is desertification,which is a central issue for sustainable development(Reynolds et al.,2007). Moreover,the loss of vegetation cover may exacerbate the impacts of drought,and increased aridity w ill promote the mobilization of dust,further leading to frequent dust storms originating from dustsource regions(Wang etal.,2008).The effectof dustaerosols on climate over drylands willbecome more evident(Huang et al.,2010;Xi and Sokolik,2012; Huang,2013).Therefore,research has been conducted on the impact of dust aerosols on climate in northern China by using satellite observations(Huang et al.,2007,2010;Chen et al.,2010),ground-based measurements(Huang etal.,2008; Wang etal.,2010;Bietal.,2011;Wang etal.,2013b,2014), and modelsimulations(Chen etal.,2013).
As we know,climatic fluctuations and human m ismanagementcould initiate the process of desertification and even a long-term degradation of the environment.Know ledge ofhow climate change and human activities w illaffect the extent of drylands is essential for the protection and proper management of these regions,in order to maintain drylands as sustainable resources(Reynolds et al.,2007;Mortimore, 2009;Nicholson,2011).A lthough globally drylands have already been investigated by many studies(e.g.Hulme,1996; Seager etal.,2007;Feng and Fu,2013),only a few studies have focused on the regionalclimate of drylands in EastAsia, especially northern China.For example,Ma and Fu(2003) and Ma and Dan(2005)studied climate change overdrylands in northern China,demonstrating that the aridity trend has been further aggravated.Aridification has intensified over Northeast China due to regional climate changes related to global warm ing as well as the anthropogenic effects of the rapid development of the social economy and the expansion of urbanization(Fu etal.,2008).The subsequentexpansion of drylands w ill cause an increase in the population affected by waterscarcity and land degradation.
In this paper,we exam ine the expansion of drylands in northern China and the regional climate variability over drylands by analyzing datasets of aridity index,surface air temperature,precipitation,and potentialevapotranspiration from 1948 to 2008,and try to explain the possible reasons for the expansion.The methods and data used in this study are described in section 2,and results regarding dryland expansion and climate change over drylands are presented in sections 3 and 4,respectively.Further discussion and a summary are provided in section 5.
2.M ethods and data
2.1.Aridity indices
Aridity refers to the dryness of the atmosphere,which is essentially a climatic phenomenon that is based on average climatic conditions overa region(Agnew and Anderson, 1992).Numerous numerical indices have been proposed to quantify the degree of climatic dryness at a given location [see the review of aridity indices by Stadler(2005)].However,there is a lack of agreementover the approaches used to delineate the exactboundaries between lands of differing aridity.
The simplest aridity index is based solely on precipitation.A commonly used rainfall-based definition is that drylands receive less than 600 mm of precipitation peryear,and can be further divided into hyper-arid(annual precipitation≤50 mm),arid(50 mm<annual precipitation≤200 mm), sem i-arid(200 mm<annual precipitation≤400 mm),and dry subhum id(400 mm<annual precipitation≤600 mm)regions.
Aridity index(AI)isdefined as the ratio ofannualprecipitation to annual potential evapotranspiration(PET),which is a quantitative indicator of the degree of water deficiency at a given location.Drylands are regions w ith AI≤0.65, which are further divided into hyper-arid(AI≤0.05),arid (0.05<AI≤0.2),semi-arid(0.2<AI≤0.5),and dry subhumid (or subhum id for simplicity)(0.5<AI≤0.65)regions(M iddleton and Thomas,1997;Mortimore,2009).PET represents the evaporative demand of the atmosphere.Itis calculated by the Penman–Monteith algorithm(Maidment,1993),which includes the effects of temperature,hum idity,solar radiation and w ind.This algorithm is superior to other formulations, which usually only consider the effectof temperature(Donohue etal.,2010;Dai,2011;Feng and Fu,2013).
2.2.Data
The monthly mean surface air temperature(SAT)and precipitation datasets from 1948 to 2008 developed by the Climate Prediction Center(CPC)are used in this study(Chen etal.,2002;Fan and van den Dool,2008).The datasets are globally gridded at 0.5◦×0.5◦resolution.To calculate PET using the Penman–Monteith algorithm,SAT,specific hum idity,solar radiation and w ind speed are needed.Ow ing to the scarcity ofobservations forspecific hum idity,solar radiation and w ind speed,the datasets of these quantities are from the Global Land Data Assim ilation System(GLDAS)(Rodellet al.,2004)starting from 1948.The resolution of the data is 0.5◦×0.5◦.The data of global surface vegetation types are from satellite Moderate Resolution Imaging Spectroradiometer(MODIS)observations[ISLSCP IIMODIS(Collection 4, 2010)IGBP Land Cover].
3.Results
3.1.Expansion of drylands in northern China
The distribution of drylands,including the individual components in northern China for 1961–90 climatology,as identifi ed by the two considered definitions of AIand annual precipitation,are shown in Figs.1a and b.The area of dryland defined by AI(Fig.1a)is smaller than that defined by annual precipitation(Fig.1b).The hyper-arid and arid regionsmatch well,and the main differencesare oversemi-arid and subhum id regions.In northeastern Inner Mongolia and mostof Heilongjiang,the classification is subhum id based on annualprecipitation,while itis hum id based on AI.Aridity is a function of the interplay between temperature,precipitation and evaporation.The use of annual precipitation as an index of aridity ignores the importance of temperature and evaporation;therefore,the classification of drylands based on AI is more reasonable and reliable,and is used in the follow ing analyses.
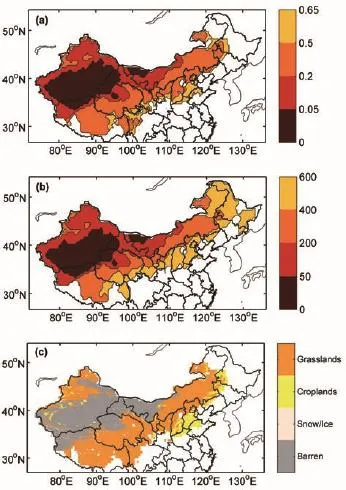
Fig.1.Distribution of drylands in northern China for 1961–90 climatology based on(a)AIand(b)annual precipitation(mm) versus(c)corresponding surface vegetation types from MODIS observations.
As shown in Fig.1a,semi-arid regions dominate the coverage of drylands,which are distributed in a northeast–northwest zonal band,covering most of Inner Mongolia, Hebei,northern Shaanxi,Ningxia,central Gansu,Qinghai and Tibet.There are also some small areas over Junggar Basin and Tianshan Mountains.The total area of semi-arid regions is 2.14×10⁶km2,and these regions are mainly covered by grassland(Fig.1c).The hyper-arid regions mainly occur in Northwest China,mostly covering Xinjiang Province, some parts of Gansu,Qinghaiand Tibet,and the northwestern edge of InnerMongolia.The arid regionssurround the hyperarid regions and extend eastward to central Inner Mongolia. The hyper-arid and arid regions are dom inated by barren or sparsely vegetated land.Moreover,the dry subhumid regions only distribute in a narrow band along the southern edge of the sem i-arid regions,where the MODIS surface vegetation types are grassland and cropland(Liu et al.,2013a). The areas of hyper-arid,arid and dry subhum id regions are 1.06×106,1.42×106and 1.00×10⁶km2,respectively. Hence,the totalarea of drylands is 5.62×10⁶km2in northern China.The derived spatialdistribution of drylands(Fig. 1a)generally matches wellw ith the surface vegetation types over those regions from MODIS observations(Fig.1c).However,there is no exact match between the dryland subtypes and the surface vegetation types.For example,barren and grassland may occur in different areas of the same dryland subtype(i.e.arid);grassland even occurs in three different dryland subtypes of arid,sem i-arid and subhum id regions. The presence of different surface vegetation types in each dryland subtype demonstrates thatvegetation speciesrespond notonly to the overallmoisture deficitbutalso to other environmental variables,such as soils,geomorphological and landscape features(Safrieland Adeel,2005).
The temporal variations of dryland areas in northern China,including the total and individual components of hyper-arid,arid,sem i-arid and dry subhumid regions are shown in Fig.2.It can be seen that the drylands for the total and individual components over China have been expanding during the last61 years,except for the hyper-arid regions.Among those components,the expansion of sem i-arid regions is the fastest,by 0.111×10⁶km2(10 yr)-1,which is about10 times faster than those of arid and dry subhum id regions[0.013×10⁶and 0.017×10⁶km2(10 yr)-1,respectively].However,the hyper-arid regions have shrunk slightly from 1948 to 2008,at a rate of change of-0.002×10⁶km2(10 yr)-1. In summary,the total dryland area has been expanding rapidly by 0.12×10⁶km2(10 yr)-1,driven mainly by the rapid expansion of semi-arid regions.
We also compare the areas of drylands in northern China in the last15 years(1994–2008)w ith those in the earliest15 years of the time series of the datasets(1948–62).A ll the components of drylands expanded except for the hyper-arid regions,and the expansion of semi-arid regions in northern China is very significant.The drylands in northern China have increased in units of 106km2by 0.06 for arid,0.63 for sem i-arid,and 0.03 for dry subhum id regions,relative to 1948–62(Table 1).These increases correspond to relative increases of 4%,33%and 3%,respectively.Note that the expansion of sem i-arid regions is the mostsevere during the last61 years,which ismore than 10 times larger than those in the other two regions.On the contrary,the area of hyper-arid regions has decreased by 0.07×10⁶km2(6%).The average area of all drylands of the last 15 years(1994–2008)is 6.07×10⁶km2,which is 0.65×10⁶km2(12%)larger than that for1948–62.
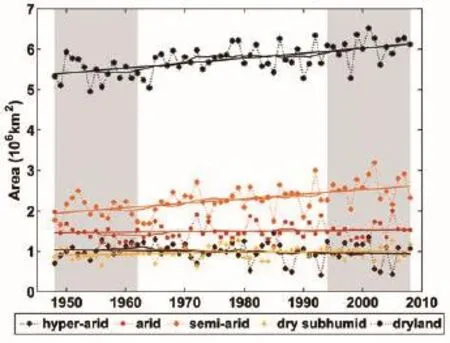
Fig.2.Temporal variations in areal coverage of drylands in northern China for the totaland individual components in units of 106km2.Thick lines are 15-yr smoothed to emphasize the climate change.Solid lines are the fi t to the data of the totaland individualcomponentof drylands.
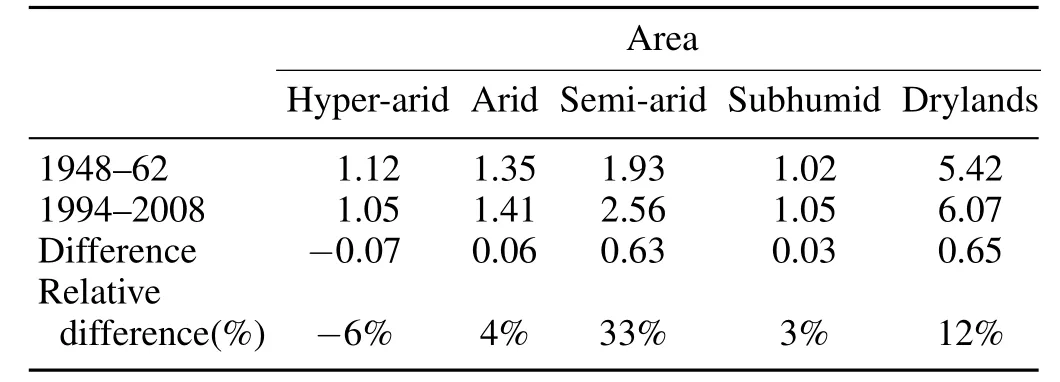
Table 1.Areal changes of drylands in northern China for the total and individual components of hyper-arid,arid,sem i-arid and dry subhum id regions from 1948–62 to 1994–2008,in units of106km2.

Fig.3.The boundaries of areal change of drylands from 1948–62(green)to 1994–2008(red).
The boundaries of areal change of drylands from 1948–62 to 1994–2008 show that the expansion of drylands mainly occurs over NortheastChina and the m iddle-to-lower reaches of the Yellow River(see Fig.3).In NortheastChina,drylands expanded eastward dramatically by about2◦of longitude,especially over the northwestof InnerMongolia,and the area of expansion is almostequivalent to the entire area of Liaoning Province.A few patches in southern Heilongjiang Province and Liaodong Peninsula turned into drylands in the last 15 years.In addition,over the m iddle-to-lower reaches of the Yellow River,drylands expanded southward by about 1◦of latitude.In central Shaanxi Province in particular,the expansion reaches 2◦of latitude.The Shandong Peninsula has also turned into dryland in the last15 years.The southwestern boundary of drylands has remained relatively stationary, so the expansion is not obvious in the westbetween 1948–62 and 1994–2008.This result is consistent w ith a previous study by Ma etal.(2005),which shows thatthere is a trend of the boundaries moving eastward or southward in the last100 years,and the trend is particularly pronounced for the arid and semi-arid boundaries during the last50 years.
Figure 4a shows the changes in coverage to drier types for the last 15 years relative to 1961–90 climatology.It can be seen that the expansion of sem i-arid regions occurs over Northeast China,which shows a zonal band stretching from western Heilongjiang,Jilin and eastern InnerMongolia, across mostof Hebei,Shanxiand Shaanxi,and then to southern Gansu.Major expansions of dry subhum id regions have also occurred over Northeast China,to the east of sem i-arid regions,including western Heilongjiang,Jilin and Liaoning, and a large coverage in northeast Inner Mongolia.The expansions of arid and hyper-arid regions are relatively small and have mainly occurred in a narrow zonalband across central Inner Mongolia and on the western edge of the Kunlun mountains,respectively.The expansion of drylands is not a universal trend;some regions have experienced dryland retreat,suggesting they are getting wetter.As Fig.4b shows,a retreatofhyper-arid to arid regions hasoccurred on the edges of the Tarim Basin and Tianshan Mountains,and a retreatof arid to semi-arid regions can be seen to have mainly occurred over central Tibet and in small patches on the edge of Junggar Basin.Moreover,the coverage of the retreatof sem i-arid (subhum id)to subhum id(hum id)is even smaller and scattered.It is clear that the areas w ith reduced aridity are much smaller than those w ith intensified aridity(Fig.4b).
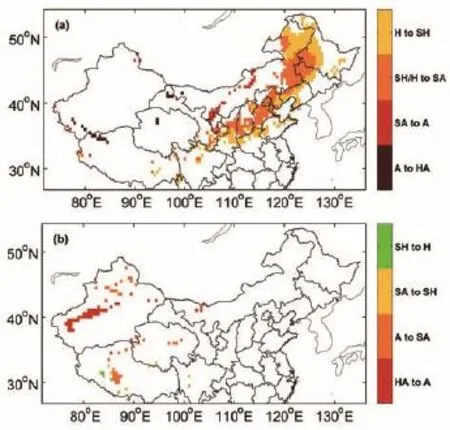
Fig.4.Changes in coverage to(a)drier types and(b)wetter types for 1994–2008 relative to 1961–90.H,SH,SA,A,and HA representhum id,subhum id,sem i-arid,arid and hyper-arid, respectively.
The total area of drylands has increased by 0.65×10⁶km2between 1948–62 and 1994–2008(Table 1).The contributions of different type transitions to the areal change have been calculated(Table 2).The area of hyper-arid regions has reduced by 0.065×10⁶km2.This change has two components,including the expansion of arid to hyperarid regions(0.049×10⁶km2)and the retreat of hyper-arid to arid regions(0.114×10⁶km2).Hyper-arid is already the driest type,so it can only expand from and retreat to wetter type,which is arid.For the other components of drylands,four situations have to be taken into account,since both expansion and retreathave two transitions from/to drier and wetter types,respectively.For example,the areal change of sem i-arid regions is 0.625×10⁶km2between 1948–62 and 1994–2008,calculated by considering two aspects.One aspect is the expansion of the two transitions from arid to sem i-arid regions(from drier type,0.092×106km2)and from subhum id/hum id to sem i-arid regions(from wetter type, 0.638×10⁶km2);and the other is the retreat,which also includes two transitions from sem i-arid to arid regions(to drier type,0.084×106km2)and from sem i-arid to subhumid regions(to wetter type,0.021×106km2).The netexpansion is then simply the totalexpansion m inus the total retreat.Itcan be seen thatthe expansion of sem i-arid regions is very severe, contributed mostly by the transitions from wetter type(i.e. subhumid/humid).Note that the areal change of the expansion from subhumid/humid to sem i-arid regions is 30 times larger than thatof the retreat from sem i-arid to subhum id re-gions.In addition,humid regions became drierand can even directly turn into semi-arid regions,which have contributed 0.087×10⁶km2to the expansion of sem i-arid regions.A ll of these results indicate that aridity has intensified dramatically.Using the same method,the netexpansions of arid and subhumid regions are 0.057×10⁶km2and 0.029×10⁶km2, respectively.
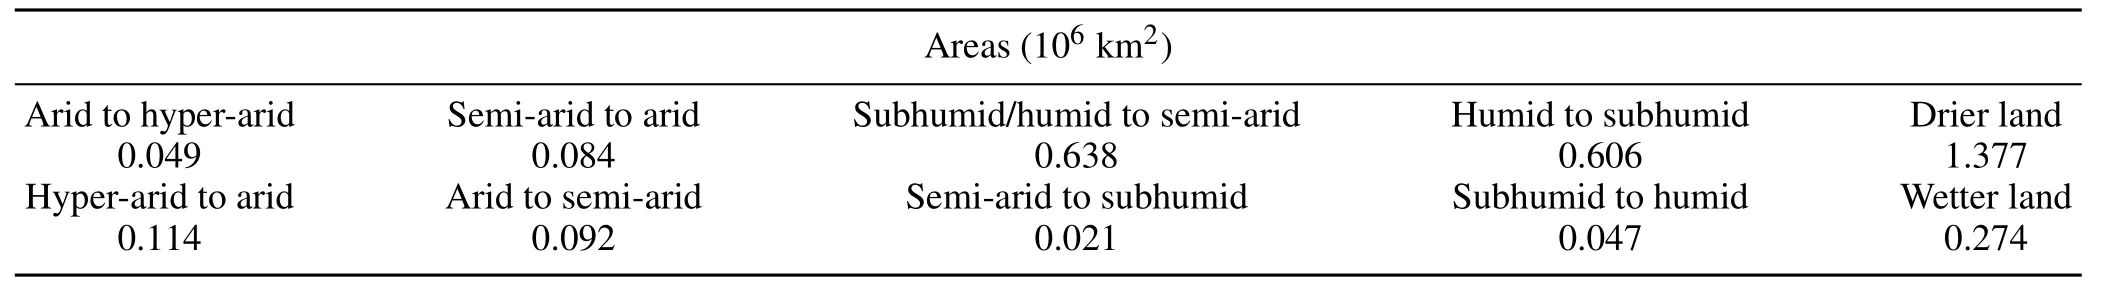
Table 2.The contributions of different type transitions to the areal changes between 1948–62 and 1994–2008,units:106km2.
3.2.Climate change over drylands
We also analyzed the climate variations over the expanded drylands according to the boundary of drylands for 1994–2008.The spatial distributions of trends of AI,SAT, precipitation and PET are shown in Fig.5.AI shows a positive trend in the region to the west of 100◦E and a negative trend to the east of 100◦E(Fig.5a).AI decreases significantly over the eastern drylands,and the trend rate of AI can reach-0.06(10 yr)-1along the edge of drylands(e.g. in HebeiProvince and northeast Inner Mongolia).This is the resultof decreasing precipitation and increasing PET over the eastern drylands.The strong negative trend of AI in the east of northern China can lead to type transitions to drier types, like the transition from humid to subhumid,oreven to semiarid,thus further resulting in the expansion of drylands.Precipitation shows a“wet-west–dry-east”pattern over the expanded drylands,buteven a slightincrease in precipitation in the west cannotsignificantly m itigate the droughtstress,and the decreasing trend can reach-40 mm(10 yr)-1in Hebei Province(Fig.5c).The results are consistent w ith previous studies(Gong et al.,2004;Zhai et al.,2005;Zhang et al.,2011;Liu et al.,2013b;Wang etal.,2013a)that investigated the spatialand temporal variations of precipitation in China by using precipitation data from large amounts of meteorological stations.The temperature has increased during the past61 years over mostof the drylands,except for several small patches(Fig.5b).Huang etal.(2012)examined SAT trends and found that the warming trend was particularly enhanced over sem i-arid regions.Jietal.(2014)further supported this resultby using the spatiotemporalmultidimensional ensemble empirical mode decomposition(MEEMD) method.In summary,the trend of aridity is enhanced in northern China,resulting from decreasing precipitation and increasing temperature in mostof the areas in northern China, which leads to the expansion of drylands.
4.Summary and discussion
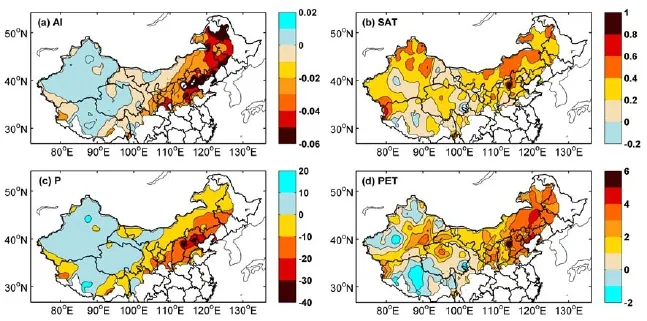
Fig.5.Spatial distributions of trends of(a)AI[(10 yr)-1],(b)SAT[◦C(10 yr)-1],(c)precipitation[mm(10 yr)-1], and(d)PET[mm(10 yr)-1]over the expanded drylands.
In this paper,we analyze the areal changes of drylands in terms of AI,and the regional climate variability in northern China,using historical records of SAT,precipitation and PET from 1948 to 2008.The results indicate thatsemi-arid regions dom inate the coverage of drylands,which distribute in a northeast–northwest zonalband,covering most of Inner Mongolia,Hebei,Shanxi,northern Shaanxi,Ningxia,central Gansu,Qinghaiand Tibet.The changes in precipitation patterns and increase of PET have led to an increase in aridity under globalwarm ing,and thus the expansion of drylands in northern China in the last 61 years.The total area of drylands of the last15 years is 0.65×10⁶km2(12%)larger thanthat in the period 1948–62.The areal change of drylands for 1994–2008 relative to 1948–62 shows a distinct boundary extension.The drylands over Northeast China have expanded nearly 2◦of longitude to the east and 1◦of latitude to the south along the m iddle-to-lower reaches of the Yellow River.Alongside the expansion,some regions have experienced dryland retreat.A major retreat of hyper-arid to arid regions has occurred on the edges of the Tarim Basin and Tianshan Mountains,and a retreatofarid to sem i-arid regions has occurred mainly over central Tibetand on the edge of JunggarBasin.Among all the componentsofdrylands,the expansion of semi-arid regions has played a dom inant role in the arealextentofdrylands,being nearly 10 times larger than those in arid and subhum id regions.In contrast,hyper-arid regions,which cover large areas of Xinjiang,some parts of Gansu,Qinghaiand Tibet,and the northwestern edge of Inner Mongolia,shrank slightly from 1948 to 2008,ata rate of -0.002×10⁶km2(10 yr)-1.Therefore,we conclude thatthe total area of drylands in northern China has been expanding rapidly by 0.12×10⁶km2(10 yr)-1,mainly driven by the rapid expansion of sem i-arid regions.
The decrease of precipitation and increase of PET over eastern drylands undera warm ing climate have led to the increase in aridity and expansion ofdrylands in northern China. The precipitation in this region is strongly influenced by the summer monsoon,which is a major source of precipitation in China.A weakening of the summer monsoon,caused by changes in land cover(Fu and Yuan,2001;Fu,2003;Zhang etal.,2005),results in decreases in all the components of the surface water balance,such as precipitation,runoff,and soil water content.Wang and Li(1990)also found thata stronger Hadley circulation w ill induce a stronger intensity of the subtropicalhigh,which in turn w ill lead to a decrease in the extentof the northern latitude of the summermonsoon and thus a decrease of precipitation in sem i-arid regions in northern China.Temperature rises(Huang etal.,2012;Jietal.,2014) lead to increased surface evaporation and a decrease in the surface waterbudget,which isunfavorable forwateraccumulation at the surface,and thus is an important factor causing aridity and dryland expansion.A ll these factors contribute to the expansion of drylands,but the individual contributions of these factors need to be clarified in further studies.
In summary,sem i-arid regions are the most vulnerable and sensitive to regional climate change among all the four components of drylands.Although previous studies have already pointed outa significantexpansion of globaldrylands, only a few studies have focused on northern China,which is a major region ofarid and sem i-arid land in EastAsia.Therefore,further studies are needed to build upon the present study’s findings to better understand the drylands of northern China.
Acknow ledgements.This work was jointly supported by the National Basic Research Program of China(Grant No.2012CB 955301),the National Science Foundation of China(Grant Nos. 41175134 and 41305060),and a China 111 project(Grant No. B13045).
REFERENCES
Agnew,C.,and E.Anderson,1992:Water Resources in the Arid Realm.Routledge,London,323 pp.
Bi,J.R.,J.P.Huang,F.Qiang,X.Wang,J.S.Shi,W.Zhang,Z. W.Huang,and B.D.Zhang,2011:Toward characterization of the aerosolopticalproperties over Loess Plateau of Northwestern China.Journal ofQuantitative Spectroscopy and Radiative Transfer,112,346–360.
Chen,B.,J.Huang,P.M innis,Y.Hu,Y.Yi,Z.Liu,D.Zhang, and X.Wang,2010:Detection of dustaerosolby combining CALIPSO active lidar and passive IIR measurements.Atmos. Chem.Phys.,10,4241–4251.
Chen,M.,P.Xie,J.E.Janow iak,and P.A.Arkuin,2002:Global land precipitation:A 50-yr monthly analysis based on gauge observations.Journal of Hydrometeorology,3,249–266.
Chen,S.Y.,J.P.Huang,C.Zhao,Y.Qian,L.R.Leung,and B. Yang,2013:Modeling the transport and radiative forcing of Taklimakan dustover the Tibetan Plateau:A case study in the summerof2006.J.Geophys.Res.,118,797–812.
Dai,A.G.,2011:Characteristics and trends in various forms of the Palmerdroughtseverity index during 1900–2008.J.Geophys. Res.,116(D12115),doi:10.1029/2010JD015541.
Dai,A.G.,2013:Increasing droughtunder globalwarm ing in observations and models.Nature Climate Change,3,52–58.
Dietz,A.J.,R.Ruben,and A.Verhagen,2004:The Impactof Climate Change on Drylands.Springer,465 pp.
Donohue,R.J.,T.R.McVicar,and M.L.Roderick,2010:Assessing the ability of potential evaporation formulations to capture the dynam ics in evaporative demand w ithin a changing climate.J.Hydrol.,386,186–197.
Fan,Y.,and H.van den Dool,2008:A global monthly land surface air temperature analysis for 1984-present.J.Geophys. Res.,113(D01103),doi:10.1029/2007JD008470.
Feng,S.,and Q.Fu,2013:Expansion of global drylands under a warm ing climate.Atmos.Chem.Phys.,13,10081–10094.
Fu,C.,2003:Potential impacts of human-induced land cover change on EastAsia monsoon.Global Planetary Change,37, 219–229.
Fu,C.,Z.Jiang,Z.Guan,J.He,and Z.Xu,2008:Regional Climate Studies of China.Springer,476 pp.
Fu,C.B.,and H.L.Yuan,2001:An virtual numerical experiment to understand the impacts of recovering natural vegetation on the summer climate and environmental conditions in East Asia.Chinese Science Bulletin,46,1199–1203.
GLP,2005:Global Land Project—Science plan and implementation strategy.IGBP(International Geosphere Biosphere Program)Report No.53/International Human Dimensions Programme ReportNo.19,IGBP Secretariat,Stockholm,64 pp.
Gong,D.Y.,P.J.Shi,and J.A.Wang,2004:Daily precipitation changes in the sem i-arid region over northern China.Journal of Arid Environments,59,771–784.
Huang,J.,P.M innis,H.Yan,Y.Yi,B.Chen,L.Zhang,and J.K.Ayers,2010:Dust aerosol effect on sem i-arid climate over Northwest China detected from A-Train satellite measurements.Atmos.Chem.Phys.,10,6863–6872.
Huang,J.,X.Guan,and F.Ji,2012:Enhanced cold-season warming in semi-arid regions.Atmos.Chem.Phys.,12,5391–5398.
Huang,J.P.,2013:Observing the impactof Asia dustaerosols on aridity.SPIE Newsroom,doi:10.1117/2.1201306.004858.
Huang,J.P.,J.M.Ge,and F.Z.Weng,2007:Detection of Asia duststorms using multisensorsatellite measurements.RemoteSensing of Environment,110,186–191.
Huang,J.P.,and Coauthors,2008:An overview of the sem iarid climate and environment research observatory over the Loess Plateau.Adv.Atmos.Sci.,25,906–9211,doi: 10.1007/s00376-008-0906-7.
Hulme,M.,1996:Recentclimatic change in the world’s drylands. Geophys.Res.Lett.,23,61–64.
Ji,F.,Z.H.Wu,J.P.Huang,and E.P.Chassignet,2014:Evolution of land surface air temperature trend.Nature Climate Change, 4,462–466,doi:10.1038/nclimate2223.
Liu,L.,X.L.Xu,D.F.Zhuang,X.Chen,and S.Li,2013a: Changes in the potentialmultiple cropping system in response to climate change in China from 1960–2010.Plos One,8(12), e80990.
Liu,X.M.,D.Zhang,Y.Z.Luo,and C.M.Liu,2013b:Spatialand temporal changes in aridity index in northwest China:1960 to 2010.Theor.Appl.Climatol.,112,307–316.
Ma,Z.G.,and C.B.Fu,2003:Interannual characteristics of the surface hydrologicalvariables over the arid and semi-arid areas of northern China.Global Planetary Change,37,189–200.
Ma,Z.G.,and L.Dan,2005:Dry/wet variation and its relationship w ith regionalwarm ing in arid-regions of Northern China. Chinese Journal of Geophysics,48,1091–1099.
Ma,Z.G.,and C.B.Fu,2006:Some evidence of drying trend over northern China from 1951 to 2004.Chinese Science Bulletin, 51,2913–2925.
Ma,Z.G.,and C.B.Fu,2007:Globalaridification in the second half of the 20th century and its relationship to large-scale climate background.Science in China Series D:Earth Sciences, 50,776–788.
Ma,Z.G.,C.B.Fu,and L.Dan,2005:Decadal variations of arid and sem i-arid boundary in China.Chinese Journal of Geophysics,48,574–581.
Maidment,D.R.,1993:Handbook of Hydrology.M cGraw-Hill, 1424 pp.
M iddleton,N.J.,and D.S.G.Thomas,1997:World Atlas of Desertification.2nd ed.,Edward Arnold,182 pp.
M illennium Ecosystem Assessment,2005:Ecosystems and Human Well-being:Synthesis.Island Press,Washington,DC., 137 pp.
Mortimore,M.,2009:Dryland Opportunities.Island Press,98 pp.
Nicholson,S.E.,2011:Dryland Climatology.Cambridge University Press,516 pp.
Overpeck,J.,and B.Udall,2010:Dry times ahead.Science,328, 1642–1643.
Reed,S.C.,K.K.Coe,J.P.Sparks,D.C.Housman,T.J.Zelikova,and J.Belnap,2012:Changes to dryland rainfall result in rapid moss mortality and altered soil fertility.Nature Climate Change,2,752–755.
Reynolds,J.F.,and Coauthors,2007:Global desertification: building a science for dryland development.Science,316, 847–851.
Rodell,M.,and Coauthors,2004:The global land data assimilation system.Bull.Amer.Meteor.Soc.,85,381–394.
Safriel,U.,and Z.Adeel,2005:Dryland systems.Ecosystems and Human Well-being,Current State and Trends,Hassan etal., Eds.,Island Press,Washington,625–658.
Seager,R.,and Coauthors,2007:Model projections of an imm inent transition to a more arid climate in southwestern North America.Science,316,1181–1184.
Stadler,S.J.,2005:Aridity indices,89–94.Encyclopedia of World Climatology,Oliveretal.,Eds.,Heidelberg.Springer,854 pp.
Sun,W.,2000:Interaction between desertification boundary and pressure lines of population and husbandry in the Houshan area of Bashang since 1950.Journal of Desert Research,20, 154–158(in Chinese).
UNCCD,1994:United Nations Convention to Combat Desertification in Those Countries Experiencing Serious Drought and/or Desertification,Particularly in A frica(UNCCD). U.N.Doc.A/AC.241/27,33 I.L.M.1328,United Nations, 58 pp.[Available online at http://www.unccd.int/Lists/Site DocumentLibrary/conventionText/conv-eng.pdf.]
Wang,H.J.,Y.N.Chen,and Z.S.Chen,2013a:Spatial distribution and temporal trends of mean precipitation and extremes in the arid region,northwestof China,during 1960–2010.Hydrological Processes,27,1807–1818.
Wang,T.,W.Wu,X.Xue,W.M.Zhang,Z.W.Han,and Q.W. Sun,2003:Time-space evolution of desertification land in northern China.Journal of Desert Research,23,230–235(in Chinese).
Wang,W.C.,and K.R.Li,1990:Precipitation fluctuation over sem iarid region in Northern China and the relationship w ith ElNi˜no/Southern oscillation.J.Climate,3,769–783.
Wang,X.M.,F.H.Chen,and Z.B.Dong,2006:The relative role of climatic and human factors in desertification in sem iarid China.GlobalEnvironmental Change,16,48–57.
Wang,X.,J.Huang,M.Ji,and K.Higuchi,2008:Variability of East Asia dustevents and their long-term trend.Atmos.Environ.,42,3156–3165.
Wang,X.,J.P.Huang,R.D.Zhang,B.Chen,and J.R.Bi, 2010:Surface measurements ofaerosolproperties overnorthwestChina during ARM China 2008 deployment.J.Geophys. Res.,115(D7),doi:10.1029/2009JD013467.
Wang,X.,S.J.Doherty,and J.P.Huang,2013b:Black carbon and other light-absorbing impurities in snow across Northern China.J.Geophys.Res.,118,1471–1492.
Wang,X.,B.Q.Xu,and J.M ing,2014:An overview of the studies on black carbon and mineral dust deposited in snow and ice core in East Asia.J.Meteor.Res.,28,354–370.
Xi,X.,and I.N.Sokolik,2012:Impact of Asian dust aerosol and surface albedo on photosynthetically active radiation and surface radiative balance in dryland ecosystems.Advances in Meteorology,2012,Article ID 276207,doi:10.1155/2012/ 276207.
Yang,X.,K.Zhang,B.Jia,and L.Ci,2005:Desertification assessment in China:An overview.Journal of Arid Environments, 63,517–531.
Zhai,P.M.,X.B.Zhang,H.Wan,and X.H.Pan,2005:Trends in total precipitation and frequency of daily precipitation extremes over China.J.Climate,18,1096–1108.
Zhang,J.Y.,W.J.Dong,and C.B.Fu,2005:Impactof land surface degradation in northern China and southern Mongolia on regional climate.Chinese Science Bulletin,50,75–81.
Zhang,Q.,C.Y.Xu,X.H.Chen,and Z.X.Zhang,2011:Statisticalbehaviours of precipitation regimes in China and their links w ith atmospheric circulation 1960–2005.International Journal of Climatology,31,1665–1678.
:Li,Y.,J.P.Huang,M.X.Ji,and J.J.Ran,2015:Dryland expansion in northern China from 1948 to 2008.Adv. Atmos.Sci.,32(6),870–876,
10.1007/s00376-014-4106-3.
(Received 17 May 2014;revised 17 October2014;accepted 29 October2014)
∗Corresponding author:HUANG Jianping
Email:hjp@lzu.edu.cn
©Institute of Atm ospheric Physics/Chinese Academ y of Sciences,and Science Press and Springer-Verlag Berlin Heidelberg 2015
杂志排行
Advances in Atmospheric Sciences的其它文章
- Characterization of Organic Aerosols in Beijing Using an Aerodyne High-Resolution Aerosol M ass Spectrometer
- Numerical Simulations of Heavy Rainfallover Central Korea on 21 Sep tember 2010 Using the WRF M odel
- Precipitation Changes in Wetand Dry Seasons over the 20th Century Simulated by Two Versions of the FGOALS M odel
- Projections of the Advance in the Startof the Grow ing Season during the 21st Century Based on CM IP5 Simulations
- Deep Convective Clouds over the Northern Pacific and Their Relationship w ith Oceanic Cyclones
- A Diagnostic Analysis on the Effectof the Residual Layer in Convective Boundary Layer Development near M ongolia Using 20th Century Reanalysis Data