Characterization of Organic Aerosols in Beijing Using an Aerodyne High-Resolution Aerosol M ass Spectrometer
2015-04-20ZHANGJunkeWANGYuesiHUANGXiaojuanLIUZiruiJIDongshengandSUNYang
ZHANG Junke,WANG Yuesi,HUANG Xiaojuan,LIU Zirui,JIDongsheng,and SUN Yang
State Key Laboratory of Atmospheric Boundary Layer Physics and Atmospheric Chemistry, Institute of Atmospheric Physics,Chinese Academy of Sciences,Beijing100029
Characterization of Organic Aerosols in Beijing Using an Aerodyne High-Resolution Aerosol M ass Spectrometer
ZHANG Junke,WANG Yuesi,HUANG Xiaojuan,LIU Zirui,JIDongsheng,and SUN Yang∗
State Key Laboratory of Atmospheric Boundary Layer Physics and Atmospheric Chemistry, Institute of Atmospheric Physics,Chinese Academy of Sciences,Beijing100029
Fine particle of organic aerosol(OA),mostly arising from pollution,are abundant in Beijing.To achieve a better understanding of the difference in OA in summer and autumn,a high-resolution time-of-fl ightaerosolmass spectrometer(HRToF-AMS,Aerodyne Research Inc.,USA)was deployed in urban Beijing in Augustand October2012.The mean OA mass concentration in autumn was 30±30µg m-3,which was higher than in summer(13±6.9µg m-3).The elemental analysis found that OA was more aged in summer(oxygen-to-carbon(O/C)ratios were 0.41 and 0.32 for summer and autumn, respectively).Positive matrix factorization(PMF)analysis identified three and five components in summer and autumn,respectively.In summer,an oxygenated OA(OOA),a cooking-em ission-related OA(COA),and a hydrocarbon-like OA(HOA) were indentified.Meanwhile,the OOA was separated into LV-OOA(low-volatility OOA)and SV-OOA(sem i-volatile OOA); and in autumn,a nitrogen-containing OA(NOA)was also found.The SOA(secondary OA)was always the most important OA component,accounting for 55%of the OA in the two seasons.Back trajectory clustering analysis found that the origin of the air masses was more complex in summer.Southerly air masses in both seasons were associated w ith the highest OA loading,while northerly air masses were associated w ith the lowest OA loading.A preliminary study of OA components, especially the POA(primary OA),in differentperiods found that the HOA and COA all decreased during the National Day holiday period,and HOA decreased atweekends compared w ith weekdays.
organic aerosol,aerosolmass spectrometer,positive matrix factorization,seasonaldifference
1.Introduction
Organic aerosol(OA)is a primary contributorof fine particle pollution,constituting 20%–90%of the subm icron particulate mass(Zhang et al.,2007).Meanwhile,OA greatly impacts the radiative budget of the Earth’s atmosphere,in addition to reducing visibility,and harming human health (A lam et al.,2011).Therefore,a thorough understanding of the OA characteristics,sources,and the processes it undergoes in the atmosphere are very important for addressing aerosol-related pollution issues,and for the improvementof the predictive capability of air quality and climate models (Zhang etal.,2011).
Most previous aerosol studies have been based on fi lter sampling,followed by laboratory analysis.However, these methods usually have a lower resolution and cannot capture the dynam ic changes of aerosol chem ical composition and size distributions that occur over faster timescales than the sampling interval(Ulbrich et al.,2012).Over the pastdecade,high-resolution time-of-fl ightaerosolmass spectrometer(HR-ToF-AMS)instruments,particularly the commercial instruments made by Aerodyne Research Inc.,have been w idely used to study fine particulate matter.This has allowed detailed investigation of aerosol sources and processes.
Beijing,the politicaland culturalcenterof China,has developed rapidly in recent years:it is now one of the top ten polluted cities in the world(Yu et al.,2011).As expected, w ith the fast grow th of the population and the number of motor vehicles,the air quality in Beijing has severely deteriorated.Fine particles are a top pollutant.OA in Beijing accounts for 30%–50%of the total particulate mass of PM1(particulate matter w ith an aerodynamic diameter<1µm) (He etal.,2006),and therefore makes a strong contribution to the air pollution.Only a small number of reports have focused on OA in subm icron particles in Beijing,measured by AMS.Sun et al.(2010)fi rst used a quadrupole-based aerosolmass spectrometer(Q-AMS)to study non-refractory submicron particles(NR-PM1)in Beijing in summer 2006.Three OA components were determ ined:hydrocarbon-like OA(HOA),and two oxygenated OA(OOA)components. Huang et al.(2010)fi rst deployed a HR-ToF-AMS in Beijing and measured the chem ical composition and size distribution of the detected subm icron particles.The OAs were divided into two oxygenated organic aerosol types(OOA-1 and OOA-2),hydrocarbon-like(HOA),and cooking-related (COA).In January 2013,Beijing experienced several serious haze events,and during this time Zhang et al.(2014) deployed an Aerodyne HR-ToF-AMS to measure the NRPM1,and elucidated several factors for the pollution events based on the measurement results.Sun et al.(2013)found that aerosol composition,processes and sources vary between summer and w inter,caused by seasonally dependent meteorology and source em issions.Therefore,know ledge of the seasonal variation of OA is relevant to effectively reduce airpollution in Beijing.However,there remains no high resolution autumn OA data,and seasonal differences have rarely been reported in Beijing(Sun etal.,2013; Zhang etal.,2013).
To achieve an in-depth understanding of OA in summer and autumn,and to analyze OA chemical characteristics,processes and sources,a high-resolution time-of-fl ight aerosol mass spectrometer(HR-ToF-AMS,Aerodyne Research Inc.,USA)was deployed in Beijing in August and October 2012.The instrument was used to determ ine and compare the concentrations,size distributions,and extentof oxidation of the OA in summer and autumn.Additionally, the OA components were determined by positive matrix factorization(PMF)analysis of the high-resolution AMS data (PMF-AMS).Finally,the effects ofairmass transportand human activities on the OA loading and OA components were analyzed.We mustnote that the AMS measurement results includes OA and other inorganic species(nitrate,sulfate,ammonium and chloride).In this study,we only focused on the OA and other inorganic species were only used to compare w ith the PMF results.
2.M ethods and materials
2.1.Sampling site description
The HR-ToF-AMS was placed in the location used by Zhang etal.(2014),at the Institute of Atmospheric Physics (IAP),Chinese Academy of Sciences(CAS),in August(1 to 31 August)and October(1 to 31 October)2012,to measure in real-time the size distributions and chem ical compositions of ambient OA(Fig.S1).Meteorologicalparameters including temperature,hum idity,and w ind speed and direction were recorded by an automatic meteorologicalobservation instrument(M ilos520,Vaisala,Finland).Concentrations of NO and NO2as combined NOxwere measured using a chem ilum inescence analyzer(Model 42i,Thermo-Fisher Scientific, USA).Data were collected every 5 m inutes.Ambientair for AMS observation sampled 15 m above ground,while meteorological parameters and NOxwere sampled 8 m above ground.
2.2.HR-ToF-AMS operation
Full details of the HR-ToF-AMS instrument were published by DeCarlo et al.(2006).The operation of the HRToF-AMS during the campaign followed thatof Zhang etal. (2014).The V-and W-ion opticalmodes were alternated every 7.5 m inutes.In V-mode operation,the HR-ToF-AMS cycled through the mass spectrum(MS)and the particle timeof-fl ight(PToF)modes every 45 s,spending 22.5 s in open and closed status under MS mode,respectively.The size distribution data are reported in terms of particle vacuum–aerodynamic diameter.At the beginning,m iddle and end of the two seasonalstudy periods,the ionization efficiency(IE), inlet fl ow,and particle sizing were calibrated follow ing standard protocols(Jimenez etal.,2003;Drewnick etal.,2005). The 7.5 m inutes OA detection lim it(DL)was determ ined to be 0.056µg m-3,three times the standard deviation of the signal in particle-free air.
2.3.HR-ToF-AMS data analysis
The analysis of the HR-ToF-AMS data was based on the standard analysis software packages SQUIRREL,version 1.50,and PIKA,version 1.09.A collection efficiency(CE) factorof0.5 was used in this study.A detailed discussion on the choice of the CE is presented in supporting information (Part 1,Figs.S2 and S3).The relative ionization efficiency (RIE)value of organics used in this study was 1.4(Canagaratna etal.,2007).
PMF analyses were performed on the HR-MS data using the PMF Evaluation Toolkit(PET),version v2.05(Paatero and Tapper,1994;Ulbrich etal.,2009).Data and errormatrices were fi rst generated in PIKA.Further information about the PMF analysis can be found in other related publications (e.g.,Paatero and Tapper,1994;Paatero and Hopke,2003; Ulbrich etal.,2009;Huang etal.,2010;Zhang etal.,2014).
The PMF analyses in the two study seasons were performed for1 to 8 factors.A detailed discussion of the optimal solutions choice is detailed in supporting information(Part2, Fig.S4).The 3 factor and the 5 factor were chosen as the optimalsolutions in summerand autumn,respectively.
3.Results and discussion
3.1.Mass concentrations and temporal variations of OA
Figures S5 and S6 present the meteorological factorsduring the two seasons as hourly averaged values.The average ambient temperature and relative hum idity in summer were 27◦C±3.8◦C and 61%±18%,respectively.W ind speed varied from 0.0 to 3.5 m s-1,w ith an average of 0.9±0.7 m s-1.As expected,the average ambient temperature and relative humidity were both decreased in autumn:they were 14◦C±4.7◦C and 52%±20%,respectively.Meanwhile,the w ind speed had a broader range,from 0.0 to 8.0 m s-1,w ith a higher average of 1.2±1.2 m s-1.
The OA mass concentration time series had very differentcharacteristics in summerand autumn.Itwas more stable in summer,w ith an OA mass concentration lower than 50µg m-3.The OA mass concentration varied greatly in autumn,often exceeding 100µg m-3(Fig.1),w ith a broad range from 1.1 to 173µg m-3.The summer distribution had a range ofwas 0.96 to 46µg m-3.The mean mass concentrations of OA in summerand autumn were 13±6.9µg m-3and 30±30µg m-3,respectively.The summer value was much lower than thatmeasured in Beijing in 2006(28.1µg m-3) by Sun etal.(2010),and in 2008(23.9µg m-3)by Huang et al.(2010).However,itwas higher than the summer results of Huang et al.(2012)in Shanghai.The PM1mean mass concentration measured by Huang etal.(2012)was29.2µg m-3, and the OA mass concentration was 8.4µg m-3.In addition, our summer OA value was also higher than those measured in other cities during the same season;e.g.6.6µg m-3in Zurich,6.3µg m-3in New York,and 2.2µg m-3in Pairs (Lanz etal.,2007;Sun etal.,2011;Crippa etal.,2013,respectively).The difference in the mean mass concentration of OA between Beijing and other major cities in China in autumn was also significant.The OA loading was only 18 µg m-3in the Hong Kong-Shenzhen metropolitan area(He et al.,2011).These observations suggest that although the summer OA in Beijing has decreased significantly in recent years,it is stillata higher level compared w ith Shanghaior other foreign cities as we mentioned above.OA pollution in autumn remains elevated in Beijing.
The mean diurnal variations of OA during both seasons are presented in Fig.2a.The OA were characterized by two peaks,which occurred ataround noon(1100–1300 LST) and in the evening(1800–2300 LST).Such diurnalvariations have often been observed in AMS measurements(Huang et al.,2010;Sun et al.,2011;Huang et al.,2012).However, measurements made in Pittsburgh by Zhang et al.(2005a) had a fi rstpeak corresponding to the morning rush hour during 0700-0900 LST which reflects the importance of traffic em issions(Zhang et al.,2005a).The concentration difference between the two peaks was much larger in autumn(35 µg m-3)than in summer(6µg m-3).A smaller difference in summerwas also observed in Shanghai(Huang etal.,2012). Meanwhile,the large difference in autumn wasalso measured in Shenzhen(He et al.,2011).The large difference between the two peaks appearing in autumn is likely a resultof the significantly reduced nighttime m ixing layer height.This effect was weak in summer due to the higher ambient temperature throughout the day and night.This is illustrated in Figs.S5 and S6:the lowest temperature in summer was about 17◦C, while the lowest temperature in autumn was close to 0◦C.In addition,the mean temperature in summer was 13◦C higher than in autumn.The more detailed information about the difference ofm ixing layerheight in differentmonths in Beijing was discussed by He and Mao(2005)and You etal.(2010). The identification and discussion of different OA factors is presented in section 3.2.
Size distributions provide important information to understand aerosolsources,formation,and grow th mechanisms (Lan etal.,2011).Figure 2b presents the average size distributions of OA determ ined by the HR-ToF-AMS during the two seasons.A lthough there was a large difference in OA concentrations,the OA allshowed very similarsize distributions.The peak for both distributions appeared at~600 nm, indicative of aged regional aerosols(Zhang et al.,2005b). Moreover,there was anothersmallerpeak at~200 nm,which may be attributed to“fresh”combustion em issions(Sun etal., 2011).A sim ilar phenomenon has been observed atother urban sites(Huang etal.,2011;Sun etal.,2010)and in chamber studies(Asa-Awuku etal.,2009).
The elemental composition is one of the most important physicochem ical properties of OA.It can influence the density,hygroscopicity,and vapor pressure of the OA(Pang et al.,2006).The oxygen-to-carbon(O/C)atom ic ratio is a good parameter for measuring the extent of oxidation of OA(Jimenez etal.,2009).In addition,the organic-mass-toorganic-carbon(OM/OC)mass ratio was used as a conversion factor,follow ing the form of traditional fi lter-based aerosol chem istry studies.In summer,the mean value of the O/C and OM/OC mass ratios were 0.41±0.10 and 1.70±0.13;and they decreased in autumn,to 0.32±0.11 and 1.59±0.20,respectively.This difference indicates that the OA in summer was more aged than thatin the autumn.This may result from higher temperatures and solar radiation during the summer months,which can enhance the OA aging and the increase of O/C ratio.

Fig.1.Time series of the mass concentration of OA in summer and autumn.
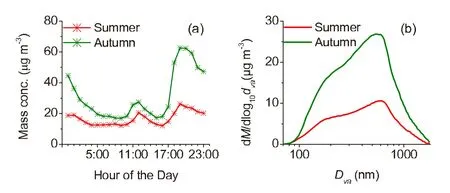
Fig.2.The(a)diurnal cycle and(b)size distribution of OA during summer and autumn.
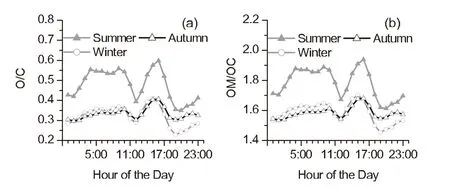
Fig.3.The diurnal cycles of the O/C(molar ratio)and OM/OC(mass ratio)in differentseasons.
As shown in Fig.3,the O/C and OM/OC mass ratios had high values in the afternoon(1500–1600 LST)and low values in the evening(after1900 LST).This is because photochem ical reactions were mostactive in the afternoon,leading to the production of SOA w ith high O/C ratios.However,the m inimum values of O/C and OM/OC occurred at 1200 LST and 1900 LST corresponding to the lunch time and evening meal and rush hours in Beijing.These findings reflect the fact that catering activities are an important factor affecting the oxidization of OA in Beijing.Ratios measured during w inter campaigns by Zhang et al.(2014)were added to Fig.3 for better comparison.Although the diurnal variation was similar during the differentseasons,the ratios were significantly higher in summer than during autumn and w inter.
3.2.Investigating OA components/sources with PMF
The PMF analysis identified three organic components present in the summer:oxygenated OA(OOA),cookingrelated OA(COA),and hydrocarbon-like OA(HOA);and five present in the autumn:low-volatility oxygenated(LVOOA)and sem i-volatile oxygenated(SV-OOA),nitrogencontaining OA(NOA),COA,and HOA.Figures 4 to 7 show the MS profi lesofevery componentand the time seriesof the OA factors and their relevantspecies in summerand autumn.
Generally,LV-OOA and SV-OOA were dominated by SOA.They had different O/C ratios and volatilities:LVOOA,more oxidized and aged,has a higher O/C ratios, whereas SV-OOA,often less oxidized and fresher,has a lower O/C ratio(Jimenez et al.,2009).The MS of both OOA components were dom inated by abundantfragments,especially by CO+2(m/z44),suggesting that oxidized organic compounds were present in large amounts (Figs.4a,6a and b).SV-OOA displayed a higherm/z43 value(mainly C2H3O+)than LV-OOA(Sun et al.,2011). However,the OOA could not be divided into LV-OOA and SV-OOA in summer in Beijing(Fig.4a).The MS of OOA in summerwas very close to the LV-OOA in autumn,w ith O/C ratios even higher than the LV-OOA(0.87 for OOA and 0.81 for LV-OOA).
The time series of OOA in summer and LV-OOA in autumn showed sim ilar trends to thatof sulfate(R2=0.77 and 0.86,Figs.5a and 7a).However,the correlation of SV-OOA in autumn w ith nitrate(R2=0.35)was notas strong as that w ith other components,because nitrate can be generated not only through photochem ical oxidation in daytime but also through the reaction of H2O in particles and the decomposition of N2O5atnight.LV-OOA and OOA displayed sim ilar diurnalcycles,characterized by a gradualincrease in the daytime,w ith a maximum at noon.This reflects the dom inant contribution from photochemical production in the daytime (Fig.8a).The diurnal cycle of SV-OOA in autumn showed a lower value in the afternoon,likely due to higher ambient temperatures favoring the evaporation of sem i-volatilespecies,which counteracted the photochem icalproduction of SOA(Fig.8a).As the decrease of SV-OOA was accompanied by a gradual increase of LV-OOA,further oxidation of more volatile and less oxidized species(i.e.SV-OOA)to less volatile and highly oxidized species(i.e.LV-OOA)occurred.LV-OOA and SV-OOA in autumn comprised 34% and 21%of the OA,respectively(Fig.8b).Together,the OOAs accounted for 55%of the OA,sim ilar to the contribution of OOA in summer(55%).These contributions from OOA during thisstudy were consistentw ith previous findings in Barcelona(55%)(Mohretal.,2012)and in Beijing(58%) (Huang etal.,2010;Zhang etal.,2013).

Fig.4.The summermass spectra of the(a)OOA,(b)COA,and(c)HOA components.
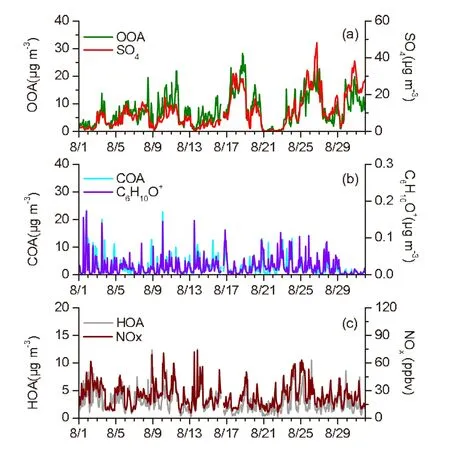
Fig.5.The time series of three OA components and other relevantspecies in summer.

Fig.6.The autumn mass spectra of the(a)LV-OOA,(b)SV-OOA,(c)NOA,(d)COA, and(e)HOA components.
The third factor in autumn was identified as NOA,which exhibited the highest N/C ratio(0.055).This componentaccounted for 9%of the totalorganic mass(Fig.8b).The highest nitrogen-containing fragments were atm/z27(CHN+),m/z29(CH3N+),m/z30(CH4N+),m/z41(C2H3N+)andm/z42(C2H4N+)(Fig.6c).This MS characteristic was very similar to that measured in the Po Valley(Saarikoski etal.,2012).A good correlation was reported between NOA and the N-containing C3H8N+ions(R2=0.57).Sim ilar OA component finding were also recorded in Mexico City(Aiken etal.,2009),w ith a N/C of0.06.The mass spectrum of NOA also closely resembled thatof OOA in our study.Sun etal. (2011)found that the NOA componentwas associated w ith atmospheric am ines.Meanwhile,Ge etal.(2011)performed a detailed review of the sources of atmospheric am ines,identifying many anthropogenic and natural sources.They foundthatbiomass burning was a primary source ofmany trace substances,and C1to C5(the number of C atom from 1 to 5) am ines were produced during the burning process.Meanwhile,biomass burning may also release some long-chain alkylamides.Accordingly,we found a prominent contribution of m/z(mass to charge)60 in the NOA MS in our study: a good tracer forbiomass burning(Aiken etal.,2009).Therefore,this OA component likely came from biomass burning. However,the NOA was only identified during the autumn sampling period,as biomass burning emissions occur after the harvest in autumn.In addition,given that amines are em itted from various industrialoperations,such as chem ical and leather manufacturing(Ge et al.,2011),the large industrial region to the south of Beijing could also have been an importantsource of NOA.

Fig.7.The time series of five OA components and other relevantspecies in autumn.
The COA was a common OA component in both summer and autumn.It was identified by a special spectrum and a unique diurnal pattern.The contribution ofm/z41 (mainly C3H+5)andm/z55(mainly C4H+7)in the COA MS were very,indicating a high percentage of unsaturated organic compounds(Figs.4b and 6d),very close to the MS measured forprimary Chinese cooking emissionsby He etal. (2010).As shown in Figs.5b and 7d,a good correlation was observed between the COA and the fragments of C6H10O+, the main component of the COA MS:the correlation coefficientsR2were 0.70 and 0.78 in summer and autumn,respectively(Sun etal.,2011).A clear and unique diurnal pattern of COA was observed,w ith two peaks at noon and in the evening,corresponding to the lunch and evening meal times of the local residents(Fig.8a).However,the evening peak was much higher than the noon peak in autumn,consistent w ith the total OA trend.This indicates that the COA is an important OA component that determines the diurnal variation ofOA.In addition,itwas interesting to find a smallpeak corresponding to breakfast time on autumn mornings.This phenomenon was also observed by Sun et al.(2013).How-ever,it did notappear in summer.Perhaps residents choose not to cook breakfast in the summer due to the hotweather. The COA was a very stable OA component in both seasons, w ith sim ilar contributions to total OA(23%and 26%).This proportion is the same as other results in Beijing,such as 24% in summer and 23%in w inter(Huang etal.,2010;Zhang et al.,2014).However,this component was not identified in Shanghai or Shenzhen(He et al.,2011;Huang etal.,2012). Rationalmanagementof the culinary industry is very important for reducing the OA concentration in Beijing.This could include encouraging residents to use simple soot fi lterequipment,and for restaurants to use fuelw ith improved combustion efficiency.
The HOA component was mainly attributed to primary combustion sources,which displayed high signals of the ion seriesfrom alkenes plus cycloalkanes (Ng etal.,2010).This is very similar to previously reported reference spectra of POA(primary OA)emitted due to combustion of gasoline and diesel(Schneider et al.,2006).This component was also identified during both summer and autumn campaigns,both having an H/C ratio of 1.66,and similar O/C ratios(0.14 and 0.18,respectively).The O/C value was consistentw ith the results in Beijing 2008(0.17;Huang et al.,2010)and Mexico City(0.18;Aiken et al.,2009).In addition,HOA correlated wellw ith combustion tracers,such as NOx(R2=0.62 and 0.55;Figs.5c and 7e).HOA accounted for 22%and 10%of the total OA mass in summer and autumn(Fig.8b).The diurnal patterns of HOA during the two seasons were similar,w ith a prominent peak in the morning around rush hour,and a second higher peak appearing atnight(Fig.8a).This diurnal cycle was consistentw ith the number of heavy duty and diesel trucks in Beijing(Han etal.,2009).According to traffic regulations,these kinds of vehicles are only allowed inside the city between 22:00 and 06:00.A fter comparing this period w ith the diurnal cycle of HOA,we found that the highestvalue of this OA factor was more likely driven by the em issions from these kinds of vehicles(Sun etal.,2013).This finding was consistentw ith the Beijing 2008 results of Huang etal.(2010)and w ith those of otherurban locations,such as the Po Valley(Saarikoskietal., 2012)and Barcelona(Mohr etal.,2012).These findings together indicate that HOA is likely a surrogate for combustion POA.
3.3.Back trajectory clustering analysis
The Hybrid Single-Particle Lagrangian Integrated Trajectory(HYSPLIT)model was used to analyze the effectof air mass transport on the OA loading and components in Beijing.The analysis steps were similar to those in Huang et al.(2010).First,48-h back trajectories,starting at 500 m above ground levelin Beijing(39.97◦N,116.37◦E),were calculated every 6 h(at 0000,0600,1200 and 1800 LST)during the two seasons.The back trajectories(BTs)were then clustered according to their similarity in spatial distribution using HYSPLIT4 software(Draxleretal.,2009).As a result, a four-cluster and a three-cluster solution were suggested as the optimum clustering solution forsummerand autumn(Fig. 9).
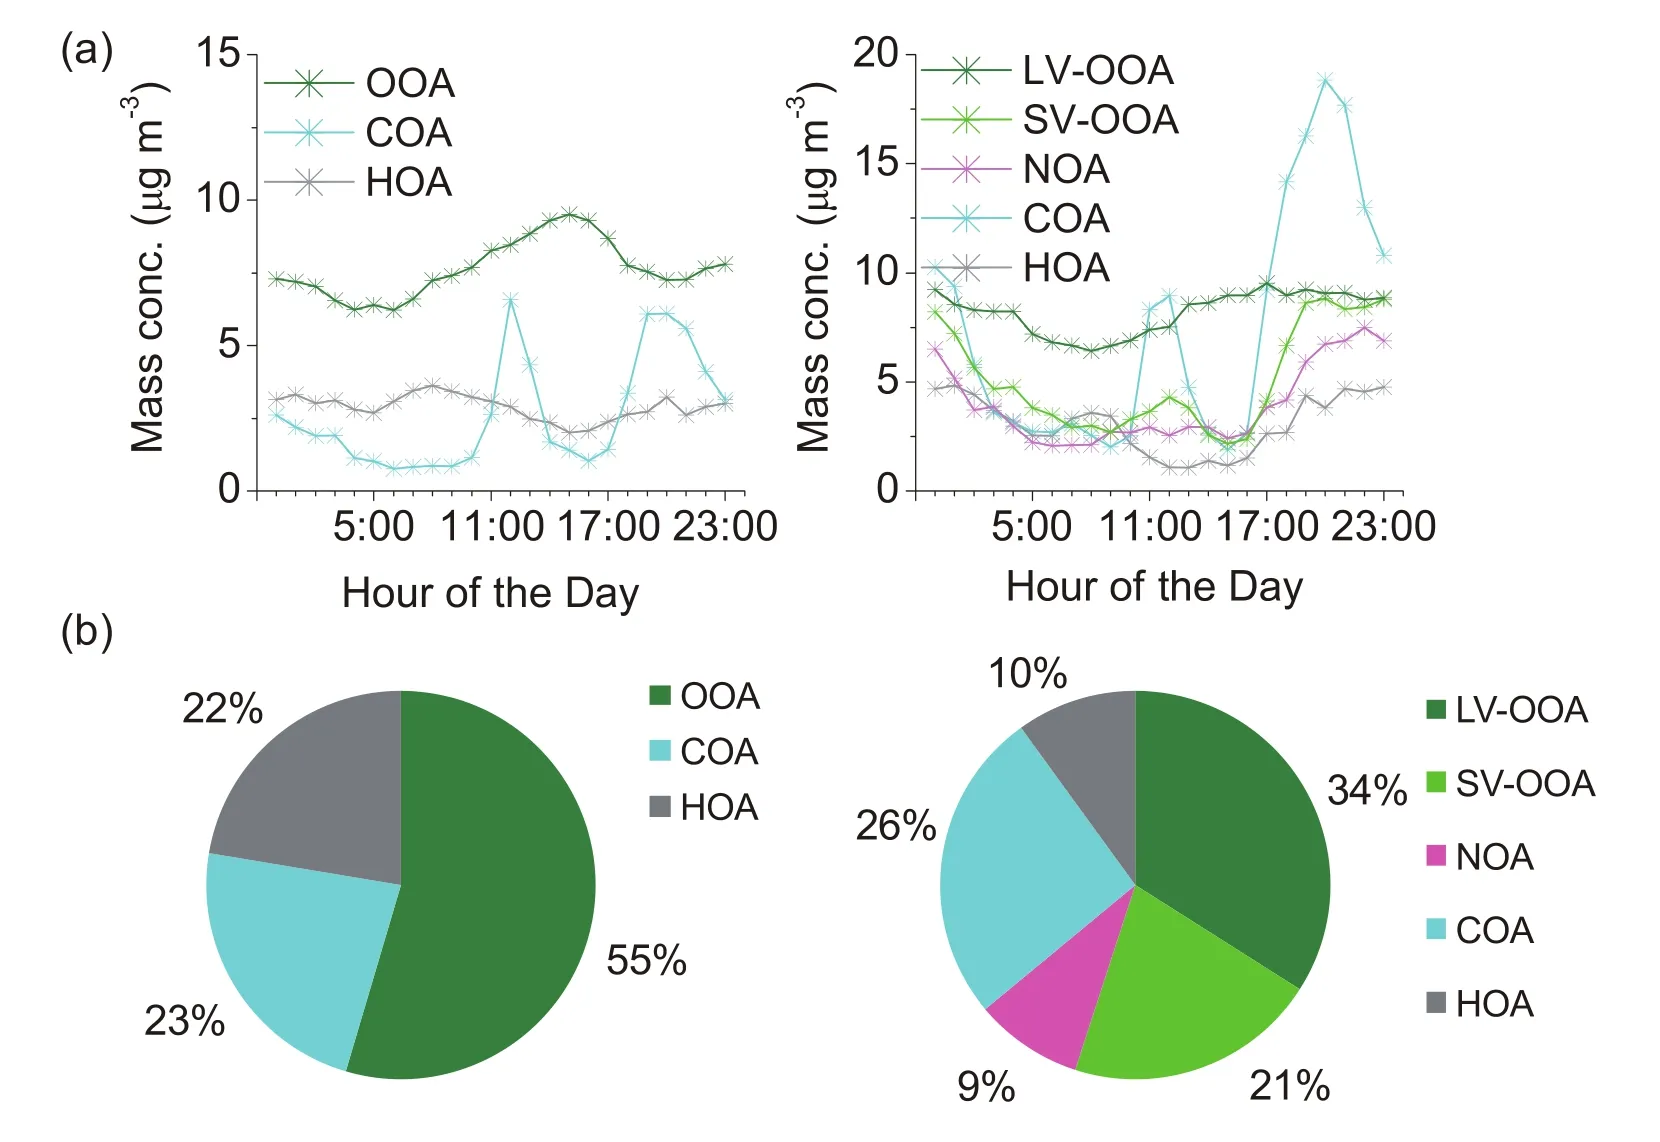
Fig.8.(a)Diurnalvariations of the OA components and(b)the average OA compositions in summer and autumn as pie charts.
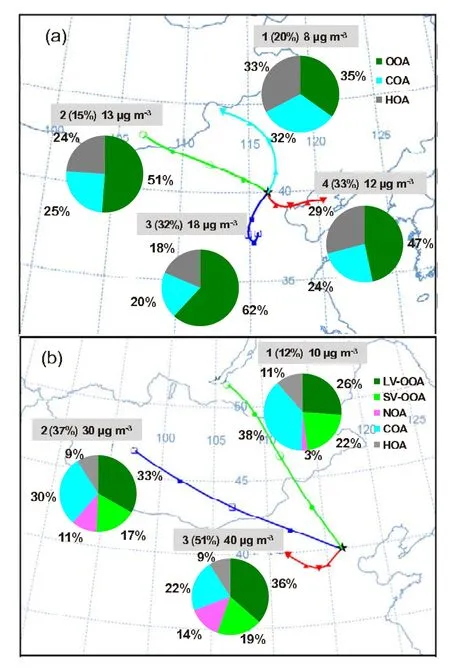
Fig.9.Back trajectory groups,and the corresponding mean OA compositions as pie charts,during(a)summerand(b)autumn.
There was a significant difference in the BTs in summer and autumn.Almost all air masses in autumn came from western China.The origin of the air masses,however,was more complex in summer,and they were uniform ly distributed around Beijing.The most frequently observed airmass was the fourth cluster in summer(ata frequency of 33%),which originated in the Bohai Sea region eastof Beijing,and passed Tianjin,a large industrial city in northern China,before arriving.The highest OA loading appeared in the third cluster,which originated in Shandong Province and passed over Hebei province,and the cities of Jinan, Liaocheng,and Hengshui.Therefore,the air masses in this cluster could have carried pollutants from these cities,aggravating the pollution in Beijing.However,the most frequently observed air mass in autumn was the third cluster(at a frequency of 51%),which originated from the westand moved southeast at the start of the 12 hour period,after which it turned northeast and finally reached Beijing.This air mass passed over Shanxi and Hebei provinces,the largest coalproducing and consuming provinces in China,respectively. Unsurprisingly,the highestOA loading(40µg m-3)was observed in this cluster.The lowest OA loadings in the two seasons were sim ilar and allobserved in air masses originating north of Beijing;the corresponding concentrations were 8 and 10µg m-3in summerand autumn,respectively.
The contribution of each OA componentwas different in each cluster.The OA in the fi rst clean cluster in both seasons was composed of the highest fraction of POA,such as HOA and COA.Their total contributions were 65%and 49% in summer and autumn,respectively,indicating a signifi cant contribution of primary emissions in and around the vicinity of Beijing to aerosol pollution.The OA in the highest OA loading clusters(the third cluster 3 of both seasons)had the highest fractions of secondary aerosol.The contributions of OOA were 62%and 55%in summer and autumn,respectively.The heavy pollution cluster was associated w ith the geographical featuresofurban Beijing:generally flatand surrounded by mountains on allsides except the south.
As can be seen from the above analysis,the high OA concentration was associated w ith southerly air masses containing secondary regional pollutants;in contrast,the contribution of local,primary aerosolemissions were more important in northerly airmasses,and the OA loading was much lower than that in the southerly airmasses.
3.4.OA component variations in different periods
The observation in autumn not only included weekdays and weekends butalso one of the most important festivals in China,the National Day of China,on 1 October.People’s routines are different among these three periods,resulting in significant OA source changes.Therefore,studying the OA component changes during these three periods can reveal the effectof human activities on the ambient OA.Most residents’weekday activities follow a go-to-work–go-home pattern.Mostoffice workers have no need to attend atweekends,so the rush disappears.During the NationalDay period, people have a 7 day holiday(from 1 to 7 October).Many residents leave Beijing,while many people come from elsewhere to visit the city.
The diurnal variations of SV-OOA and COA were similar during these three periods(Figs.10b and d).The two COA peaks were lower during the National Day holiday period than on weekdays and weekends,because the OA emissions from family dining events were significantly reduced (mostBeijing residentswere traveling to other locations,even though a large number of tourists from other locations traveled to Beijing).This difference can be explained as follows:there are no primary fi ltering measures used in traditional family home cooking,whereas most large restaurants, where tourists dine,have installed advanced fi ltration equipment.Therefore,the em issions and the contribution of COA to the OA total during the National Day holiday period decreased(Fig.10d).The diurnal variations of the other three OA componentswere differentamong the three periods(Figs. 10a,c and e).The greatestdifference was observed forHOA, which presented a prominentpeak in the morning around rush hour.Meanwhile,the weekday HOA morning peak was significantly higher than on weekends and the NationalDay holiday period.This appears consistentwith the reduced morning rush hour on weekends and the holiday.In addition,the contribution of HOA to OA on weekdays was significantly higher than during the other two periods(Fig.10f).This is consistent w ith the resultmeasured by Rattigan etal.(2010) in New York.They found that the directem issions from fossil fuel combustion were lower atweekends(approximately 27%and 38%lower on Saturday and Sunday,respectively) than on weekdays.
From the above analysis,it is clear that the primary or-
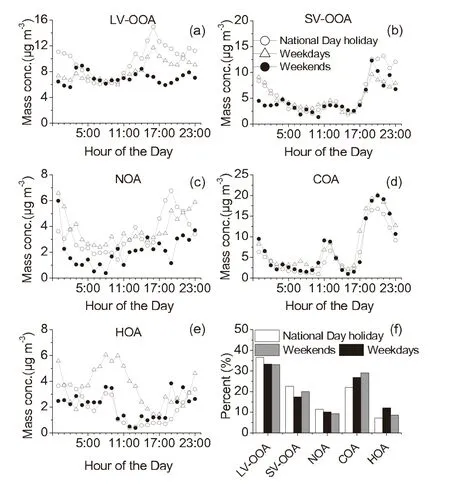
Fig.10.The(a–e)diurnal variations and(f)percentage contributions of the different OA components on NationalDay holiday,weekdays and weekends.
ganic aerosols,HOA and COA,decreased during the National Day holiday period,and HOA decreased at the weekends compared w ith weekdays.Itshould be noted thatwe do notdiscuss the other three OA components in detailbecause the formation processesof these componentsare complicated and determ ined notonly by the primary em ission sources,but also by atmospheric conditions,such as anthropogenic influences,sunlight,atmospheric oxidation and regional transport. Therefore,this section is intended as a prelim inary study on the effectof human activities on the POA component.Furtherand more in-depth studies,especially the effecton SOA, w ill require more observations and meteorologicaldata.
4.Conclusions
Size-resolved OA was measuredin situusing an HRToF-AMS during Augustand October 2012 in Beijing.The mean mass concentrations of OA in summer and autumn were 13±6.9µg m-3and 30±30µg m-3,respectively.The OA showed a very different trend in the two seasons,which was more stable in summer than autumn.The average OA size distribution in the two seasonswassimilarand spanned a broad range,w ith the appearance of the highestpeak at~600 nm and another small peak at~200 nm.The diurnal variations of OA displayed two broad peaks,one at noon and the other in the evening,mainly affected by the COA component.Meanwhile,the concentration difference of the two peaks was higher in autumn,possibly caused by differences in meteorological factors.The elementalanalysis found that the ratios of O/C and OM/OC were all higher in summer. Therefore,the OA was more aged in the warmerseason.PMF analysis indicated three and five OA components for summerand autumn,and that the OOA accounted forabout55% of the totalOA.Back trajectory clustering analysis indicated that the southerly air mass was associated w ith the highest OA loading,and was rich in oxidized organic species.How-ever,OA in northern airmasses contained a large fraction of primary HOA and COA species.There was a significanteffect of human activities on the OA components,especially during the long National Day holiday,when the COA and HOA levels obviously decreased.
Acknow ledgements.This study was supported by the“Strategic Priority Research Program”of the Chinese Academy of Sciences(GrantNo.XDA05100100&XDB05020000)and the National Natural Science Foundation of China(Grant Nos.41230642& 41275139).
Electronic Supplementary Material:Supplementary material [(1)the location of the monitoring site;(2)the discussions about choosing the CE value and PMF solution;(3)the time series ofmeteorological factors in summer and autumn)]is available online at http://dx.doi.org/10.1007/s00376-014-4153-9.
REFERENCES
Aiken,A.C.,and Coauthors,2009:Mexico City aerosolanalysis during M ILAGRO using high resolution aerosol mass spectrometry at the urban supersite(T0)—Part 1:Fine particle composition and organic source apportionment.Atmospheric Chemistry and Physics,9,6633–6653.
Alam,K.,T.Trautmann,and T.Blaschke,2011:Aerosol optical properties and radiative forcing over mega-city Karachi.Atmospheric Research,101,773–782.
Asa-Awuku,A.,M.A.M iracolo,J.H.Kroll,A.L.Robinson,and N.M.Donahue,2009:M ixing and phase partitioning of primary and secondary organic aerosols.Geophys.Res.Lett.,36, L15827,doi:10.1029/2009GL039301.
Canagaratna,M.R.,and Coauthors,2007:Chem ical and m icrophysical characterization of ambient aerosols w ith the aerodyne aerosolmass spectrometer.Mass Spectrometry Reviews, 26,185–222.
Crippa,M.,and Coauthors,2013:Identification ofmarine and continentalaerosolsources in Paris using high resolution aerosol mass spectrometry.J.Geophys.Res.:Atmos.,118,1950–1963,10.1002/jgrd.50151.
DeCarlo,P.F.,and Coauthors,2006:Field-deployable,highresolution,time-of-fl ightaerosolmass spectrometer.Analytical Chemistry,78,8281–8289.
Draxler,R.,B.Stunder,G.Rolph,A.Stein,and A.Taylor,2009:HYSPLIT4 user’s guide.Version 4.9,NOAA Air Resour.Lab.,Silver Spring,Md.[Available online at http://ready.arl.noaa.gov/HYSPLIT.php.]
Drewnick,F.,and Coauthors,2005:A new Time-of-FlightAerosol Mass Spectrometer(TOF-AMS)-instrument description and fi rst field deployment.Aerosol Science and Technology,39, 637–658.
Ge,X.L.,A.S.Wexler,and S.L.Clegg,2011:Atmospheric amines—Part I.A review.Atmos.Environ.,45,524–546.
Han,S.,and Coauthors,2009:Temporal variations of elemental carbon in Beijing.J.Geophys.Res.,114,D23202,doi: 10.21029/22009JD012027.
He,L.Y.,X.F.Huang,L.Xue,M.Hu,Y.Lin,J.Zheng,R. Zhang,and Y.H.Zhang,2011:Submicron aerosol analysis and organic source apportionment in an urban atmosphere in Pearl River Delta of China using high-resolution aerosol mass spectrometry.J.Geophys.Res.,116,D12304, doi:10.1029/2010JD014566.
He,L.Y.,M.Hu,X.F.Huang,Y.H.Zhang,and X.Y.Tang,2006: Seasonal pollution characteristics of organic compounds in atmospheric fine particles in Beijing.The Science of the Total Environment,359,167–176.
He,L.Y.,and Coauthors,2010:Characterization of highresolution aerosol mass spectra of primary organic aerosol em issions from Chinese cooking and biomass burning.Atmospheric Chemistry and Physics,10,11535–11543.
He,Q.S.,and J.T.Mao,2005:Observation ofurban m ixed layerat Beijing using a m icro pulse lidar.Acta Meteorologica Sinica, 63,374–384.(in Chinese)
Huang,X.F.,and Coauthors,2011:Characterization of subm icron aerosols ata ruralsite in Pearl River Delta of China using an Aerodyne High-Resolution Aerosol Mass Spectrometer.Atmospheric Chemistry and Physics,11,1865–1877.
Huang,X.F.,and Coauthors,2010:Highly time-resolved chemical characterization of atmospheric submicron particles during 2008 Beijing Olympic Games using an Aerodyne High-Resolution Aerosol Mass Spectrometer.Atmospheric Chemistry and Physics,10,8933–8945.
Huang,X.F.,L.Y.He,L.Xue,T.L.Sun,L.W.Zeng,Z.H. Gong,M.Hu,and T.Zhu,2012:Highly time-resolved chemicalcharacterization ofatmospheric fine particlesduring 2010 Shanghai World Expo.Atmospheric Chemistry and Physics, 12,4897–4907.
Jimenez,J.L.,and Coauthors,2003:Ambient aerosol sampling using the Aerodyne Aerosol Mass Spectrometer.J.Geophys. Res.:Atmos.,108,8425,doi:10.1029/2001JD001213.
Jimenez,J.L.,and Coauthors,2009:Evolution oforganic aerosols in the atmosphere.Science,326,1525–1529.
Lanz,V.A.,M.R.A lfarra,U.Baltensperger,B.Buchmann,C. Hueglin,and A.S.H.Pr´evˆot,2007:Source apportionmentof subm icron organic aerosols atan urban site by factor analytical modelling of aerosol mass spectra.Atmospheric Chemistry and Physics,7,1503–1522.
Lan,Z.J.,D.L.Chen,X.Li,X.F.Huang,L.Y.He,Y.G. Deng,N.Feng,M.Hu,2011:Modal characteristics of carbonaceousaerosolsize distribution in an urban atmosphere of South China.Atmospheric Research,100,51–60.
Mohr,C.,and Coauthors,2012:Identification and quantification of organic aerosol from cooking and other sources in Barcelona using aerosolmass spectrometerdata.Atmospheric Chemistry and Physics,12,1649–1665.
Ng,N.L.,and Coauthors,2010:Organic aerosol components observed in Northern Hem ispheric datasets from Aerosol Mass Spectrometry.Atmospheric Chemistry and Physics,10,4625–4641.
Pang,Y.,B.J.Turpin,and L.A.Gundel,2006:On the importance oforganic oxygen forunderstanding organic aerosolparticles. Aerosol Science and Technology,40,128–133.
Paatero,P.,and U.Tapper,1994:Positive matrix factorization:A nonnegative factormodelw ith optimalutilization of errorestimates of data values.Environmetrics,5,111–126.
Paatero,P.,and P.K.Hopke,2003:Discarding or downweighting highnoise variables in factor analytic models.Analytica Chimica Acta,490,277–289.
Rattigan,O.V.,H.D.Felton,M.S.Bae,J.J.Schwab,and K. L.Demerjian,2010:Multi-year hourly PM2.5carbon measurements in New York:Dirunal,day of week and seasonal patterns.Atmos.Environ.,44,2043–2053.
Saarikoski,S.,and Coauthors,2012:Chemical characterization of springtime subm icrometer aerosol in Po Valley,Italy.Atmospheric Chemistry and Physics,12,8401–8421.
Schneider,J.,and Coauthors,2006:Mass spectrometric analysis and aerodynam ic properties of various types of combustionrelated aerosolparticles.International Journal of Mass Spectrometry,258,37–49.
Sun,J.,and Coauthors,2010:Highly time-and size-resolved characterization ofsubm icron aerosolparticles in Beijing using an Aerodyne AerosolMass Spectrometer.Atmospheric Environment,44,131–140.
Sun,Y.L.,and Coauthors,2011:Characterization of the sources and processes of organic and inorganic aerosols in New York city w ith a high-resolution time-of-fl ight aerosol mass apectrometer.Atmospheric Chemistry and Physics,11,1581–1602.
Sun,Y.L.,Z.F.Wang,P.Q.Fu,T.Yang,Q.Jiang,H.B.Dong, J.Li,and J.J.Jia,2013:Aerosol composition,sources and processes during w intertime in Beijing,China.Atmospheric Chemistry and Physics,13,4577–4592.
Ulbrich,I.M.,M.R.Canagaratna,Q.Zhang,D.R.Worsnop,and J.L.Jimenez,2009:Interpretation of organic components from positive matrix factorization of aerosol mass spectrometric data.Atmospheric Chemistry and Physics,9,2891–2918.
Ulbrich,I.M.,M.R.Canagaratna,M.J.Cubison,Q.Zhang,N.L. Ng,A.C.Aiken,and J.L.Jimenez,2012:Three-dimensional factorization of size-resolved organic aerosol mass spectra from Mexico City.Atmospheric Measurement Techniques,5, 195–224.
You,H.L.,W.D.Liu,and J.R.Tan,2010:Temporal characteristics of atmospheric maximum m ixing depth of Beijing. Meteorological Monthly,36,51–55.(in Chinese)
Yu,X.N.,B.Zhu,Y.Yin,J.Yang,Y.W.Li,and X.L.Bu,2011:A comparative analysis of aerosol properties in dust and hazefog days in a Chinese urban region.Atmospheric Research, 99,241–247.
Zhang,J.K.,Y.Sun,Z.R.Liu,D.S.Ji,B.Hu,Q.Liu,and Y.S. Wang,2014:Characterization of submicron aerosols during a month of serious pollution in Beijing,2013.Atmospheric Chemistry and Physics,14,2887–2903.
Zhang,Q.,M.R.Canagaratna,J.T.Jayne,D.R.Worsnop,and J. L.Jimenez,2005a:Time-and size-resolved chem ical composition of subm icron particles in Pittsburgh:Implications for aerosol sources and processes.J.Geophys.Res.,110, D07S09,doi:10.1029/2004JD004649.
Zhang,Q.,D.R.Worsnop,M.R.Canagaratna,and J.L.Jimenez, 2005b:Hydrocarbon-like and oxygenated organic aerosols in Pittsburgh:insights into sources and processes of organic aerosols.Atmospheric Chemistry and Physics,5,8421–8471.
Zhang,Q.,and Coauthors,2007:Ubiquity and dominance of oxygenated species in organic aerosols in anthropogenicallyinfluenced Northern Hem isphere m idlatitudes.Geophys.Res. Lett.,34,L13801,doi:10.1029/2007GL029979.
Zhang,Q.,J.L.Jimenez,M.R.Canagaratna,I.M.Ulbrich,N.L. Ng,D.R.Worsnop,and Y.L.Sun,2011:Understanding atmospheric organic aerosolsvia factoranalysisofaerosolmass spectrometry:A review.Analytical and Bioanalytical Chemistry,401,3045–3067.
Zhang,Y.M.,J.Y.Sun,X.Y.Zhang,X.J.Shen,T.T.Wang, and M.K.Qin,2013:Seasonal characterization of components and size distributions for subm icron aerosols in Beijing.Science in China:Earth Sciences,56(5),890–900,doi: 10.1007/s11430-012-4515-z.
:Zhang,J.K.,Y.S.Wang,X.J.Huang,Z.R.Liu,D.S.Ji,and Y.Sun,2015:Characterization of organic aerosols in Beijing using an aerodyne high-resolution aerosol mass spectrometer.Adv.Atmos.Sci.,32(6),877–888,
10.1007/s00376-014-4153-9.
(Received 10 July 2014;revised 18 October 2014;accepted 24 October2014)
∗Corresponding author:SUN Yang
Email:suny@mail.iap.ac.cn
©Institute of Atm ospheric Physics/Chinese Academ y of Sciences,and Science Press and Springer-Verlag Berlin Heidelberg 2015
杂志排行
Advances in Atmospheric Sciences的其它文章
- Dryland Expansion in Northern China from 1948 to 2008
- Numerical Simulations of Heavy Rainfallover Central Korea on 21 Sep tember 2010 Using the WRF M odel
- Precipitation Changes in Wetand Dry Seasons over the 20th Century Simulated by Two Versions of the FGOALS M odel
- Projections of the Advance in the Startof the Grow ing Season during the 21st Century Based on CM IP5 Simulations
- Deep Convective Clouds over the Northern Pacific and Their Relationship w ith Oceanic Cyclones
- A Diagnostic Analysis on the Effectof the Residual Layer in Convective Boundary Layer Development near M ongolia Using 20th Century Reanalysis Data
