Estimating the Turbulence Characteristics in the Bottom Boundary Layer of Monterey Canyon
2015-04-05YANGJinglingLIPeiliangandLIUCong
YANG Jingling, LI Peiliang,, and LIU Cong
College of Physical and Environmental Oceanography,Ocean University of China,Qingdao266100,P. R. China
Estimating the Turbulence Characteristics in the Bottom Boundary Layer of Monterey Canyon
YANG Jingling1), LI Peiliang1),*, and LIU Cong1)
College of Physical and Environmental Oceanography,Ocean University of China,Qingdao266100,P. R. China
From April 24 to October 25, 2011, an Acoustic Doppler Velocimeter (ADV) continually running for 185 d was mounted on the smooth ridge at the edge of Monterey Canyon to observe turbulence in the bottom boundary layer. The ADV was set at 1.4 m above the bed bottom, continuously run for 1 min with a 2-minute interval with sampling frequency 64 Hz. The long-time continual observation is significant to reveal variations of turbulent characteristics and show some differences from the classic traditional turbulent theory. Eliminating the noise by the ‘Phase-Space Thresholding Method’, rotating the coordinate and low-pass filtering the velocity were applied for data processing. This paper was mainly to estimate the turbulent kinetic energy dissipation rate by the inertial dissipation method, friction velocity, drag coefficient and significant periods of the turbulent characteristics with the ADV data. The results show that there is a strong, rotating bottom flow up to 0.398 m s-1with predominantly semidiurnal period and less significantly diurnal and semilunar period. The turbulent kinetic energy dissipation rate ranges from 1.09×10⁻⁸W kg-1to 6.62×10⁻⁵W kg-1, which can vary with 2 or 3 orders of magnitude in one day. The daily averaged variations of friction velocity and drag coefficient are 6.50×10⁻³-2.32×10⁻²m s-1and 6.30×10⁻³-4.36×10⁻², respectively. All the characteristics have a remarkable semidiurnal period. In the bottom boundary layer with a rotating tide, the parameterized coefficients to describeε-u*andε-Etrelationships are much smaller than the traditional value.
turbulence; dissipation rate; bottom boundary layer (BBL); MARS; ADV
1 Introduction
Generally, energy is degraded between different spatial scale movements in the ocean and dissipated in turbulent mixing process. Turbulence plays an important role in water structure, energy balance, sediments transportation, vertical mixing and other physical and biological activities in the bottom boundary layer (BBL) (Chansonet al., 2008; Orten and Visbeck, 2009; Rippethet al., 2002). And most turbulence takes place near the BBL in the ocean (Smyth and Moum, 2001). Turbulence refers to small scale activities with diverse and complicated structure, which could be observed using sensors with high resolution, stability and good calibration. Turbulence has been described using a few turbulent characteristics, such as fluctuation intensity (FI), drag coefficient (Cd), bottom shear stress (u*) and dissipation rate (ε), all of which are useful in turbulence study.Cdis used to explicate the bottom boundary conditions for circulation models and applied in engineering related to lakes, rivers and reservoirs (Lozovatskyet al., 2008).u*affects the circulation directly, and generates turbulence that diffuses into theflow (Doronet al., 2001). It is considered thatu*also controls the erosion and deposition of sediments at the bed (Kimet al., 2000). The dissipation rateεof the turbulent kinetic energy (Et) is a fundamental quantity of three dimensions in the characterization of turbulence (Liberzonet al., 2012), which is hard to measure directly. Rusello and Cowen (2011) revealed that ε is also involved in gradients at the smallest scales of motion. Hence, the knowledge of turbulence characteristics in the BBL could improve turbulent parameterization schemes, while the turbulent parameterization is a key issue to the highly accurate numerical model of energy dissipation and sediment suspension and transport.
Monterey canyon (MC) or Monterey submarine canyon (MSC) is the largest submarine canyon along the coast of North America. It follows a winding track for 75 km across the shelf and slopes to a depth of 3 km, where the canyon connects with Monterey fan valley (McHughet al., 1992). In MC, the bottom intensification of currents plays a significant part in raising the near-bottom shear stress (Xuet al., 2002). Petruncioet al.(1998) pointed out that Monterey bay co-oscillates originally with mixed, primarily semidiurnal tide currents and observed the internal tide in MC during the April shipboard experiment, and suggested that the estimated internal tidal energy dissipation rate varied between 1.3×10⁻⁴to 2.3×10⁻³W m-3per unit vol-ume according to the assumption about the influence of canyon shape. Based on microstructure measurements on MC continental shelf from August 8 to 22, 1997, Carteret al.(2005) revealed that the depth and time- averaged dissipation rate was 7.4×10⁻⁹-55.8×10⁻⁹W kg-1within 4 km of the shelf break. Kunzeet al.(2011) collected finestructure profiles during August 18 to 30, 2008 by a vertical microstructure profiler along the axis of MSC with depth up to 2000 m and showed that the averageεat the depth 200-300 m above the bottom (mab) was about 4×10⁻⁸W kg-1and stretched well into the stratified layer; furthermore, the strength, thickness and vertical distribution of ε near the bottom varied during a tidal period.
However, the turbulent mixing variations at a single site could range several orders of magnitude with long or intermittent cyclicity, and it is necessary to conduct longtime measurements of turbulence to better reveal the turbulence characteristic (Perlin and Moum, 2012). The ADV has an extended response frequency but a smaller sampling volume to weaken severe attenuation in vertical velocity variation (Kimet al., 2000) and it decreased the interference with flow by a remote sampling volume from the sensor (Carloset al., 2005). It also has been proved that the ADV could effectively and successfully measure high-frequency 3D velocity at a single point in the BBL for turbulence (Laneet al., 1998; Chansonet al., 2008; Lozovatskyet al., 2008). In April 24, 2011, the Chinese physical oceanography testing node was successfully connected to Monterey Accelerated Research System (MARS) observatory site at the depth of 891 m, and an Acoustic Doppler Velocimeter (ADV), an Acoustic Doppler Current Profiler and a Conductivity Temperature Depth System were deployed to measure physical oceanography data for about 185 d. In this work, we focus on estimating the turbulence characteristics in the BBL of MC using the long serial of ADV observations. The paper is organized as follows: Section 2 describes the observed data and the calculating methods; Section 3 gives the results and discussions; the conclusions are summarized in Section 4.
2 Data and Methods
An ‘upward-looking’ acoustic Doppler velocimeter was mounted at 1.4 mab in MC to observe the high-frequency velocity from April 24 to October 25, 2011. The observation station is located at 36°42.7481´N, 122°11.2139´W, on a smooth ridge at the edge of MC. The ADV was set to continuously measure for 1 min with sampling frequency 64 Hz, then rest for 2 min. The ADV recorded the velocity withu,vandw, representing the eastward, northward and vertical components, respectively.
Since ADV measurements can be contaminated by Doppler noise (Laneet al., 1998), which needs to be eliminated before further processing. Based on the collected data, the processing of every 1-min time serial was conducted as follows. First of all, use the ‘Phase-Space Thresholding Method’ (Goring and Nikora, 2002; Wahl, 2003) to eliminate noise. Secondly, the vertical velocity was not equal to zero, indicating that the reference system of the ADV was not parallel to the streamline, which could influence the estimation of the turbulent characteristics (Royet al., 1996). Considering theXaxis as streamwise, the rotation of velocity was applied by Eq. (1):

where

Unmeans the velocity after rotation,Uostands for the observed velocity,βindicates the horizontal deflection angle calculated by tanβ=v/u, andθindicates the vertical deflection angle calculated by tan. Lastly, low-pass filterUnand calculate the mean velocity (U), the current direction to east and fluctuations (u',v',w').
After the processing, the standardized statistic characteristics of fluctuations displaying typically turbulent behavior are showed in Fig.1. First-order fluctuations reveal quasi-normal distribution; second-order variance making contribution toEt, is positively skewed with high kurtosis; second-order covariance making contribution to the bottom shear stress is generally negatively skewed with high kurtosis. Kimet al.(2000) and Wuet al.(2011) described the similar characteristics in tidal BBL.
As Kimet al.(2000) showed,u*and TKE are estimated by Eqs. (2) and (3), respectively, when Reynolds NumberR≫1. In the BBL,Cdcan be estimated by Eq. (4).

The velocity energy spectrum consists of three subranges,i.e., the energy-containing sub-range, inertial subrange and dissipation sub-range. In the inertial sub-range,εcan be calculated by the inertial dissipation method (Lien and Eric, 2006; Liu and Wei, 2007; Lozovatskyet al., 2010). According to this famous ‘-5/3 theory’, in the isotropic turbulence,εis conducted with one dimensional spectrum (Kolmogorov, 1941):

wherei=1-3, one dimensional Kolmogorov constantα1= 0.53,α2=α3=4α1/3=0.71 (Sreenivasan, 1995),kis the wavenumber, and the bar indicates the mean value in the inertial sub-range. As the data were obtained at one point, it is necessary to change frequency spectra into wavenumber spectra, which is possible only if Taylor’s ‘frozen turbulence’ hypothesis is true.
By define the root-mean-square ofu',v' andw' as the fluctuation intensity (FI), the relative turbulent intensity is defined asFI/U. Fig.2 indicates that the vertical fluc-tuation is smaller than the horizontal ones, which means the turbulence is highly anisotropic here. Andw'rms/U〈〈1 satisfies Taylor’s ‘frozen turbulence’ hypothesis better. Stapleton and Huntley (1995) also showed that near the bottom vertical velocities were less contaminated by waves than horizontal velocities were, and vertical fluctuations were more likely to be caused by turbulence. Hence, in this thesis, we estimated ε with vertical fluctuations.
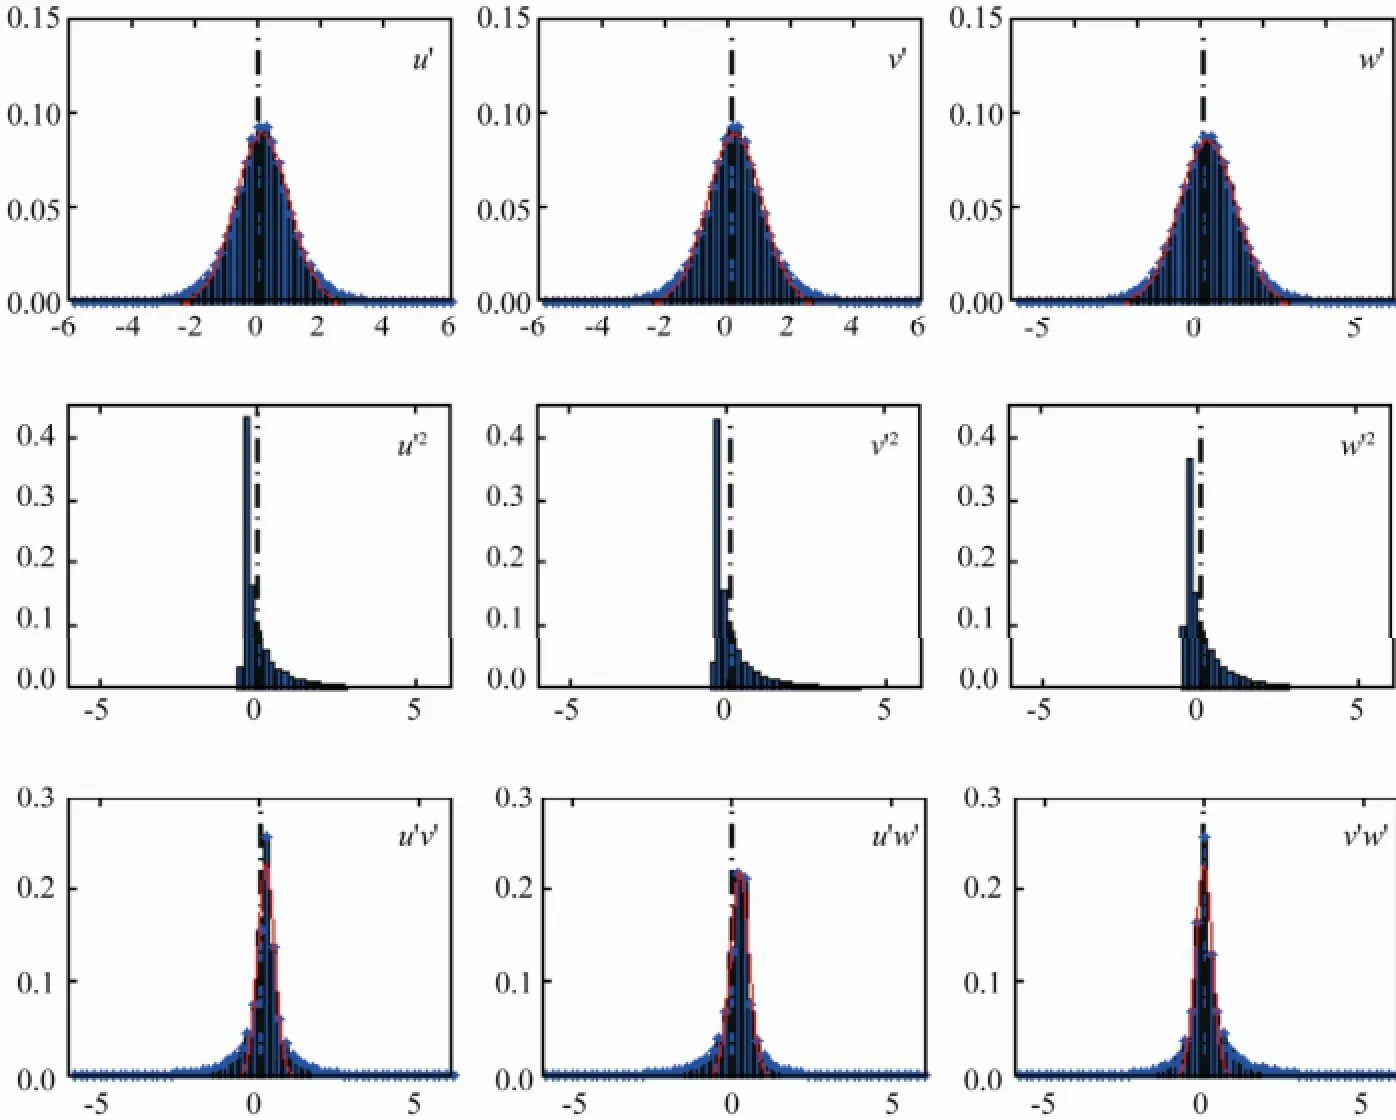
Fig.1 Distribution of fluctuations in velocity components and velocity moments. Horizontal axis represents, where parameters represent momentum, mean and standard deviation of momentum, respectively. Vertical axis represents the statistical probability.
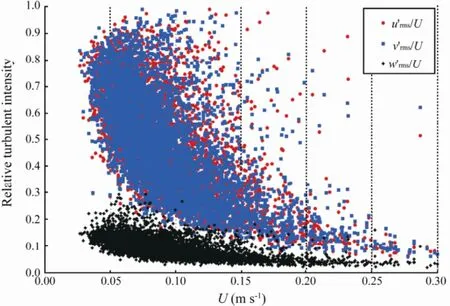
Fig.2 Mean velocity to relative turbulent intensity at 1.4 mab.
3 Results and Discussions
With time serials from May 4 to 8 as an example, the velocity under the terrestrial coordinate system, streamwise velocity and flow direction to east are displayed in Fig.3 with a 15-minute interval. In MC, the near-bottom eastern and northern components were of the same order; the maximum reached about 0.3 m s-1, which was an order of magnitude larger than the vertical velocity (〈0.04 m s-1). The horizontal components also showed more evident semidiurnal period fluctuation than the vertical component. The stream-wise magnitude was up to more than 0.3 m s-1, and the direction ranged from 0° to 360° during a cycle. This implies that there was a strong bottom flow, and the tidal current was rotating.
The variations of daily averaged eastern, northern and vertical component were -0.361-0.211 m s-1, -0.327- 0.224 m s-1and -0.037-0.052 m s-1, respectively. The near- bot-tom stream-wise velocity ranged from 0.015 m s-1to 0.398 m s-1(Figure not showed). The power spectra of 1-minute interval and 24-h interval stream-wise velocity are shown in Fig.4 with the longest continuous time serial from July 8 to August 19. In Fig.4a, the bottom velocity showed a significantly semidiurnal period and a less remarkably diurnal period, consistent with the previous research for this region (Xuet al., 2002). A semilunar period was also found in Fig.4b. Petruncioet al.(1998) found that the higher energy of internal tides took place near the spring phase of a 14.8 d cycle during his measurements in April, 1994.

Fig.3 Time serials of eastern (u), northern (v), vertical (w) components, horizontal stream-wise velocity (U) and flow direction with a 15-minute interval from May 4 to 8.
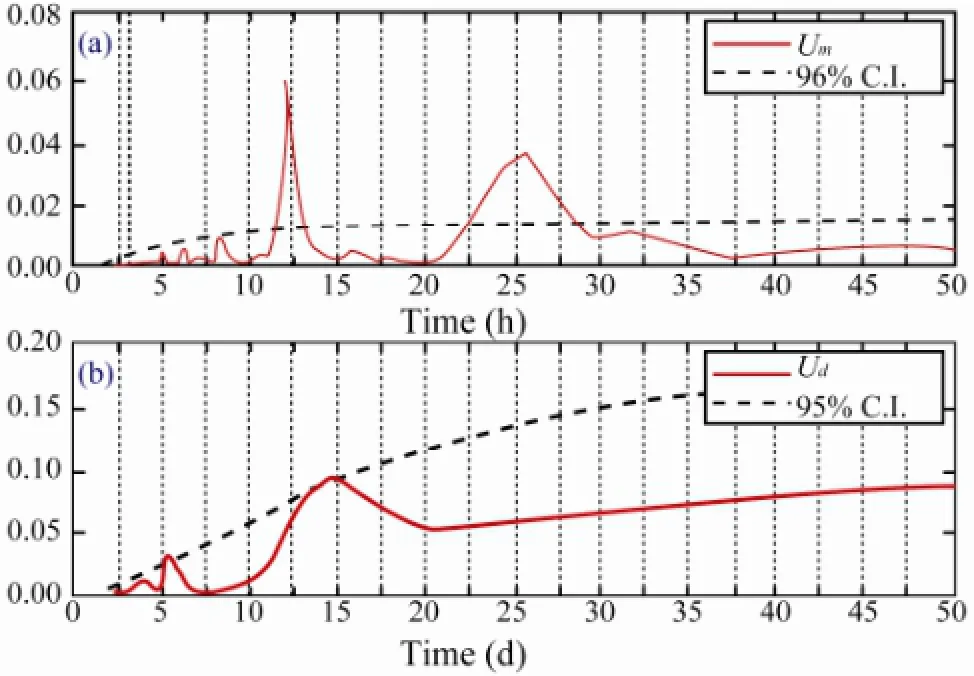
Fig.4 (a) Power spectra with the longest continuous stream-wise velocity from June 8 to August 19; (b) Power spectrum with daily mean data for 185 d.
The turbulent characteristicsε,u*,CdandFIwere estimated and presented in Fig.5. Maximums (minimums) ofε,u*,CdandFIcorresponded each other pretty well. This means that there is a good relation among them.εvaried 2 or 3 orders of magnitude during 24 h, whileu*was mostly distributed around 10-2m s-1andCdindicated a remarkable variation in a tidal period, andFIshowed that the horizontal components were stronger than vertical one, the same as the velocity. In the whole measurements,u*andCdchanged between 8.59×10⁻⁴-8.89×10⁻¹m s-1and 2.51×10⁻⁵-1.8×10⁻¹, respectively, daily mean variations were 6.50×10⁻³-2.32×10⁻²m s-1and 6.30×10⁻³-4.36× 10⁻², andεranged from 1.09×10⁻⁸-6.62×10⁻⁵W kg-1, and the range of daily averaged variation was 2.85×10⁻⁷-8.15×10⁻⁶W kg-1(Figure not showed), 10 or 100-times larger than the magnitude of 10-8W kg-1as observed in the bottom mixed layer by Goodman and Wang (2009) using an autonomous underwater vehicle in the north bight of Monterey bay in the summer of 2006. In MC, a loss of energy of internal waves went shoreward along the canyon axis; enhanced internal wave energy might cause higher turbulence and mixing (Kunzeet al., 2002). Carteret al.(2005) also showed the locally generated internal tides at the vicinity of canyon rim and nonlinear internal waves all could enhance the turbulence.
The power spectra ofε,u*,CdandFIwith 1-minute interval are shown in Fig.6. All of the turbulent characteristics had a prominently semidiurnal period. However, the diurnal period was not as significant as the mean velocity was.

Fig.5 Time serials of dissipation rate (ε), friction velocity (u*), drag coefficient (Cd) and fluctuation intensity (FI) with a 15-minute interval from May 4 to 8.
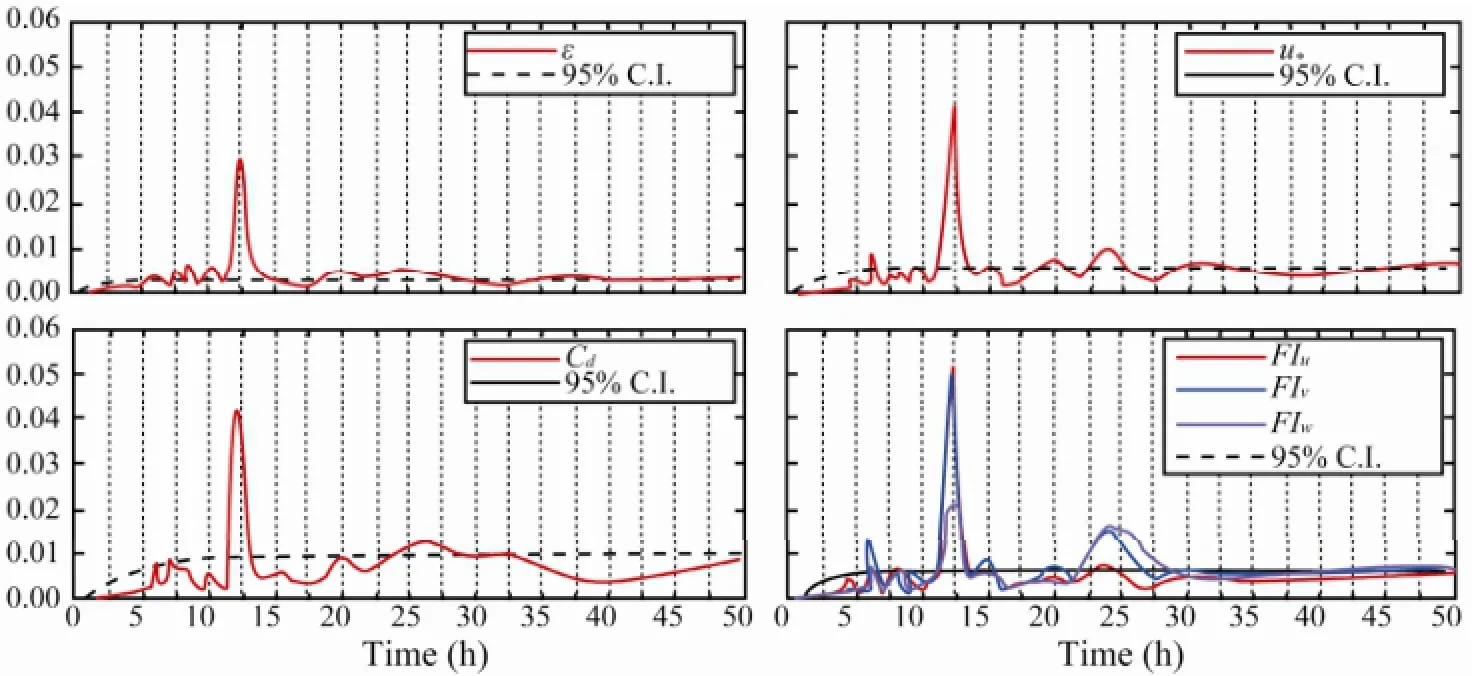
Fig.6 Power spectra of dissipation rate (ε), friction velocity (u*), drag coefficient (Cd) and fluctuation intensity (FI) from July 8 to August 19.

Fig.7 Mean velocity (U)vs.drag coefficient (Cd) from May 4 to 8.
The comparison between the stream-wise velocity and the drag coefficient from May 4 to 8 (Fig.7) shows that the relatively small drag coefficient corresponded to the relatively large mean velocity.Cddepended onUand decreased with its increasing. Chenget al.(1999) analyzed the ADCP data from South San Francisco Bay and pointed out that velocity larger than the critical velocity resulted in form drag decreasing and smaller bottom roughness length; on the contrary, the smaller velocity resulted in the sediment deposition to increase the roughness and drag coefficient. Fig.8 shows time variations of dissipation rate and mean velocity. It is obvious that the relatively high (low)εcorresponded to relatively small (large)U, which is different from what Liu and Wei (2007) presented for the Yellow Sea with rectilinear tidal current, where the tidal dissipation was strong and the turbulence in the tidal BBL was locally shear-induced. In MC, as mentioned above, the special geography could result in internal tides (Carteret al., 2005) and the energy loss of the internal waves with propagation (Kunzeet al., 2002) made contribution to turbulence. Lozovastkyet al.(2008) researched the near-bottom turbulence in the northwestern East China Sea, and found thatεalso depended on the change of flow direction in rotation flow. Therefore the internal tides, internal waves and the rotating currents all can input energy to the turbulence and then influence the dissipation rate characteristics.
According to the law-of-wall theory,εcan be estimated by the friction velocity in the well-developed BBL as

whereais usually assumed to be 1 in the classic theory,κ=0.4 is the von Karman constant (Lozovatskyet al., 2008) andz=1.4 m is the height above the bottom. The relationship betweenEtandεis

Fig.8 Time serials of dissipation rate (ε) and mean velocity (U) from May 4 to 8.

wherebtraditionally changes from 0.06 to 0.12 (Lozovatskyet al., 2008). To validate Eqs. (6) and (7), analyzing the relationships ofu*-εandEt-εby ADV measurements is helpful to evaluate the two coefficientsaandb. In Table 1, the best fit coefficients andR2were estimated for different time periods with 95% confidence interval. It is indicated that the best fit coefficients were not constant, andahad a big difference of more than 50% from the theory value,bwas one or two orders of magnitude less than the traditional value. The maximums ofaandbappeared in July and June individually. In the rotating tidal flow system of MC,aandbwere much smaller than the universal value. As the estimation ofεusing the inertial dissipation method assumes the isotropic turbulence, the high anisotropic could result in not matching well with the traditional theory. Eq. (6) is based on the local balance between the energy dissipated and energy produced by the mean velocity shear. The coefficientabeing much smaller than unit indicats that the bottom turbulence in MC was not primarily shear-induced. The internal tides and internal waves could be the other energy sources of the turbulence in the BBL of MC.
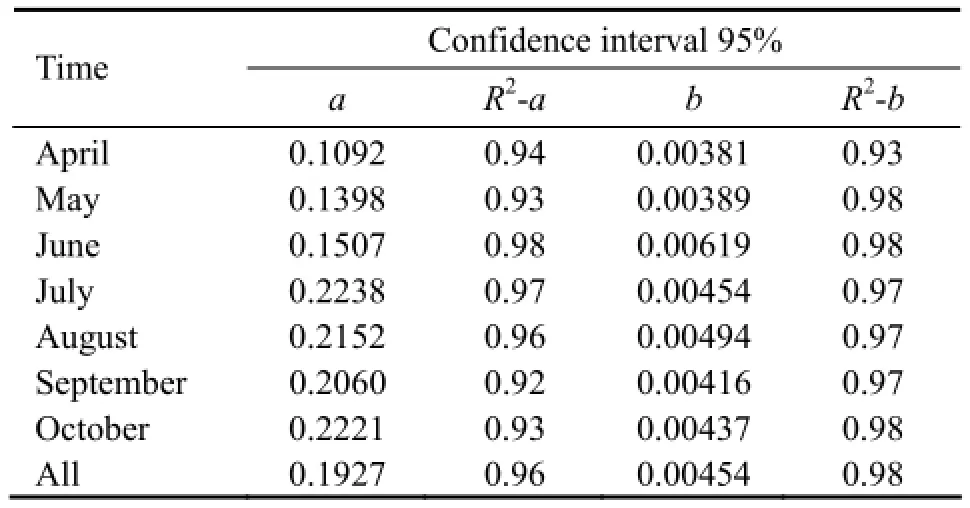
Table 1 Evaluated coefficients
4 Conclusions
At the 1.4 mab of MC, using the ADV to measure the high frequency velocity for 185 d is significant for observing turbulence indirectly and estimating turbulent characteristics. The turbulent dissipation rate was estimated using the inertial method. The drag coefficient is helpful to know the bottom property, and the turbulent kinetic energy dissipation rate is important in many numerical models. As the dissipation is hard to observe directly, the friction velocity and turbulent kinetic energy can be used to estimate it (By Eqs. (6) and (7)).
After analyzing the long-time serials data, we draw the main conclusions as follows:
1) In the BBL of MC, there is a rotating tide with a prominently semidiurnal period and a less significantly diurnal period and semilunar period. The bottom flow is strong where the 1-minute averaged stream-wise magnitude is up to 0.398 m s-1.
2) The variation range of estimated turbulent kinetic energy dissipation rate is 1.09×10⁻⁸-6.62×10⁻⁵W kg-1and varies with 2 or 3 orders of magnitude in 24 hours.
3) The daily averaged variations of friction velocity and drag coefficient at the height of 1.4 mab are 6.50×10⁻³-2.32×10⁻²m s-1and 6.30×10⁻³-4.36×10⁻²respectively.
4) The dissipation rate, fluctuations and drag coefficient all exhibit a remarkably semidiurnal period.
5) In the BBL of a rotating tide, the parameterized coefficients to describeε-u*andε-Etrelationships are much smaller than the traditional value and change with time.
According to the data, in the BBL of MC, the vertical fluctuation is almost one order of magnitude less than horizontal ones, which means the turbulence during the measurement is highly anisotropic. So far, the anisotropic turbulence theory has not developed well and isotropic turbulence has been assumed in most researches. The highly anisotropic turbulence makes it difficulty and inaccurate to estimate the dissipation rate. However, the results still have a profound meaning for understanding and modeling the bottom turbulence in MC. In order to get more information about the BBL, the observation of temperature gradient and velocity shear profile could be applied to examine the turbulent spectra (Oakey, 1982). In this paper, relatively high dissipation rate corresponds to relatively small velocity, which is different from the BBL of Yellow Sea (Liu and Wei, 2007), and more observations of internal tides and velocity profiles in MC will be helpful for further research. The velocity profiles can be used to estimate the contribution of shear-stress to turbulence and help to understand how the turbulenceoccurs in the BBL of MC. The internal tides and internal waves are obvious in MC, and how they influence the bottom turbulence is also interesting to be further studied.
Acknowledgements
The research was supported by the National Natural Science Foundation of China (Nos. 41476002 and 41076005, Program for New Century Excellent Talents in University NCET-11-0470, and National High-tech Research and Development Program (863 Torch Program) 2012AA09A403. We thank Professor Liao and Professor Liu for their suggestions on the processing of ADV data. Mr. Pei Bai’s help is appreciated for plotting Fig.1.
Carlos, M. G., Mariano, I. C., Yarko, N., and Marcelo, H. G., 2005. Turbulence measurements with acoustic Doppler velocimeters.Journal of Hydraulic Engineering, 131 (12): 1063- 1073.
Carter, G. S., Gregg, M. C., and Lien, R.-C., 2005. Internal waves, solitary-like waves and mixing on the Monterey Bay shelf.Continental Shelf Research, 25: 1499-1520.
Chanson, H., Trevethan, M., and Aoki, S.-I., 2008. Acoustic Doppler velocimetry in small estuary: Field experience and signal post-processing.Flow Measurement and Instrumentation, 19: 307-313.
Cheng, R. T., Ling, C. H., and Gartner, J. W., 1999. Estimates of bottom roughness length and bottom shear stress in South San Francisco Bay, California.Journal of Geophysical Research, 104: 7715-7728.
Doron, P. K., Bertuccioli, L., Katz, J., and Osborn, T. R., 2011. Turbulence characteristic and dissipation estimates in the coastal ocean bottom boundary layer from PIV data.Journal of Physical Oceanography, 31 (8): 2108-2134.
Goodman, L., and Wang, Z. H. K., 2009. Turbulence observations in the northern Bight of Monterey Bay from a small AUV.Journal of Marine Systems, 77: 441-458.
Goring, D. G., and Nikora, V. I., 2002. Despiking acoustic Doppler velocimeter data.Journal of Hydraulic Engineering, 128 (1): 117-126.
Kim, S. C., Friedrichs, C. T., Maa, J. P.-Y., and Wright, L. D., 2000. Estimating bottom stress in tidal boundary layer from acoustic Doppler velocimeter data.Journal of Hydraulic Engineering, 126 (6): 399-406.
Kolmogorov, A. N., 1941. The local structure of turbulence in incompressible viscous fluid for very large Reynolds numbers.Proceedings of the Royal Society London, 30 (299): 9-13.
Kunze, E., Mackay, C., McPhee-Shaw, E. E., Morrice, K., Girton, J. B., and Terker, S. R., 2011. Turbulent mixing and exchange with interior waters on sloping boundaries.Journal of Physical Oceanography, 42: 910-924.
Kunze, E., Rosenfeld, L. K., Carter, G. S., and Gregg Michael, M. C., 2002. Internal waves in Monterey Submarine Canyon.American Meteorological Society, 32: 1890-1913.
Lane, S. N., Biron, P. M., Bradbrook, K. F., Butler, J. B., Chandle, J. H., Crowell, M. D., Mclelland, S. J., Richards, K. S., and Roy, A. G., 1998. Three-dimensional measurement of river channel flow process using acoustic Doppler velocimetry.Earth Surface Processes and Landforms, 23: 1247-1267.
Liberzon, A., Gurka, R., Sarathi, P., and Kopp, G. A., 2012. Estimate of turbulent dissipation in a decaying grid turbulent flow.Experimental Thermal and Fluid Science, 39: 71-78.
Lien, R.-C., and Eric, A. D. A., 2006. Measurement of turbulent kinetic energy dissipation rate with a Lagrangian float.Journal of Atmospheric and Oceanic Technology, 23: 964-976.
Liu, Z. Y., and Wei, H., 2007. Estimation to the turbulent kinetic energy dissipation rate and bottom shear stress in the tidal bottom boundary layer of the Yellow sea.Progress in Natural Science, 17 (3): 289-297.
Lozovatsky, I., Liu, Z. Y., Wei, H., and Fernando, H. J. S., 2008. Tides and mixing in the northwestern East China Sea, Part II:Near-bottom turbulence.Continental Shelf Research, 28: 338-350.
Lozovatsky, I., Roget, E., Planella, J., Fernando, H. J. S., and Liu, Z. Y., 2010. Intermittency of near bottom turbulence in tidal flow on a shallow shelf.Journal of Geophysical Research, 115: 1-16, DOI: 10.1029/2009JC005325.
McHugh, C. M., Ryan, W. B. F., and Hecker, B., 1992. Contemporary sedimentary processes in the Monterey Canyonfan system.Marine Geology, 107: 35-50.
Oakey, N. S., 1982. Determination of the rate of dissipation of turbulent energy from simultaneous temperature and velocity shear microstructure measurement.Journal of Physical Oceanography, 12: 256-271.
Orton, P. H., and Visbeck, M., 2009. Variability of internally generated turbulence in an estuary, from 100 days of continuous observations.Continental Shelf Research, 29: 61-67.
Perlin, A., and Moum, J. N., 2012. Comparison of thermal variance dissipation rates from moored and profiling instruments at the equator.Journal of Atmospheric and Oceanic Technology, 29: 1347-1362.
Petruncio, E. T., Rosenfeld, L. K., and Paduan, J. D., 1998. Observation of the internal tide in Monterey Canyon.Journal of Physical Oceanography, 28: 1873-1903.
Rippeth, T. P., Williams, E., and Simpson, J. H., 2002. Reynolds stress and turbulent energy production in a tidal channel.Journal of Physical Oceanography, 32: 1242-1251.
Roy, A. G., Biron, P., and Serres, B. D., 1996. On the necessity of applying a rotation to instantaneous velocity measurements in river flow.Earth Surface Processes and Landforms, 21 (9):817-827.
Rusello, P. J., and Cowen, E. A., 2011. Turbulence dissipation estimates from pulse coherent Doppler instruments. In:Current Waves and Turbulence Measurements. 2011 IEEE/OES 10th, Monterey, CA, 167-172.
Smyth, W. D., and Moum, J. N., 2001. Three-dimensional turbulence. In:Encyclopedia of Ocean Sciences. Academic Press, Vol. 6, 2947-2955.
Sreenivasan, K. R., 1995. On the universality of the Kolmogorov constant.Physical Fluids, 7 (11): 2778-2884.
Stapleton, K. R., and Huntley, D. A., 1995. Seabed stress determination using the inertial dissipation method and the turbulent kinetic energy method.Earth Surface Process and Landforms, 20 (9): 807-815.
Wahl, T. L., 2003. Discussions of ‘Despiking acoustic doppler velocimeter data’.Journal of Hydraulic Engineering, 129 (6):484-488.
Wu, J. X., Liu, H., Ren, J., and Deng, J. J., 2011. Cyclonic spirals in tidally accelerating bottom boundary layers in the Zhujiang Estuary.Journal of Physical Oceanography, 41 (6): 1209-1226.
Xu, J. P., Nobel, M., Eittreim, S. L., Rosenfeld, L. K., Schwing, F. B., and Pilskaln, C. H., 2002. Distribution and transport of suspended particulate matter in Monterey Canyon, California.Marine Geology, 181: 215-234.
(Edited by Xie Jun)
(Received August 16, 2013; revised November 15, 2013; accepted December 29, 2014)
© Ocean University of China, Science Press and Springer-Verlag Berlin Heidelberg 2015
* Corresponding author. Tel: 0086-532-66781528 E-mail: lpliang@ouc.edu.cn
杂志排行
Journal of Ocean University of China的其它文章
- Effect of Dietary Lipid on the Growth,Fatty Acid Composition and Δ5 Fads Expression of Abalone(Haliotis discus hannai Ino)Hepatopancreas
- Species Composition and Diversity of Macrobenthos in the Intertidal Zone of Xiangshan Bay, China
- Evaluation of Cytotoxicity and Genotoxicity of Insecticide Carbaryl to Flounder Gill Cells and Its Teratogenicity to Zebrafish Embryos
- Purification of a Diatom and Its Identification to Cylindrotheca closterium
- Mechanical Stress Induces Neuroendocrine and Immune Responses of Sea Cucumber (Apostichopus japonicus)
- Preparation of κ-carra-Oligosaccharides with Microwave Assisted Acid Hydrolysis Method
