基于不同权重的栖息地指数模型预报阿根廷滑柔鱼中心渔场
2015-03-21胡贯宇陈新军汪金涛
胡贯宇,陈新军,汪金涛
(1.上海海洋大学 海洋科学学院,上海 201306;2.大洋渔业资源可持续开发省部共建教育部重点实验室,上海201306;3.上海海洋大学 国家远洋渔业工程技术研究中心,上海 201306;4.远洋渔业协同创新中心,上海 201306)
基于不同权重的栖息地指数模型预报阿根廷滑柔鱼中心渔场
胡贯宇1,4,陈新军1,2,3,4*,汪金涛1,4
(1.上海海洋大学 海洋科学学院,上海 201306;2.大洋渔业资源可持续开发省部共建教育部重点实验室,上海201306;3.上海海洋大学 国家远洋渔业工程技术研究中心,上海 201306;4.远洋渔业协同创新中心,上海 201306)
本文根据2003-2009年1-5月和2011年1-5月西南大西洋海域阿根廷滑柔鱼(Illexargentinus)的生产数据,结合遥感获得的海表面温度(SST)和海表面高度(SSH)数据,利用不同权重的栖息地指数模型来预报阿根廷滑柔鱼的中心渔场。采用外包络法,利用作业次数与SST、SSH建立适应性指数(SI)模型,依据作业次数比重和产量比重来比较不同权重的算术加权模型(AWM),从而筛选出最佳模型,并对最佳模型进行验证。结果显示,确定AWM(a=0.3,SST权重为0.3,SSH的权重为0.7)为最佳模型,当栖息地适应性指数(HSI)大于0.6时,作业次数的比重为93.23%,产量比重为89.28%,当HSI小于0.4时,作业次数的比重为2.12%,产量比重为3.35%。利用2011年1-5月的生产数据和环境数据对AWM(a=0.3)进行验证,结果显示,在HSI大于0.6的海域,各月作业次数比重均在91%以上,产量比重均在95%以上。研究表明,在阿根廷滑柔鱼渔场形成中SSH比SST更为重要,基于SST和SSH的AWM(a=0.3)能够较好地预测西南大西洋阿根廷滑柔鱼的中心渔场。
阿根廷滑柔鱼;栖息地模型;海表面温度;海表面高度;中心渔场
1 引言
阿根廷滑柔鱼(Illexargentinus)广泛分布于西南大西洋巴塔哥尼亚大陆架海域[1—2],是西南大西洋重要的经济头足类资源。以阿根廷滑柔鱼为目标鱼种的渔业始于1978年,之后得到大规模的开发,据FAO统计,1999年达到了历史最高产量,为115万吨,随后呈现出下降的趋势,2006—2008年产量稳定在70万吨以上,随后产量又呈下降的趋势,2012年总产量为34万吨。中国大陆于1997年首次对阿根廷滑柔鱼进行捕捞,2007—2008年产量均在20万吨左右,2012年总产量为7.8万吨。
渔业资源的空间分布与环境因子密切相关[3—6],阿根廷滑柔鱼为短生命周期的物种,能够对环境条件的变化迅速的做出反映,已有研究认为,阿根廷滑柔鱼渔场分布与海表面温度[7—8]、海表面高度[9]、叶绿素a[10]和海流[11—12]等环境因子关系密切,其中尤以海表面温度和海表面高度为主要。栖息地指数模型最早被用来描述野生动物的栖息地质量[13],可以用来模拟生物体对其周围栖息环境的反应,是表征渔业资源空间分布与海洋环境关系的重要手段,被广泛地应用于渔场预报[10,14—16]的研究。在已有的研究中,利用栖息地指数对阿根廷滑柔鱼渔场进行预报的研究中,在对栖息地指数建模时多采用算术平均[10]、分位数回归等方法[14],均没有考虑海洋环境因子对中心渔场形成的不同影响。渔场形成的原理认为[17],不同因子对渔场形成的影响程度是不一样的。为此,本研究结合栖息地指数的原理,以海表面温度和海表面高度为海洋环境因子,尝试建立基于不同权重的阿根廷滑柔鱼栖息地指数模型,并筛选出最佳模型,探索该模型在阿根廷滑柔鱼中心渔场预报中的可行性。
2 材料和方法
2.1 数据来源
2.1.1 渔获数据
我国对阿根廷滑柔鱼捕捞以鱿钓作业为主。阿根廷滑柔鱼的渔获数据来源于上海海洋大学鱿钓技术组,均为鱿钓船作业,时间为2003—2009年1-5月和2011年1-5月。海域为35°~55°S,50°~65°W(图1),时间分辨率为月,利用Matlab软件将空间分辨率处理为0.5°×0.5°。数据内容包括作业位置、作业时间、渔获量和作业次数,其中渔船的作业时间精确到天,渔获量的单位为t,作业次数代表进行生产作业的渔船数量。
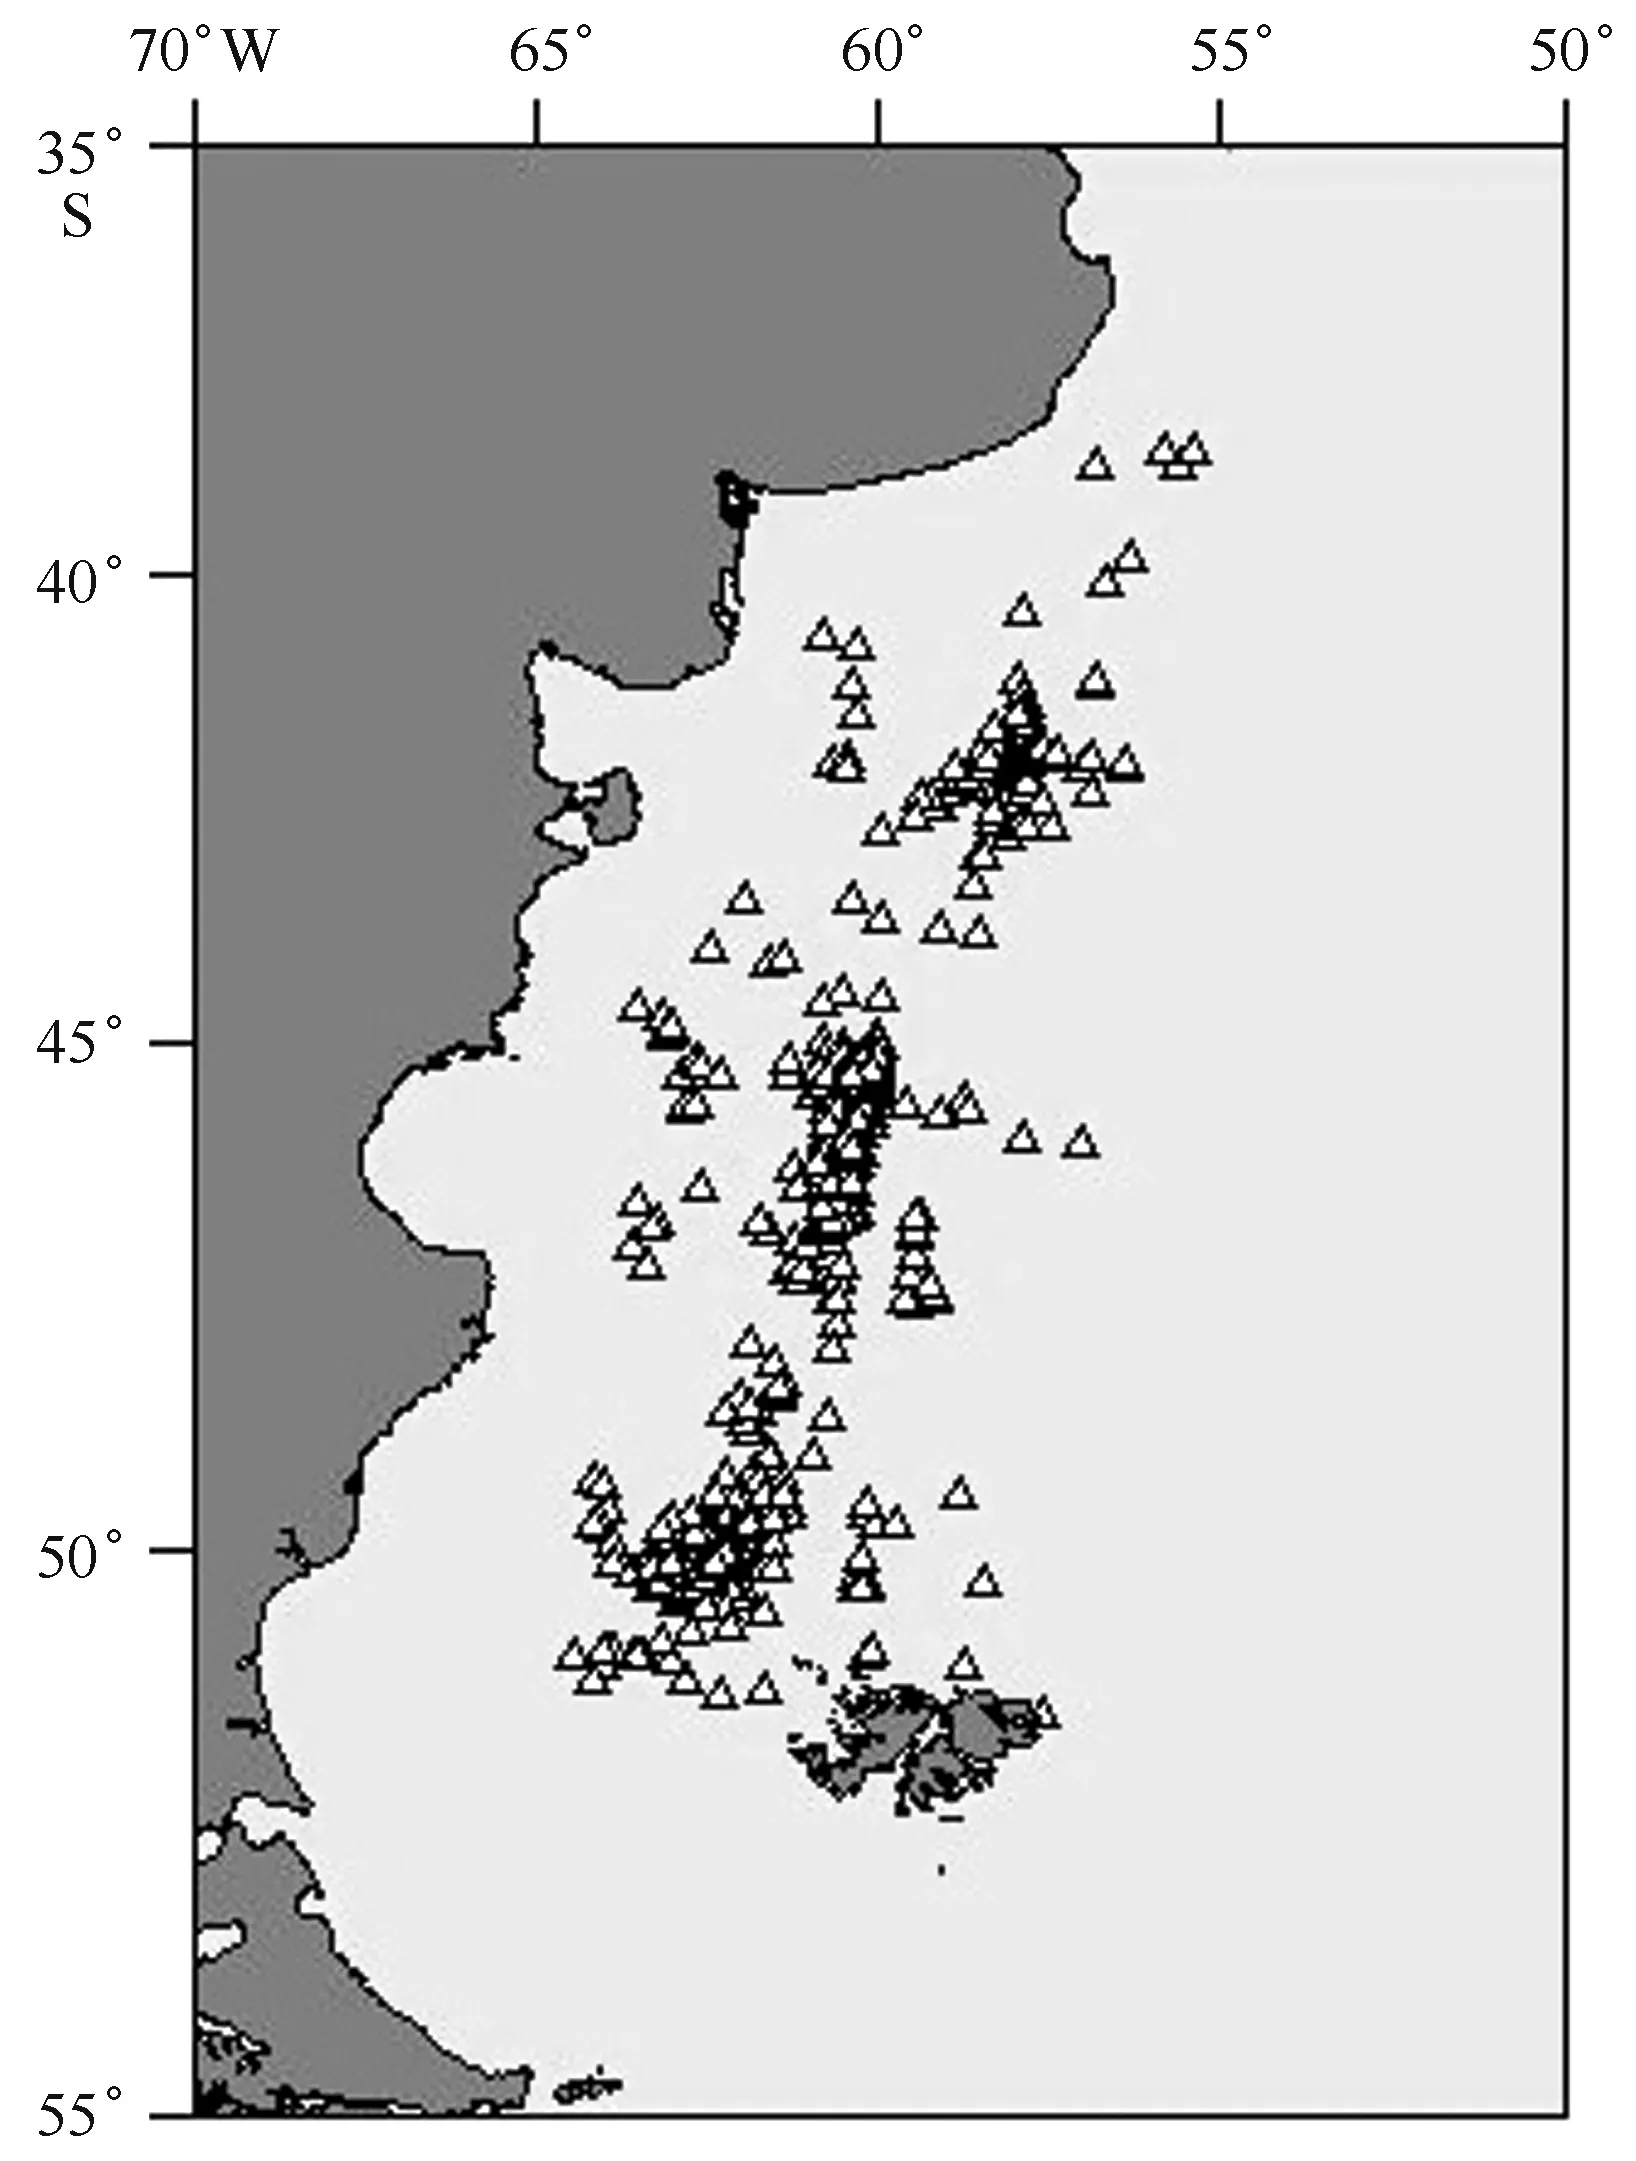
图1 2003—2009年西南大西洋阿根廷滑柔鱼采样站点Fig.1 Sample locations of Illex argentinus from 2003 to 2009 in the southwestern Atlantic
2.1.2 环境数据
海表面温度(SST)和海表面高度(SSH)资料均来源于Ocean Watch(http://oceanwatch.pifsc.noaa.gov/las/servlets/dataset),时间分辨率为月,空间分辨率为0.25°×0.25°,利用Matlab软件将空间分辨率处理为0.5°×0.5°。
2.2 数据处理方法
2.2.1 适应性指数
作业次数通常被认为是代表鱼类出现或被利用情况的指标[18],SST和SSH是阿根廷滑柔鱼渔场形成的主要因子[14—16]。因此,利用作业次数与SST、SSH建立适应性指数(Suitability index,SI)模型。适应性指数的取值范围为0到1,用来表征资源分布的多少。假定最高作业次数NETmax为阿根廷滑柔鱼资源分布最多的海域,其适应性指数SI为1,而当作业次数为0时被认为阿根廷滑柔鱼资源量最少的海域,其适应性指数SI为0[19]。采用外包络法[20],利用作业次数与SST、SSH建立适应性指数模型,建立SST和SSH与SI的关系,则通过SST和SSH即可求得对应的SI值,即SISST和SISSH。
2.2.2 栖息地指数的建模
利用算术加权模型(arithmetic weighted model,AWM)计算栖息地适应性指数(Habitat Suitability index,HSI),HSI在0到1之间变化,并认为HSI大于0.6的区域为渔业资源较为丰富的海域[6,10,15],技术路线示意图见图2。计算公式如下[21]:
AWM:HSI=aSISST+(1-a)SISSH,
(1)
式中,权重a分别取0、0.3、0.5、0.7和1;SISST和SISSH分别为SI与SST、SI与SSH的适应性指数。
2.2.3 验证与实证分析
最佳HSI模型选择,是在不同权重的情况下,HSI>0.6时[10,15],综合考虑作业次数的比重和产量的比重进行筛选。其中作业次数的比重即HSI>0.6时的作业次数占总的作业次数的百分比,产量的比重即HSI>0.6时的产量占总产量的百分比。利用最佳HSI模型计算2011年1-5月的HSI值,并对HSI值与实际作业情况进行分析比较,探讨预测中心渔场的可行性。

图2 栖息地指数计算示意图Fig.2 The illustration of estimating habitat suitability index
3 结果
3.1 SST和SSH的适应性指数曲线
采用外包络法,建立作业次数与SST、SSH之间适应性曲线(见图3)。由图3可知,1月份高适应性指数的SST和SSH最适范围分别为12.5~13.5℃和-35~-25 cm;2月份分别为13.5~14.5℃和-35~-25 cm;3月份分别为12.5~13.5℃和-45~-35 cm;4月份分别为9.5~10.5℃和-45~-35 cm;5月份分别为8.5~9.5℃和-35~-25 cm。
3.2 最佳HSI模型的选择
利用不同权重的算术加权模型计算出HSI及其所对应的作业次数比重,权重a=0的AWM,HSI大于0.6的作业次数比重为92.49%,产量比重为89.12%; 权重a=0.3的AWM,HSI大于0.6的作业次数比重为93.23%,产量比重为89.28%;权重a=0.5的AWM,HSI大于0.6的作业次数比重为90.62%,产量比重为85.12%;权重a=0.7和a=1的AWM,HSI大于0.6的作业次数的比重和产量比重均小于90%(见图4)。分析认为,权重a=0.3的AWM为最佳模型。
3.3HSI模型的验证
根据最优栖息地指数模型AWM(a=0.3),分别计算2011年1-5月各月的HSI值,并与实际作业情况比较(表1,图5)。分析发现,1月份,HSI大于0.6的海域,其作业次数和产量比重分别为91.26%和100%;2月份,HSI大于0.6的海域,其作业次数和产量比重分别为100%和100%;3月份,HSI大于0.6的海域,其作业次数和产量比重分别为99.44%和99.90%;4月份,HSI大于0.6的海域,其作业次数和产量比重分别为100%和100%;5月份,HSI大于0.6的海域,其作业次数和产量比重分别为95.78%和95.53%。

表1 2011年1-5月不同HSI值下作业次数比重和产量比重
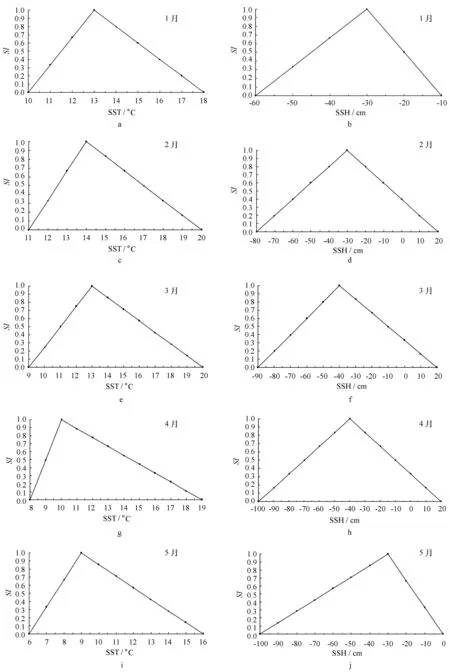
图3 1-5月份SST和SSH的适应性指数曲线Fig.3 The suitability index curves of SST and SSH from January to May6℃代表5.5~6.5℃,-100 cm代表-105~-95 cm,依次类推;a、c、e、g和i分别是1-5月SST的适应性指数曲线,b、d、f、h和j分别是1-5月SSH的适应性指数曲线,图中点为适应性指数的外包络点6℃ represents 5.5~6.5,-100 cm represents-105~-95 cm,successively; the suitability index curves of SST during January to May were picture a,c,e,g and i ,respectively; the suitability index curves of SSH during January to May were picture b,d,f,h and j ,respectively

图4 不同权重的算术加权模型计算的HSI>0.6所对应的作业次数比重和产量比重Fig.4 The percentages of fishing efforts and catch under HSI>0.6 calculated by AWM with different weights

图5 2011年1-5月HSI和作业次数分布Fig.5 The distribution of HSI and fishing efforts from January to May in 2011不同颜色代表不同HSI值,不同的形状代表作业次数的不同范围The values of HSI was respected by different colours,the fishing times were respected by different shapes
4 讨论
西南大西洋阿根廷滑柔鱼渔场形成于福克兰寒流与巴西暖流的交汇区,大陆架水域和福克兰海流之间边境有一陆架坡折(shelf-break)锋面,整个春季和夏季有较高的浮游植物生物量。SST被认为与海流的边界及锋面有关[17],因此,SST是影响渔场分布的重要环境因子[22]。SSH与海流及热量平衡有关,海流的聚合和辐散分别导致SSH的上升和下降[23],因此,SSH与渔场的分布密切相关。尽管西南大西洋阿根廷滑柔鱼渔场的分布和资源量极易受到SST、SSH等海洋环境因子的影响[2,11],但其中SST和SSH最为重要[7—12]。已有研究认为,各月份作业渔场的适宜SST有所差异,但主要集中在8~12℃[7—8],这与本研究的结果基本相同。
在进行HSI的建模时,本研究利用了算术加权模型,对不同的环境因子赋予权重,试图探讨不同环境因子影响阿根廷滑柔鱼栖息地指数分布的差异。结果显示,不同的加权模型对HSI产生很大的影响。SST通常被认为是影响鱼类渔场分布最重要的环境因子[24—25],然而,本研究发现,权重a=0.3的AWM为最佳HSI模型,即SST的权重为0.3、SSH的权重为0.7,因此,本研究认为,阿根廷滑柔鱼渔场形成过程中,SSH比SST更为重要。这可能是因为在西南大西洋海域,福克兰寒流与巴西暖流相交汇,与SST相比,SSH更多地反映了海洋中热量的变化以及渔场 的变动,从而使SSH与西南大西洋阿根廷滑柔鱼渔场的关系更加密切。
本研究利用作业次数与SST、SSH建立适应型指数模型。虽然单位日产量(CPUE)可作为表征资源密度的指标[26],但商业性渔业的CPUE作为资源丰度的指标并不一定可靠,因为商业性渔业渔民总是趋向于在有鱼的地方生产,这样会有大量的渔船聚集,虽然该海域的渔业资源丰富,但CPUE却不高,渔民一旦发现没鱼或产量较低,即刻转移生产地或停止生产,因此,与CPUE相比,捕捞努力量(作业次数)作为资源丰度的指标更为合适[6,27]。
本研究确定了最佳HSI模型为AWM(a=0.3),并利用该模型对2011年1-5月渔场进行预测,取得较好的效果,在HSI大于0.6的海域,各月作业次数比重均在91%以上,产量比重均在95%以上,而在以往的研究中,采用算术平均法计算HSI,在HSI大于0.6的海域,其作业次数比重在76%以上[10],可以发现,本研究预报的准确性明显提高。然而,在本研究中,环境因子的时间分辨率为月,在研究环境因子对渔场分布的影响时,可能会因为时间分辨率过大而掩盖一些现象,导致误差的产生。此外,鱿鱼具有昼夜垂直运动的现象,通常其深层温度以及温跃层有无也是寻找中心渔场的指标之一[17]。此外,海流和叶绿素浓度等对渔场分布也产生影响[10,12,28]。
在今后的研究中,应对渔场形成机制、生活史过程以及种群状况进行更深入的研究,考虑更多的、合适的环境因子研究阿根廷滑柔鱼栖息地分布,为渔业资源的合理开发和保护提供科学依据。
[1] Castellanos Z A. Una nueva especie de calamar argentinoOmmastrephesargentinussp. nov. (Mollusca,Cephalopoda)[J]. Neotropica,1960,6(20): 55-58.
[2] 王尧耕,陈新军. 世界大洋性经济柔鱼资源及其渔业[M]. 北京: 海洋出版社,2005: 190-194.
Wang Yaogeng,Chen Xinjun. Resources and Fisheries of the Economic oceanic spuid in the World[M]. Beijing: China Ocean Press,2005: 190-194.
[3] Anderson T J,Syms C,Roberts D A,et al. Multi-scale fish-habitat associations and the use of habitat surrogates to predict the organisation and abundance of deep-water fish assemblages[J]. Journal of Experimental Marine Biology and Ecology,2009,379(1/2): 34-42.
[4] Block B A,Costa D P,Boehlert G W,et al. Revealing pelagic habitat use: the tagging of Pacific pelagics program[J]. Oceanologica Acta,2002,25(5): 255-266.
[5] Freeman S M,Rogers S I. A new analytical approach to the characterisation of macro-epibenthic habitats: linking species to the environment[J]. Estuarine,Coastal and Shelf Science,2003,56(3/4): 749-764.
[6] Stoner A W,Spencer M L,Ryer C H. Flatfish-habitat associations in Alaska nursery grounds: use of continuous video records for multi-scale spatial analysis[J]. Journal of Sea Research,2007,57(2/3): 137-150.
[7] 陈新军,赵小虎. 西南大西洋阿根廷滑柔鱼产量分布与表温关系的初步研究[J]. 大连水产学院学报,2005,20(3): 222-228.
Chen Xinjun,Zhao Xiaohu. The relationship between the distribution of production of squidIllexargentinusand sea surface temperature in the southwest Atlantic Ocean[J]. Journal of Dalian Fisheries University,2005,20(3): 222-228.
[8] 陈新军,刘金立. 巴塔哥尼亚大陆架海域阿根廷滑柔鱼渔场分布及与表温的关系分析[J]. 海洋水产研究,2004,25(6): 19-24.
Chen Xinjun,Liu Jinli. Preliminary analysis on the relationship between the distribution of fishing ground ofIllexargentiusand SST in the Patagonian shelf[J]. Marine Fisheries Research,2004,25(6): 19-24.
[9] 陆化杰,陈新军. 2006年西南大西洋鱿钓渔场与表温和海面高度距平值的关系[J]. 大连水产学院学报,2008,23(3): 230-234.
Lu Huajie,Chen Xinjun. Relationship fishing squid of squid jigging and sea surface temperature, sea surface height in the Southwest Atlantic in 2006[J]. Journal of Dalian Fisheries University,2008,23(3): 230-234.
[10] 陈新军,陆化杰,刘必林,等. 利用栖息地指数预测西南大西洋阿根廷滑柔鱼渔场[J]. 上海海洋大学学报,2012,21(3): 431-438.
Chen Xinjun,Lu Huajie,Liu Bilin,et al. Forecasting fishing ground ofIllexargentinusby using habitat suitability model in the southwest Atlantic[J]. Journal of Shanghai Ocean University,2012,21(3): 431-438.
[11] Waluda C,Rodhouse P,PodestG,et al. Surface oceanography of the inferred hatching grounds ofIllexargentinus(Cephalopoda: Ommastrephidae) and influences on recruitment variability[J]. Marine Biology,2001,139(4): 671-679.
[12] Waluda C M,Trathan P N,Rodhouse P G. Influence of oceanographic variability on recruitment in theIllexargentinus(Cephalopoda: Ommastrephidae) fishery in the South Atlantic[J]. Marine Ecology Progress Series,1999,183: 159-167.
[13] Duel H,Pedroli B,Laane W E M. The habitat evaluation procedure in the policy analysis of inland waters in the Netherlands: towards ecological rehabilitation[C]// Leclerc M,Carpa H,Valentin S,et al. Ecohydraulics. Quebec: International Symposium on Habitat Hydraulics,2000,2: 619-630.
[14] 冯波,田思泉,陈新军. 基于分位数回归的西南太平洋阿根廷滑柔鱼栖息地模型研究[J]. 海洋湖沼通报,2010(1): 15-22.
Feng Bo,Tian Siquan,Chen Xinjun. The habitat suitability index ofIllexargentinusby using quantile regression method in the southwest Atlantic[J]. Transactions of Oceanology and Limnology,2010(1): 15-22.
[15] 高峰,陈新军,范江涛,等. 西南大西洋阿根廷滑柔鱼中心渔场预报的实现及验证[J]. 上海海洋大学学报,2011,20(5): 754-758.
Gao Feng,Chen Xinjun,Fan Jiangtao,et al. Implementation and verification of intelligent fishing ground forecasting ofIllexargentinusin the southwest Atlantic[J]. Journal of Shanghai Ocean University,2011,20(5): 754-758.
[16] 陈新军,冯波,许柳雄. 印度洋大眼金枪鱼栖息地指数研究及其比较[J]. 中国水产科学,2008,15(2): 269-278.
Chen Xinjun,Feng Bo,Xu Liuxiong. A comparative study on habitat suitability index of bigeye tuna,Thunnusobesusin the Indian Ocean[J]. Journal of Fishery Sciences of China,2008,15(2): 269-278.
[17] 陈新军. 渔业资源与渔场学[M]. 北京: 海洋出版社,2004: 16-215.
Chen Xinjun. Fishery Resources and Fishery Oceanography[M]. Beijing: China Ocean Press,2004: 16-215.
[18] Andrade H A,Garcia C A E. Skipjack tuna fishery in relation to sea surface temperature off the southern Brazilian coast[J]. Fisheries Oceanography,1999,8(4): 245-254.
[19] Mohri M,Nishida T. Seasonal changes in bigeye tuna fishing areas in relation to the oceanographic parameters in the Indian Ocean[J]. Journal of National Fisheries University,1999,47(2): 43-54.
[20] 郭爱. 中西太平洋金枪鱼围网鲣鱼渔况变动规律初步研究[D]. 上海: 上海海洋大学,2008: 19-20.
Guo Ai. The fishing condition laws of skipjackKatsuwonuspelamispurse-seine in the western-central Pacific Ocean[D]. Shanghai: Shanghai Ocean University,2008: 19-20.
[21] Chen X J,Tian S Q,Liu B L,et al. Modeling a habitat suitability index for the eastern fall cohort ofOmmastrephesbartramiiin the central North Pacific Ocean[J]. Chinese Journal of Oceanology and Limnology,2011,29(3): 493-504.
[22] 汪金涛,高峰,雷林,等. 基于产卵场环境因子的阿根廷滑柔鱼资源补充量预报模型研究[J]. 海洋学报,2014,36(12): 119-124.
Wang Jintao,Gao Feng,Lei Lin,et al. Study on forecasting model of recruitment forIllexargentinusby using the environmental factors in the spawning ground[J]. Haiyang Xuebao,2014,36(12): 119-124.
[23] Polito P S,Sato O T,Liu W T. Characterization and validation of the heat storage variability from TOPEX/Poseidon at four oceanographic sites[J]. Journal of Geophysical Research: Oceans (1978-2012),2000,105(C7): 16911-16921.
[24] Le Pape O,Chauvet F,Mahévas S,et al. Quantitative description of habitat suitability for the juvenile common sole (Soleasolea,L.) in the Bay of Biscay (France) and the contribution of different habitats to the adult population[J]. Journal of Sea Research,2003,50(2/3): 139-149.
[25] Zagaglia C R,Lorenzzetti J A,Stech J L. Remote sensing data and longline catches of yellowfin tuna (Thunnusalbacares) in the equatorial Atlantic[J]. Remote Sensing of Environment,2004,93(1/2): 267-281.
[26] Bertrand A,Josse E,Bach P,et al. Hydrological and trophic characteristics of tuna habitat: consequences on tuna distribution and longline catchability[J]. Canadian Journal of Fisheries and Aquatic Sciences,2002,59(6): 1002-1013.
[27] Gillis D M,Peterman R M,Tyler A V. Movement dynamics in a fishery: application of the ideal free distribution to spatial allocation of effort[J]. Canadian Journal of Fisheries and Aquatic Sciences,1993,50(2): 323-333.
[28] 冯永玖,杨铭霞,陈新军. 基于Voronoi图与空间自相关的西北太平洋柔鱼资源空间聚集特征分析[J]. 海洋学报,2014,36(12): 74-84.
Feng Yongjiu,Yang Mingxia,Chen Xinjun. Aanlyzing spatial aggregation ofOmmastrephesbartramiiin the northwest Pacific Ocean based on Voronoi diagram and spatial autocorrelation[J]. Haiyang Xuebao,2014,36(12): 74-84.
Forecasting fishing ground ofIllexargentinusbased on different weight habitat suitability index in the southwestern Atlantic
Hu Guanyu1,4,Chen Xinjun1,2,3,4,Wang Jintao1,4
(1.CollegeofMarineSciences,ShanghaiOceanUniversity,Shanghai201306,China;2.TheKeyLaboratoryofSustainableExploitationofOceanicFisheriesResources,MinistryofEducation,Shanghai201306,China; 3.NationalEngineeringResearchCenterforOceanicFisheries,ShanghaiOceanUniversity,Shanghai201306,China; 4.CollaborativeInnovationCenterforDistant-waterFisheries,Shanghai201306,China)
In this study,according to the Chinese squid fishing production data during the main fishing season (January to May) from 2003 to 2005,and 2011,combined with sea surface temperature (SST) and sea surface height (SSH) ,We attempt to forecast fishing ground ofIllexargentinusbased on habitat suitability models with different weights. The suitability index was built by external envelope method,and the arithmetic weighted model (AWM) with different weights were compared and the best habitat suitability index (HSI) model was selected based on the percentage of fishing efforts (fishing days) and catch. Results show that,whenHSIvalue was greater than 0.6,the percentage of fishing efforts was 93.23% and the percentage of catch was 89.28%,and whenHSIvalue was less than 0.4,the percentage of fishing efforts was 2.12% and the percentage of catch was 3.35% by using AWM (a=0.3,the weights of SST and SSH are 0.3 and 0.7 respectively). Compared with AWM with other four weights,the percentage of fishing efforts and of catch were larger whenHSIvalue was greater than 0.6,and the percentage of fishing efforts and catch were smaller whenHSIvalue was less than 0.4. Therefore,given to the percentage of fishing efforts and the percentage of catch,the AWM (a=0.3) was selected to be the bestHSImodel,defined asHSI=0.3SISST+0.7SISSH,indicating that SSH is more important than SST in estimating theHSIof squid. According to the data from January to May in 2011,we found that the main fishing ground is distributed in the waters withHSImore than 0.6 from the AWM(a=0.3),and the percentage of fishing efforts reached more than 91% and the percentage of catch were above 95%. The results indicate that SSH is more important than SST in the formation of fishing ground ofIllexargentinus,and the AWM (a=0.3) based on SST and SSH can better forecast the fishing grounds ofIllexargentinusin the southwest Atlantic.
Illexargentinus; habitat suitability model; sea surface temperature; sea surface height; fishing ground
10.3969/j.issn.0253-4193.2015.08.008
2014-12-10;
2015-03-26。
国家863计划(2012AA092303);国家发改委产业化专项(2159999);上海市科技创新行动计划(12231203900);国家科技支撑计划(2013BAD13B01)。
胡贯宇(1991—),男,安徽省宿州市人,研究方向为海洋渔业生物学。E-mail:hguanyuu@126.com
*通信作者:陈新军(1967—),男,教授,博士生导师,主要研究领域为渔业资源学。E-mail:xjchen@shou.edu.cn
S931.4
A
0253-4193(2015)08-0088-08
胡贯宇,陈新军,汪金涛. 基于不同权重的栖息地指数模型预报阿根廷滑柔鱼中心渔场[J].海洋学报,2015,37(8):88—95,
Hu Guanyu,Chen Xinjun,Wang Jintao. Forecasting fishing ground ofIllexargentinusbased on different weight habitat suitability index in the southwestern Atlantic[J]. Haiyang Xuebao,2015,37(8):88—95,doi:10.3969/j.issn.0253-4193.2015.08.008