Use of online electrical conductivity meter to monitor cold decomposition of carnallite
2015-03-03WANGXiaoboHOUYuanshengLIHuilin
WANG Xiao-bo, HOU Yuan-sheng, LI Hui-lin
(National Engineering Research Center for Integrated Utilization of Salt Lake Resource,Qinghai Salt Lake Industry Co., Ltd., Golmud 816000, China)
Use of online electrical conductivity meter to monitor cold decomposition of carnallite
WANG Xiao-bo, HOU Yuan-sheng, LI Hui-lin
(NationalEngineeringResearchCenterforIntegratedUtilizationofSaltLakeResource,QinghaiSaltLakeIndustryCo.,Ltd.,Golmud816000,China)
Online control of the ratio of carnallite to water is a key to achieve a fully continuous and automatic potash production. By monitoring carnallite cold decomposition process using online conductivity meter, the relationship between the conductivity and the control parameters was analyzed based on the data collected online. The results show that the conductivity regularly varies with a general trend of decrease after an initial increase when the ratio of mineral to water is adjusted. There are certain rules satisfying cubic polynomial regression equation. When the ratio of mineral to water is larger than 0.6, with the amount of carnallite increased by 10%, the conductivity decreases by 0.28%-0.45% accordingly and the relative deviation is less than 0.5%. The value of electrical conductivity has stabilized when the density of liquid increased to 1.27 g/cm3, namely, the solution reaches saturation. It has proved that the methods can be employed for online monitoring the ratio of carnallite to water during carnallite cold decomposition and the precise control has an important value for reference and application.
electrical conductivity meter; carnallite; cold decomposition
0 Introduction
Carnallite, mainly containing NaCl, MgCl2and KCl, is a double salt[1]that can decompose with water to produce KCl[2-3]under certain conditions. In decomposition process, the ratio of mineral to water must be controlled strictly according to a specific mechanism to make the process continuous and steady. In production, affected by temperature and other factors decomposition is difficult to keep desiring state, which means that mass of carnallite or water in the system needs to be adjusted constantly.
Currently, the main method of monitoring carnallite decomposition is to measure the density of the carnallite pulp manually[4]. The detailed steps are as follows: taking a sample intermittently, measuring its density or baume degrees and then adjusting the process parameters (mainly refers to the ratio of mineral to water), according to the obtained data. This poses a major obstacle to achieve automatic control of the KCl production, which has plagued the industry for many years.
Using an online electrical conductivity meter to monitor decomposition of carnallite and grasp the relationship between electrical conductivity and the ratio of carnallite to water provides possibilities for automatic control in industrial production.
Quaternary water-salt system is formed when carnallite decomposed with water[5-6]. So far, few studies on the electrical conductivity of this system have been reported. It is difficult to calculate the electrical conductivity of the liquid phase under the different ratio of mineral to water because of complex interaction among the ions. In this paper, online electrical conductivity meter InPro 7 250 was used to monitor decomposition of carnallite. The relationship between conductivity and the ratio of mineral to water was determined under the actual production conditions. The results provide basic data for industrial automatic control.
1 Methods
1.1 Calibration of on-line electrical conductivity meter
Standard solutions (1 mol/L,0.1 mol/L) of potassium chloride were prepared for calibration of electrical conductivity meter. Potassium chloride standard reagent with KCl (≥99.5%) was dried at 220 ℃ for 2 h. After that, 74.265 g and 7.436 g reagents were placed in different containers and 1 000 mL distilled water with electrical conductivity less than 0.2 μS/cm was used to dissolve the reagents respectively. Electrical conductivity of two solutions was afterwards measured at 25 ℃ and the electrical conductivity was compared to the standard value (GBW13120).
Experiments were conducted on a small test device as shown in Fig.1. Carnallite was decomposed with water in a tank with stirrer. Electrical conductivity was measured and recorded when the system has been in a stable state.
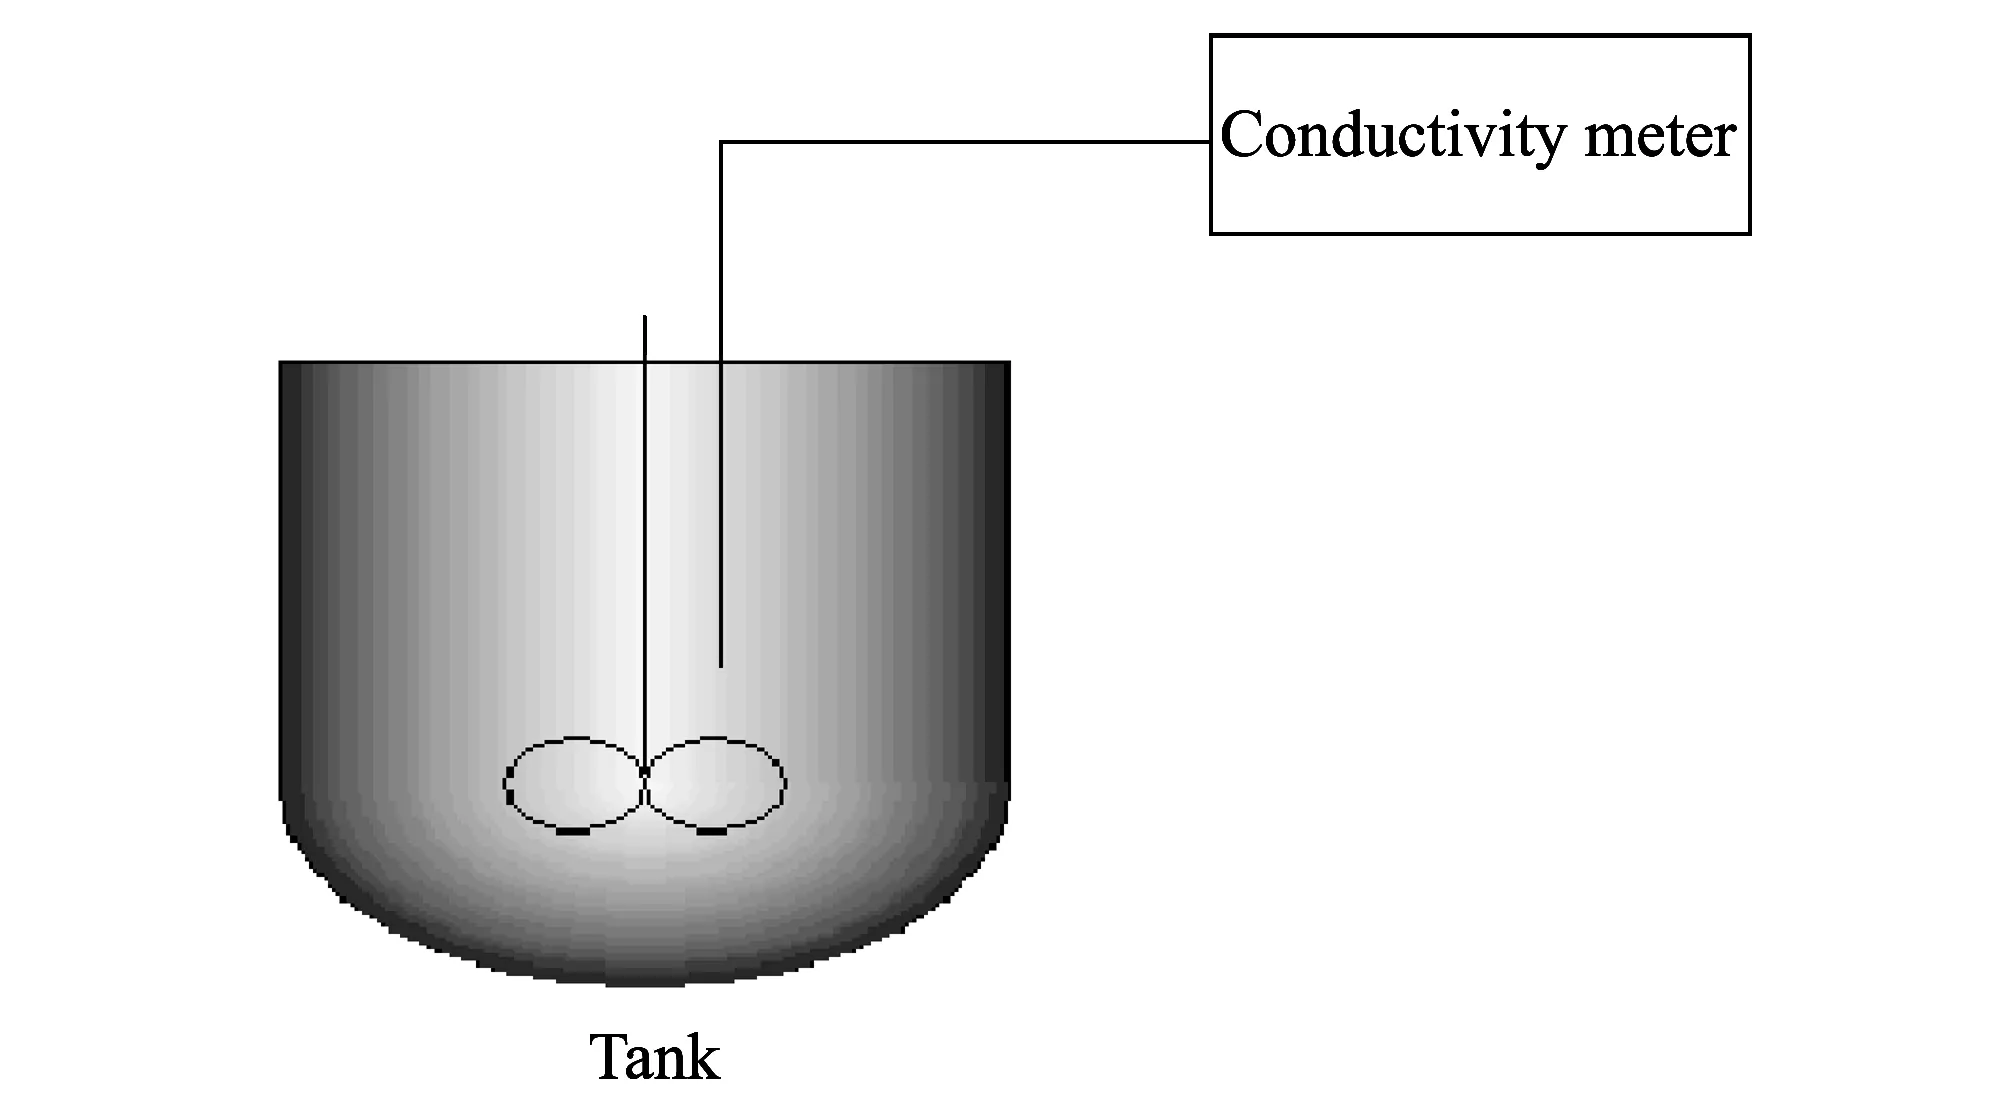
Fig.1 Schematic diagram of experimental device
1.3 Experimental conditions
Composition of carnallite is shown in Table 1.

Table 1 Composition for carnallite raw mineral
The following procedures were set up for experiments. 100 g carnallite and 1 000 g water were mixed in a tank and stirred at 15 ℃ and 25 ℃ respectively for 2 h. Electrical conductivity was measured after the system has stabilized.
The fluctuations of electrical conductivity at different temperatures were observed and recorded. Afterwards,100 g carnallite was added to the tank each time and the electrical conduction was measured respectively. With increasing of solid content in the system, solid and liquid were separated to avoid abnormal fluctuation of electrical conductivity. After that, adding 50 g carnallite to filtrate with stirring for 2 h each time until electrical conductivity no longer changed with the addition of solid. In addition, the variation tendency of electrical conductivity with decomposition time and stirring speed was measured by mixing 2 000 g carnallite with 1 000 g water at 25 ℃.
2 Results and discussion
Calibration results of the online electrical conductivity meter are given in Table 2. It can be seen that measured values of electrical conductivity consistent with the standard value, suggesting the electrical conductivity meter can be used as a measuring instrument due to its accuracy and reliability.
Table 2 Calibration results of on-line conductivity meter at 25 ℃

IDConcentration(mol/L)Electricalconductivity(ms/cm)MeasuredvaluesStandardvalues(GBW13120)11.0111.2-111.3111.3120.112.85-12.8712.852
The variation of electrical conductivities with the ratios of mineral to water at different temperatures (15 ℃ and 25 ℃) is listed in Table 3. In order to compare the variation tendencies of electrical conductivities visually at different temperatures, Fig.2 is plotted by setting mass ratio of mineral to water asx-axis and electrical conductivity asy-axis. As shown in Fig.2, the electrical conductivities at two temperatures are similar, indicating that temperature has little effect on electrical conductivity.
Table 3 Relationship between conductivity and the ratio of mineral to water
团检是把一个单位或集团的全部人员无选择地检查。团检的重点主要是集体生活、接触密切、频繁或由于易感者大量存在,一旦出现传染源危害大,蔓延快而广,易造成流行,如中小学教职员工、幼托机构工作人员同易感儿童接触、饮副食行业、服务性行业、商业以及公共交通从业人员同社会人群广泛接触即容易传染,也有较多散布传染的机会,医院工作人员和接触粉尘作业的厂矿工人都应根据各自特点采用团检方式定期进行检查。

MassratioofmineraltowaterElectricalconductivity(ms/cm)25℃15℃0.189.386.90.2146.3143.80.3181.7182.10.4203.4204.80.5214.3214.00.6213.6214.90.7209.9212.30.8197.5200.00.9185.7185.71.0176.5175.61.1169.4165.71.2161.4158.81.3152.2149.31.4146.5143.31.5140.8137.71.6135.2132.51.7129.7127.71.8124.5122.5

Fig.2 Electrical conductivity change tendencies at different temperatures
With the increasing of the ratio of mineral to water, solid content of the system increases, resulting in abnormal swing of electrical conductivity. Consequently, electrical conductivity is measured after solid and liquid is separated. It can be seen from Table 4 that electrical conductivity gradually decreases with increasing in density and the mass ratio of mineral to water. The value has been stabilized when the density increases to about 1.27 g/cm3and mass ratio reaches about 2.2 and the liquid composition no longer changes, indicating that the solution reaches saturation, which provides useful information to guide industrial production. Regression of experimental data is shown in Fig.3, with the multiple correlation coefficientR2=0.996 2.
Table 4 Relationship between conductivity and the ratio of mineral to water at 15 ℃

MassratioofmineraltowaterDensity(g/cm3)Electricalconductivity(ms/cm)Relativedeviation(%)1.801.2576154.5-155.10.391.851.2589148.0-148.50.341.901.2601144.8-145.20.281.951.2615140.3-140.90.432.001.2627138.5-139.10.432.051.2638136.6-137.00.292.101.2652136.0-136.60.442.151.2674135.2-135.70.372.201.2696134.6-135.20.452.251.2707133.8-134.30.372.301.2713133.8-134.30.372.351.2717133.7-134.30.452.401.2716133.6-134.10.37

Fig.3 Regression of experimental data
The tendencies of electrical conductivity variation with decomposition time and stirring speed are showed in Table 5 and Table 6, respectively. It can be seen from Table 5that variations are large in the first 90 min. However, in the next a few hours, the values have remained stable and the maximum relative deviation is less than 0.5%, suggesting the time for system reaching equilibrium can be considered as 90 min. Conclusion can be derived from Table 6 that stirring speed has a slight impact on electrical conductivity. Therefore, in industrial applications, the stirring speed needs to be controlled to make electrical conductivity stabilized.
Table 5 Relationship between electrical conductivity and decomposition time
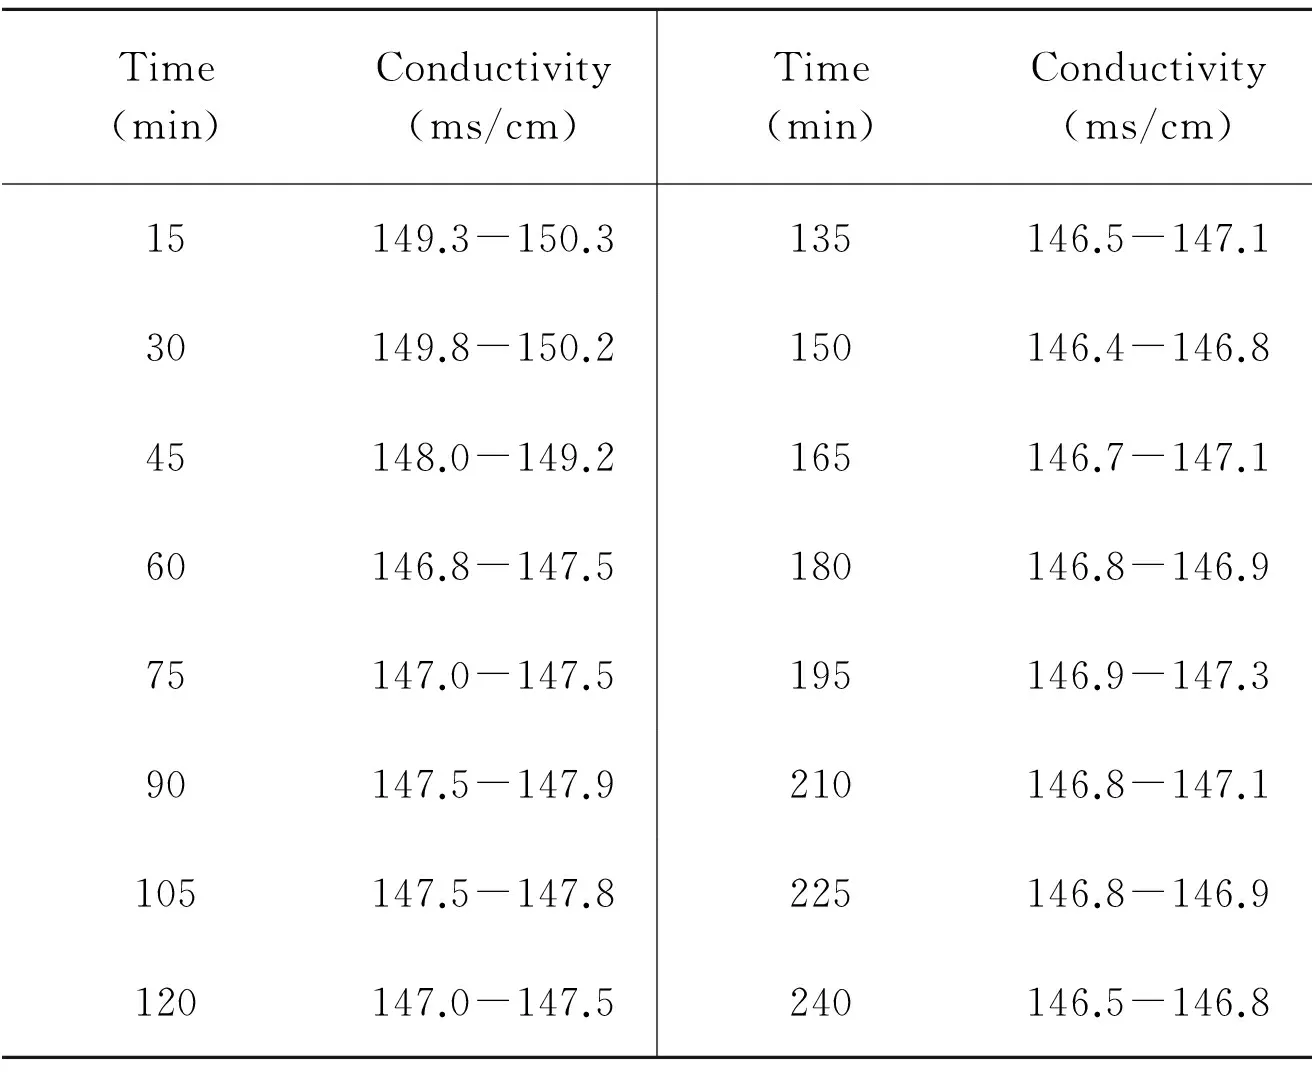
Time(min)Conductivity(ms/cm)Time(min)Conductivity(ms/cm)15149.3-150.3135146.5-147.130149.8-150.2150146.4-146.845148.0-149.2165146.7-147.160146.8-147.5180146.8-146.975147.0-147.5195146.9-147.390147.5-147.9210146.8-147.1105147.5-147.8225146.8-146.9120147.0-147.5240146.5-146.8
Table 6 Relationship between electrical conductivity and stirring speed

Stirringspeed(r/min)Conductivity(ms/cm)300118.41200115.32100112.33000108.8
3 Conclusion
Electrical conductivity meter InPro 7 250 is utilized to monitor decomposition of carnallite for its accuracy and reliability. Certain rules satisfying cubic polynomial regression equation that exist between electrical conductivity and the mass ratio of mineral to water under experimental conditions. The conductivity regularly changes following a general trend of decrease after an initial increase when the ratio of mineral to water is adjusted. When the ratio of mineral to water is larger than 0.6, with the amount of carnallite increased by 10%, the conductivity is decreases by 0.28%-0.45% accordingly and the relative deviation of the measured value is less than 0.5%, which provides useful information to guide industrial production. In addition, temperature and stirring speed have little effect on electrical conductivity and stirring speed needs to be controlled to make electrical conductivity stabilized in industrial applications.
[1] Balarew C, Christov C, Valyaskko V, et al. Thermodynamics of formation of carnallite type double salts. Journal of Solution Chemistry, 1993, 22(2): 173-174.
[2] CHENG Fang-qin, ZHANG Hong-man, YAN Xia, et al. Study on effect of the quantity of decomposition liquid on KCl recovery in process of carnallite cold-decomposition. Inorganic Chemicals Industry, 2008, 45(8): 19-22.
[3] ZHOU Ling, SHA Zuo-liang, TANG Na. Crystallization process investigation of potassium chloride from carnallite decomposition. Chemical Engineers Transactions, 2011, 24: 697-702.
[4] YU Qiu-ping, HOU Yuan-shen, ZHOU Qiang, et al. An online system used to monitor carnallite decomposition process: CN patent, 201320634469. 2014-02-05. http://industry.wanfangdata.com.cn/yj/Detail/Patent?id=Patent_CN201310478795.2.
[5] WANG Xu-ming, Miller J D, CHENG Fang-qin, et al. Potash flotation practice for carnallite resources in the Qinghai Province. Minerals Engineering, 2014, (66/67/68): 33-39.
[6] Hart A C, Huff J C, Walker K L. Recover of common salt and marine chemicals from brine: U.S. patent, 6776972. 2001-10-29.
应用在线电导率仪监测光卤石冷分解过程
王晓波, 侯元昇, 李辉林
(国家盐湖资源综合利用工程技术研究中心, 青海盐湖工业股份有限公司, 青海 格尔木 816000)
光卤石冷分解过程中矿水量比例在线控制是实现钾肥连续化、自动化生产的关键。利用在线电导率仪监测了光卤石加水分解的过程, 根据获得的在线监测电导率数据, 分析了光卤石冷分解过程中电导率的变化和工艺控制参数间的关系。结果表明, 体系的电导率值随着矿水比的调整有规律地变化, 呈现出先增后减的总体变化趋势, 且测量值相对偏差小于0.5%。当矿水比大于0.6时, 光卤石质量每增加10%, 电导率相应降低0.28%~0.45%, 两者间满足3次多项式回归方程; 当液相密度增大到约1.27 g/cm3时, 体系达到饱和, 电导率值保持恒定不变。实践证明, 本文所述方法可应用于光卤石冷分解过程矿水量的在线监测, 对钾肥生产中光卤石冷分解工艺的精确控制具有重要的参考和应用价值。
电导率仪; 光卤石; 冷分解
WANG Xiao-bo, HOU Yuan-sheng, LI Hui-lin . Use of online electrical conductivity meter to monitor cold decomposition of carnallite. Journal of Measurement Science and Instrumentation, 2015, 6(2): 185-189.
10.3969/j.issn.1674-8042.2015.02.013
WANG Xiao-bo (wxb0626@126.com)
1674-8042(2015)02-0185-05 doi: 10.3969/j.issn.1674-8042.2015.02.013
Received date: 2015-01-19
CLD number: TQ131 Document code: A
猜你喜欢
杂志排行

Journal of Measurement Science and Instrumentation的其它文章
- Rapidly determining fuel pollution level of aviation lubricating oil 50-1-4Φ by mid-infrared spectrometry
- Modeling and simulation of turbofan engine based on equilibrium manifold
- Prouhet-Thue-Morse sequence and atomic functions in applications of physics and techniques
- A fuzzy immune algorithm and its application in solvent tower soft sensor modeling
- Methane concentration detection system based on differential infrared absorption
- Modelling and simulation of high-speed milling chatter regeneration based on MATLAB