CFD simulation of ammonia-based CO2 absorption in a spray column
2015-03-01ZhaoJieJinBaoshengXuYin
Zhao Jie Jin Baosheng Xu Yin
(Key Laboratory of Energy Thermal Conversion and Control of Ministry of Education, Southeast University, Nanjing 210096, China)
CFD simulation of ammonia-based CO2absorption in a spray column
Zhao Jie Jin Baosheng Xu Yin
(Key Laboratory of Energy Thermal Conversion and Control of Ministry of Education, Southeast University, Nanjing 210096, China)
Abstract:A comprehensive computational fluid dynamics (CFD) model is developed based on the gas-liquid two-phase hydrodynamics, gas-liquid mass-transfer theory and chemical reaction kinetics, and the ammonia-based CO2absorption in a spray column is numerically studied. The Euler-Lagrange model is applied to describe the behavior of gas-liquid two-phase flow and heat transfer. The dual-film theory and related correlations are adopted to model the gas-liquid mass transfer and chemical absorption process. The volatilization model of multi-component droplet is utilized to account for ammonia slippage. The effect of operation parameters on CO2removal efficiency is numerically studied. The results show a good agreement with the previous experimental data, proving the validity of the proposed model. The profile studies of gas-phase velocity and CO2concentration suggest that the flow field has a significant impact on the CO2concentration field. Also, the local CO2absorption rate is influenced by both local turbulence and the local liquid-gas ratio. Furthermore, the velocity field of gas phase is optimized by the method of adjusting the orifice plate, and the results show that the CO2removal efficiency is improved by approximately 4%.
Key words:CO2absorption; spray column; computational fluid dynamics(CFD); aqueous ammonia
Received 2015-05-04.
Biographies:Zhao Jie(1991—),female,graduate;Jin Baosheng(corresponding author),male, professor, bsjin@seu.edu.cn.
Foundation item:The National Natural Science Foundation of China (No.51276038).
Citation:Zhao Jie, Jin Baosheng, Xu Yin.CFD simulation of ammonia-based CO2absorption in a spray column[J].Journal of Southeast University (English Edition),2015,31(4):479-488.[doi:10.3969/j.issn.1003-7985.2015.04.009]
The segregation and storage of CO2discharge from thermal power plants has been a concern among human beings due to global warming and deteriorating ecosystems. Although its natural volatilization still hinders its development, ammonia-based CO2capture has been considered as a potential approach among various CO2removal methods due to its high CO2removal efficiency, large absorption capacity, weak tendency to degradation, and low cost[1]. Recently, three types of reactors have been proposed for ammonia-based CO2capture, namely, tray columns, packed columns, and spray columns. Compared with the two other reactors, the spray column is more feasible for a large mass-transfer area and resistant to the block of the reactor caused by the precipitation of NH4HCO3[2].
Numerous studies on CO2capture in a spray column have been undertaken. Kuntz et al.[2]studied the mass-transfer performance of a spray column, and compared it to that of a packed column. The results demonstrate a great potential in using the spray column in the CO2capture application. Lim et al.[3]experimentally studied the performance of CO2capture with a single nozzle, and reported the correlation between the capture efficiency and the operation parameters. Niu et al.[4]compared three kinds of absorbents in the same spray column, and the results show that the CO2removal efficiency by aqueous ammonia is higher than that by both NaOH and MEA. Javed et al.[5]found that the imparting swirl in the gas flow can enhance the overall mass transfer coefficient up to around 49%.
Compared with the experiment, simulation studies based on CFD software package have the advantages of convenience and low-cost, especially visualization for three-dimensional distribution of operation parameters. Many investigations of CO2capture using numerical simulation methods have been conducted. However, most of them focused on the bubble column and packed column[6-9]. Numerical simulation studies on CO2capture in the spray column is rarely available. Furthermore, some of them ignored the CO2absorption process and emphasized the gas-liquid flow field in the spray column[10]. However, in order to optimize the operation parameters, it is essential to obtain the CO2concentration distribution. Thus, incorporating the CO2reactive absorption submodel into the overall model is very important. Besides, the study of the correlation between the flow field and CO2concentration field is rather significant for optimizing the flow field and improving CO2removal efficiency. Therefore, there is urgent need for further study in this area to examine the feasibility of ammonia-based CO2absorption in a spray column.
In this paper, a comprehensive CFD model incorporated with mass transfer, chemical reaction and two-phase flow is developed to describe ammonia-based CO2absorption in a spray column. Comparing the simulation results and the experimental data found in the previous literature, the effects of different operation parameters on CO2removal efficiency are studied. Ammonia slippage is also predicted numerically using the volatilization model of a multi-component droplet. After analyzing the law of flow field and CO2concentration field, a strategy for flow field optimization is adopted and CO2removal efficiency is improved.
1Model Description
1.1 Physical model
The sketch of a spray column used in this work is shown in Fig.1(a). Flue gas flows in the spray column from the bottom inlet, and goes up through the spray layers. Absorbent aqueous ammonia is sprayed from atomizers on the spray layers, makes contact with flue gas counter-current, and absorbs CO2in the meantime.The treated gas flows upwards and goes through demister where water vapor is eliminated. Aqueous ammonia which has absorbed CO2(rich solution) falls down to the column bottom. To simplify the model, the computational region is limited to a rich solution level and the effect of the rich solution on the flow field of flue gas is not considered. Assume that the demister zone has little effect on the flow field of flue gas and mass transfer. In order to eliminate the error caused by the difference in structure size, the spray column in Zeng’s experiment[11]was taken as the simulation object(see Fig.1(b)). The detailed flue gas and spray absorbent parameters are listed in Tab.1.

Fig.1 Structure sketch of spray column.(a) Schematic sketch;(b) Physical mode(unit:mm)
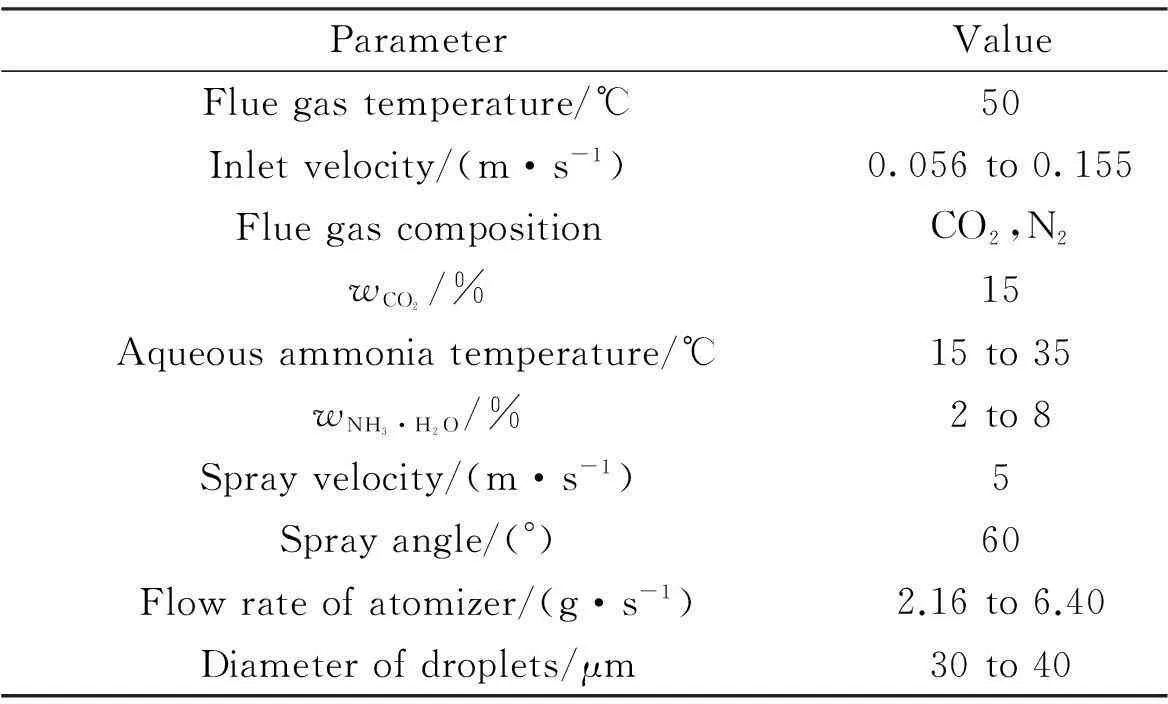
ParameterValueFluegastemperature/℃50Inletvelocity/(m·s-1)0.056to0.155FluegascompositionCO2,N2wCO2/%15Aqueousammoniatemperature/℃15to35wNH3·H2O/%2to8Sprayvelocity/(m·s-1)5Sprayangle/(°)60Flowrateofatomizer/(g·s-1)2.16to6.40Diameterofdroplets/μm30to40
Prior to performing the numerical simulations, several assumptions were made: 1) Flue gas is an incompressible Newtonian fluid and is treated as an ideal gas; 2) Liquid droplets are treated as a rigid sphere, and their diameters follow the Rosin-Rammber distribution; 3) Since droplet diameters are very uniform, collision between droplets is ignored[12]. In this study, the Weber number is far less than 1, the crack of droplets can be ignored[13-14]. Additionally, according to Refs.[15-16], the coalescence of droplets is also ignored; 4) The variations of flue gas velocity and droplet drag coefficient, resulting from droplet evaporation, droplet deformation and mass-transfer process, are not considered; 5) Once liquid droplets make contact with the wall, they will flow down along the wall and not affect the gas phase.
When carrying out the three-dimensional modeling and hypermesh, the whole column was divided into several different bodies to generate structured hexahedral meshes to improve the calculation accuracy. For the gas phase, the velocity inlet and pressure outlet were set to be the boundary conditions. Liquid phase was set as the escape. The second-order upwind was adopted as discretization schemes for conservative equations. SIMPLEC algorithms were applied to calculate the pressure-velocity coupled steady flow.
1.2 Hydrodynamical model
The fluid dynamics inside a spray column is typically a two-phase flow consisting of continuous flue gas and a large number of dispersed liquid droplets. In this paper, since the total volume ratio of dispersed liquid is far less than 10%, the E-L model is applied to simulate the behavior of the two-phase flow and heat transfer. The main advantage of using the Lagrangian framework for dispersed phase flow is that the particle-level phenomena can be modeled rigorously. Besides, droplet size distribution and droplet-wall interaction can be easily taken into account. The gas phase is simulated in the Eulerian frame. The standardk-εmodel and the standard wall function are adopted to describe the fully developed turbulence region and turbulence region near the wall, respectively. The universal equation for continuity, momentum, turbulence kinetic energy, dissipation rate, energy and concentration equation can be expressed as[17]


(1)
whereρis the density of the gas phase, kg/m3;φdefines universal dependent variable;Γrepresents the diffusion coefficient for different equations;Sis the source term for different equations. The expressions ofφ,Γ,Sare presented in Tab.2.

Tab.2 Parameters listed in universal equation
Spray liquids are described by the discrete particle model, and the random walk model is adopted to describe the influence of turbulence on the motion of liquid droplets. In gas-liquid flow regions with a low density ratio, only the steady-state drag force and the gravity force contribute to the linear momentum variation of particles. Other forces such as thermophoretic force, brownian, and saffman lift force etc. are ignored[18].
The dispersed phase particle trajectory is solved by the integration of particle force equation. The particle force equation is[13]

(2)
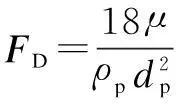
When considering the gas-liquid mass transfer, the effect of gas absorption on the continuous phase is described in the source terms (Sm,Su,ST,Sc) of different conservative equations.
1.3 CO2 absorption model and validation
1.3.1CO2absorption process in the spray column
Generally, the CO2absorption rate is expressed as[19]

(3)
wherecCO2is the Mole concentration of CO2in the liquid phase, mol/m3;tis the absorption time, s;αis the effective gas-liquid interfacial area in unit volume, m2/m3;NCO2is the overall mass-transfer flux, mol/(m2·s).
As is well known, the process of ammonia-based CO2absorption is an inter-phase mass-transfer process. With the diameters of liquid droplets as small as tens of micrometers, the internal circulation can be ignored. Thus, according to the dual-film theory, for steady CO2absorption process, the overall mass-transfer flux equation is
NCO2=KG(pCO2-pCO2,i)
(4)
whereKGis the overall mass-transfer coefficient in the gas phase, mol/(m2·s·Pa);pCO2is the partial pressure of CO2in the gas phase, Pa;pCO2,iis the equilibrium partial pressure of CO2at the interface, Pa.
For rapid chemical reactions,pCO2,iis far less than the partial pressure of CO2in the gas phasepCO2, sopCO2,iis approximately 0[11,20]. The overall mass-transfer coefficientKGin the gas phase is expressed as
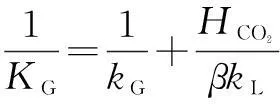
(5)
wherekGis the mass-transfer coefficient in the gas phase, mol/(m2·s·Pa);kLis the mass-transfer coefficient in the liquid phase without chemical reaction, m/s;βis the chemical reaction enhancement factor;HCO2is Henry’s constant of CO2, (Pa·m3)/mol.
kGis obtained by the Frossling equation as[19,21]

(6)
whereReis the Reynolds number;ShandScare the Sherwood number and the Schmidt number, respectively.


wheredis the diameter of liquid droplet, m;uGanduLare the velocities of flue gas and liquid droplet, m/s;ρGandμGare the density and viscosity of flue gas, kg/m3and Pa·s, respectively;DCO2is the diffusion coefficient of CO2in the gas phase, m2/s;MN2andMCO2are the mole mass ofN2and CO2, kg/kmol;vN2andvCO2are the molecular volume ofN2and CO2,cm3·mol.
kLis obtained by the following Sherwood relationship[6]:

(7)

(8)

(9)
For lower ammonia concentration(<10%) of aqueous ammonia, ammonia concentration has little effect on Henry’s law constant. So, we can use Henry’s law constant of CO2in water to estimate Henry’s law constant of CO2in aqueous ammonia[23]. Zeng[11]used the following correlation:

(10)
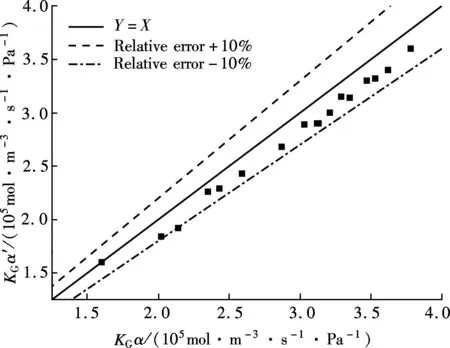
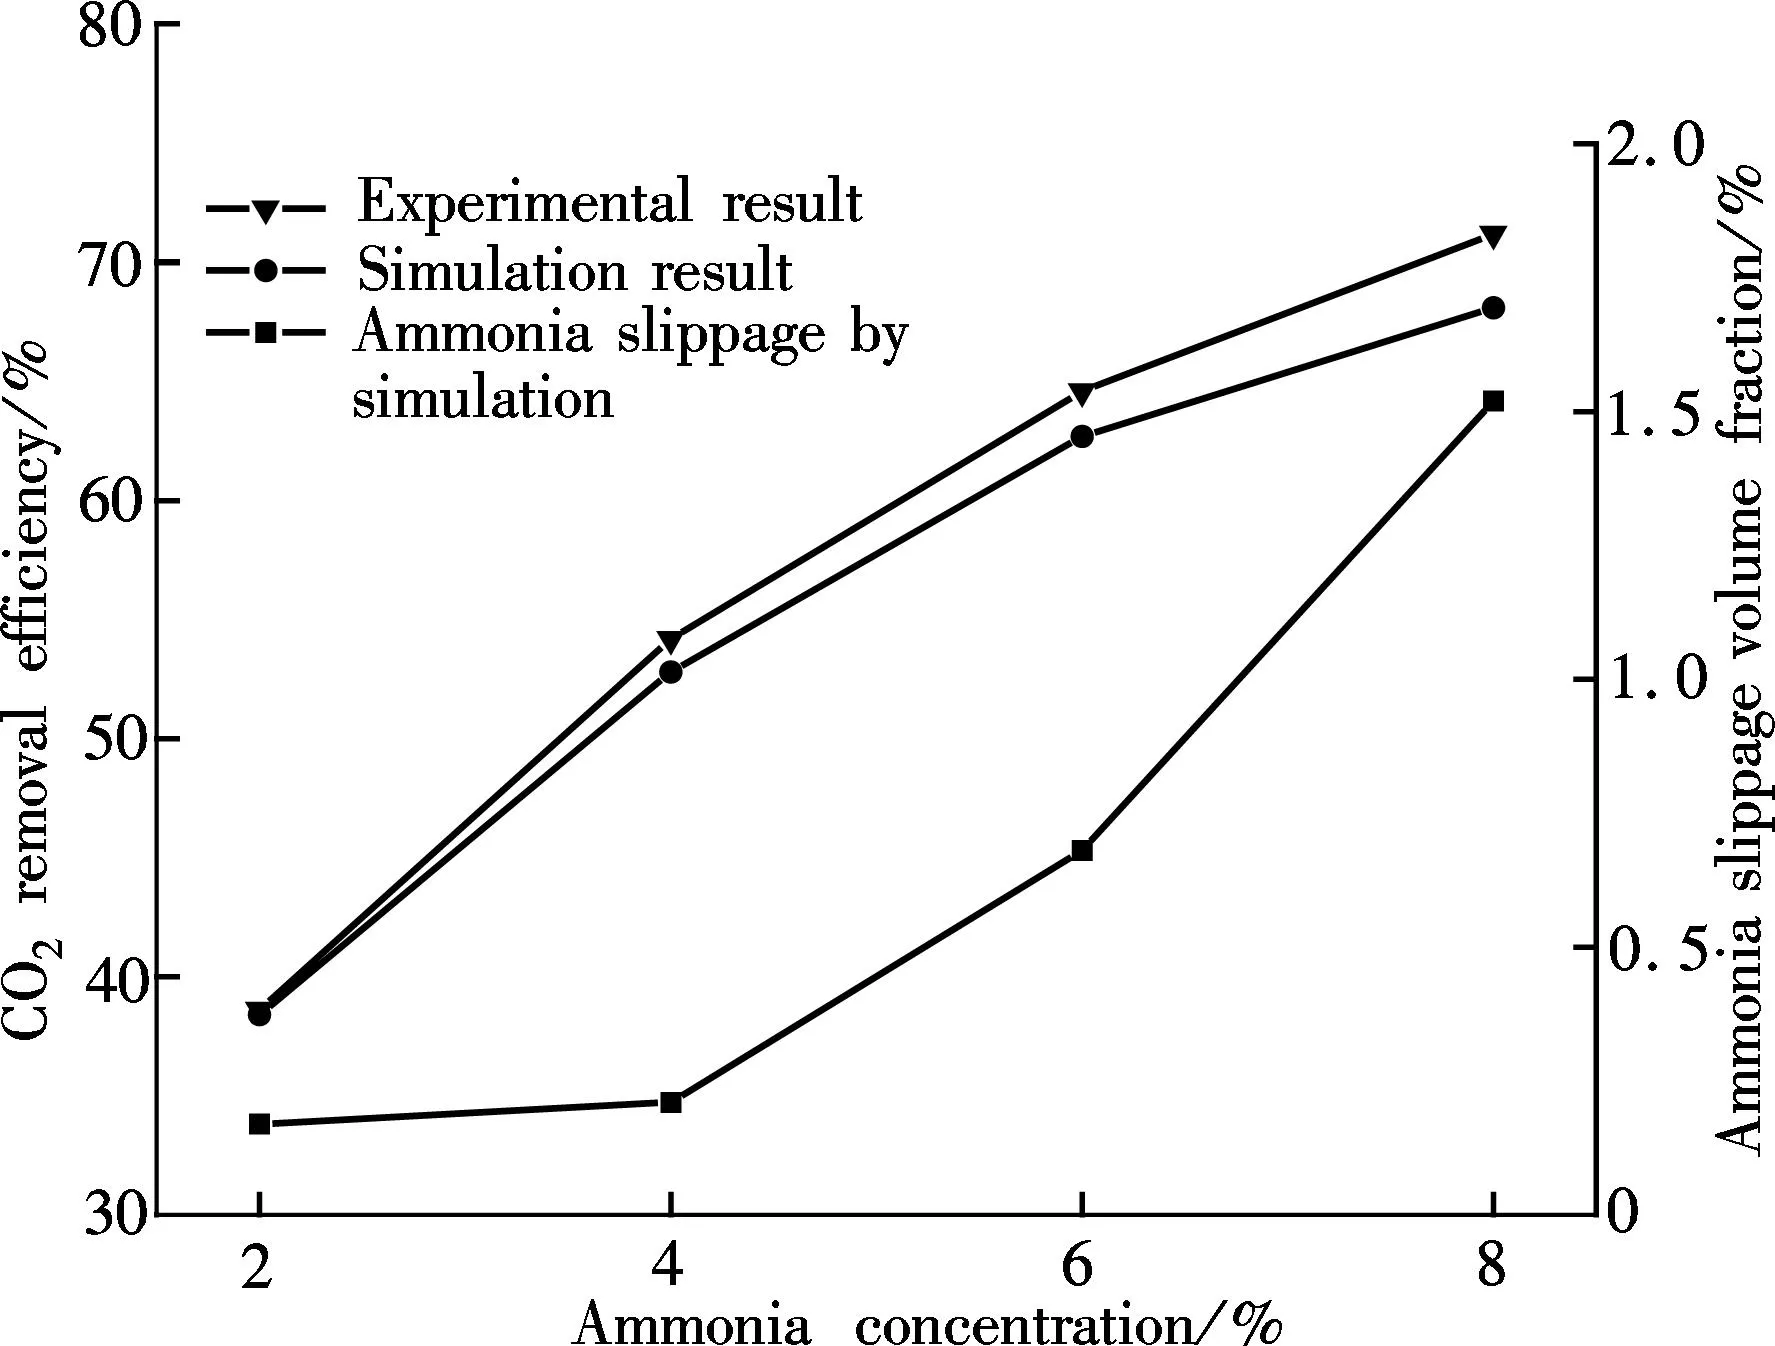
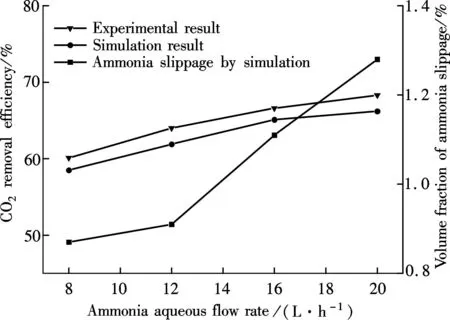
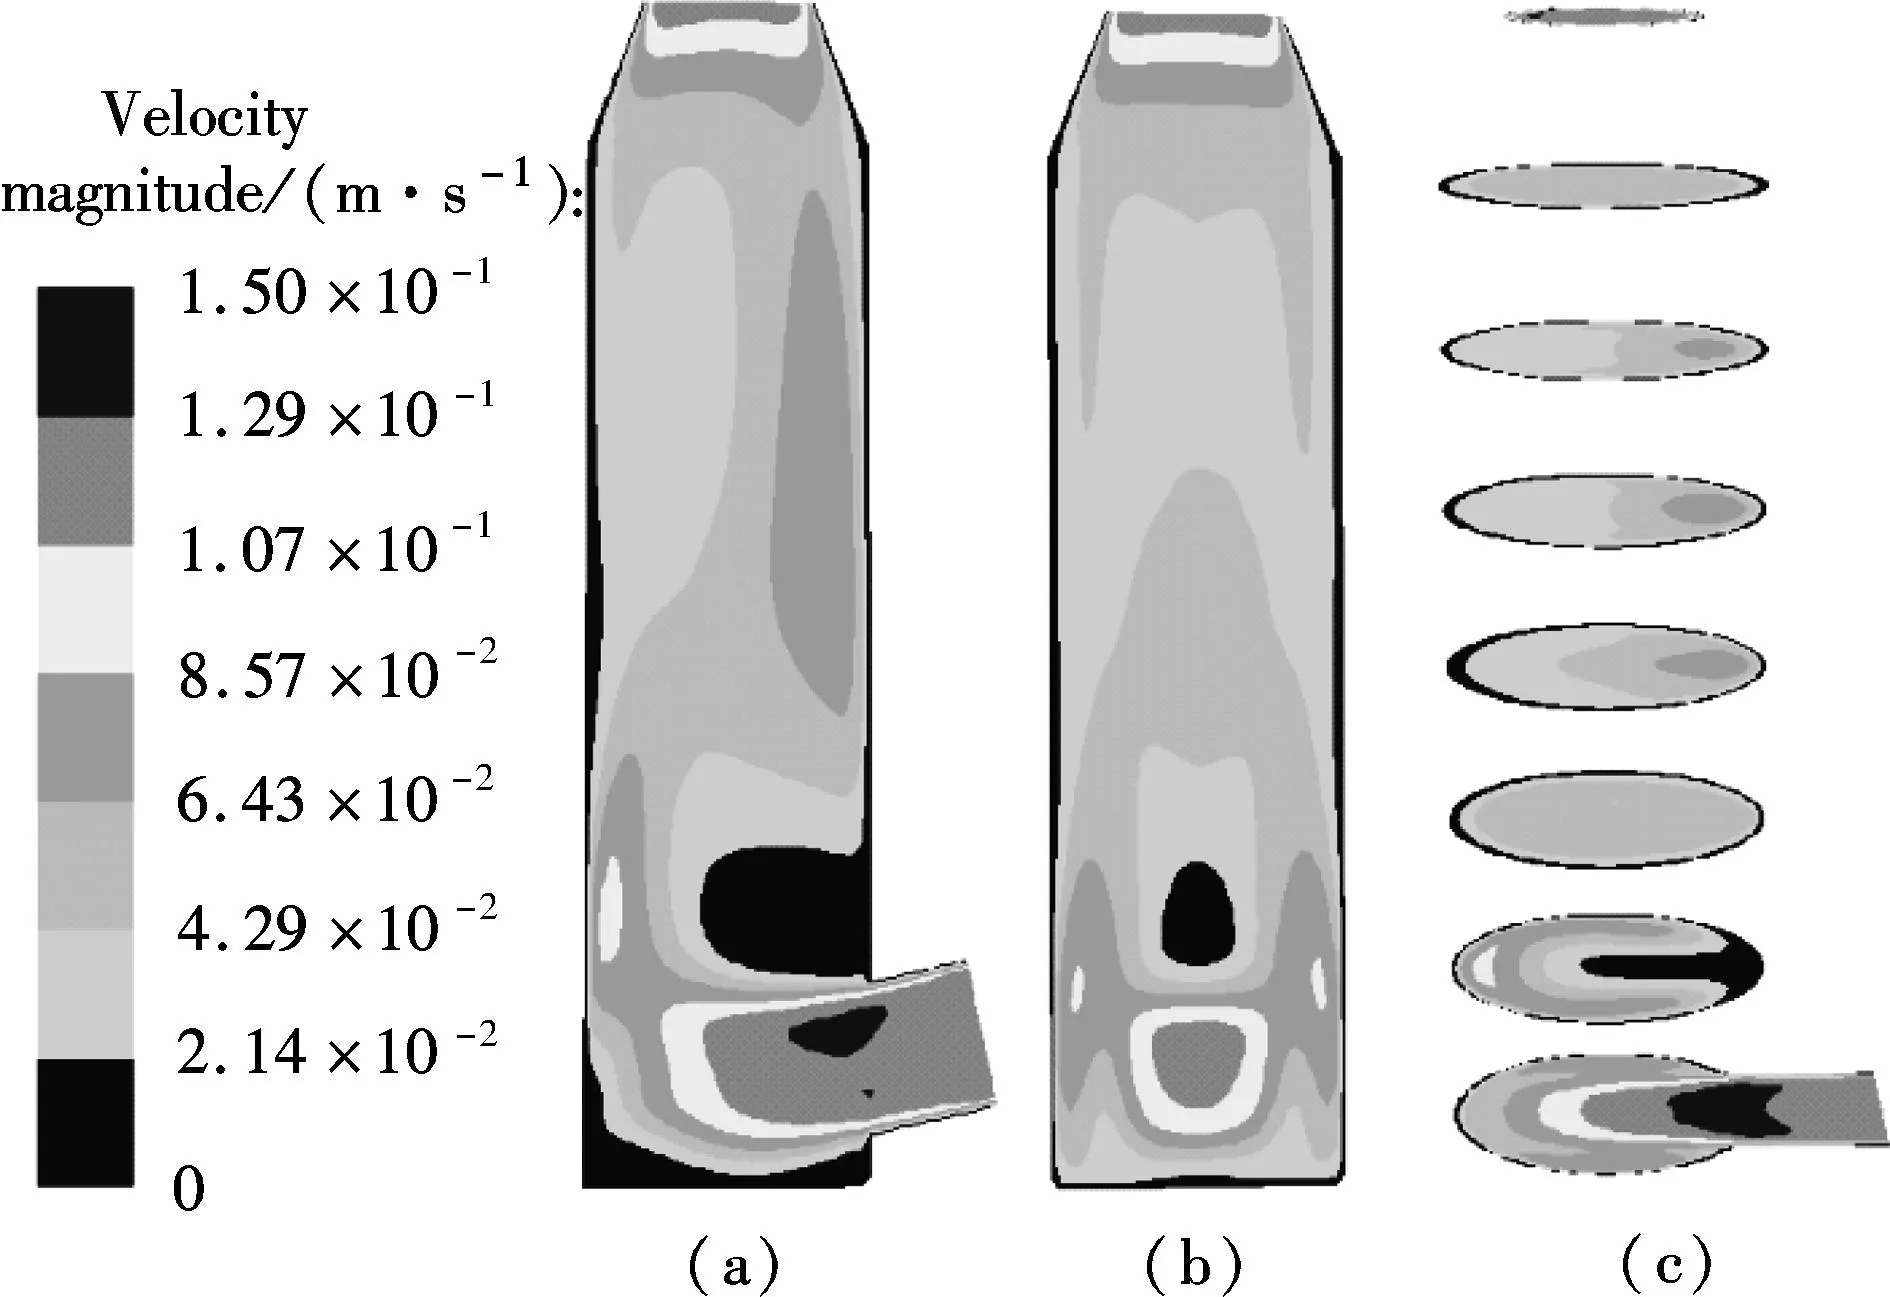
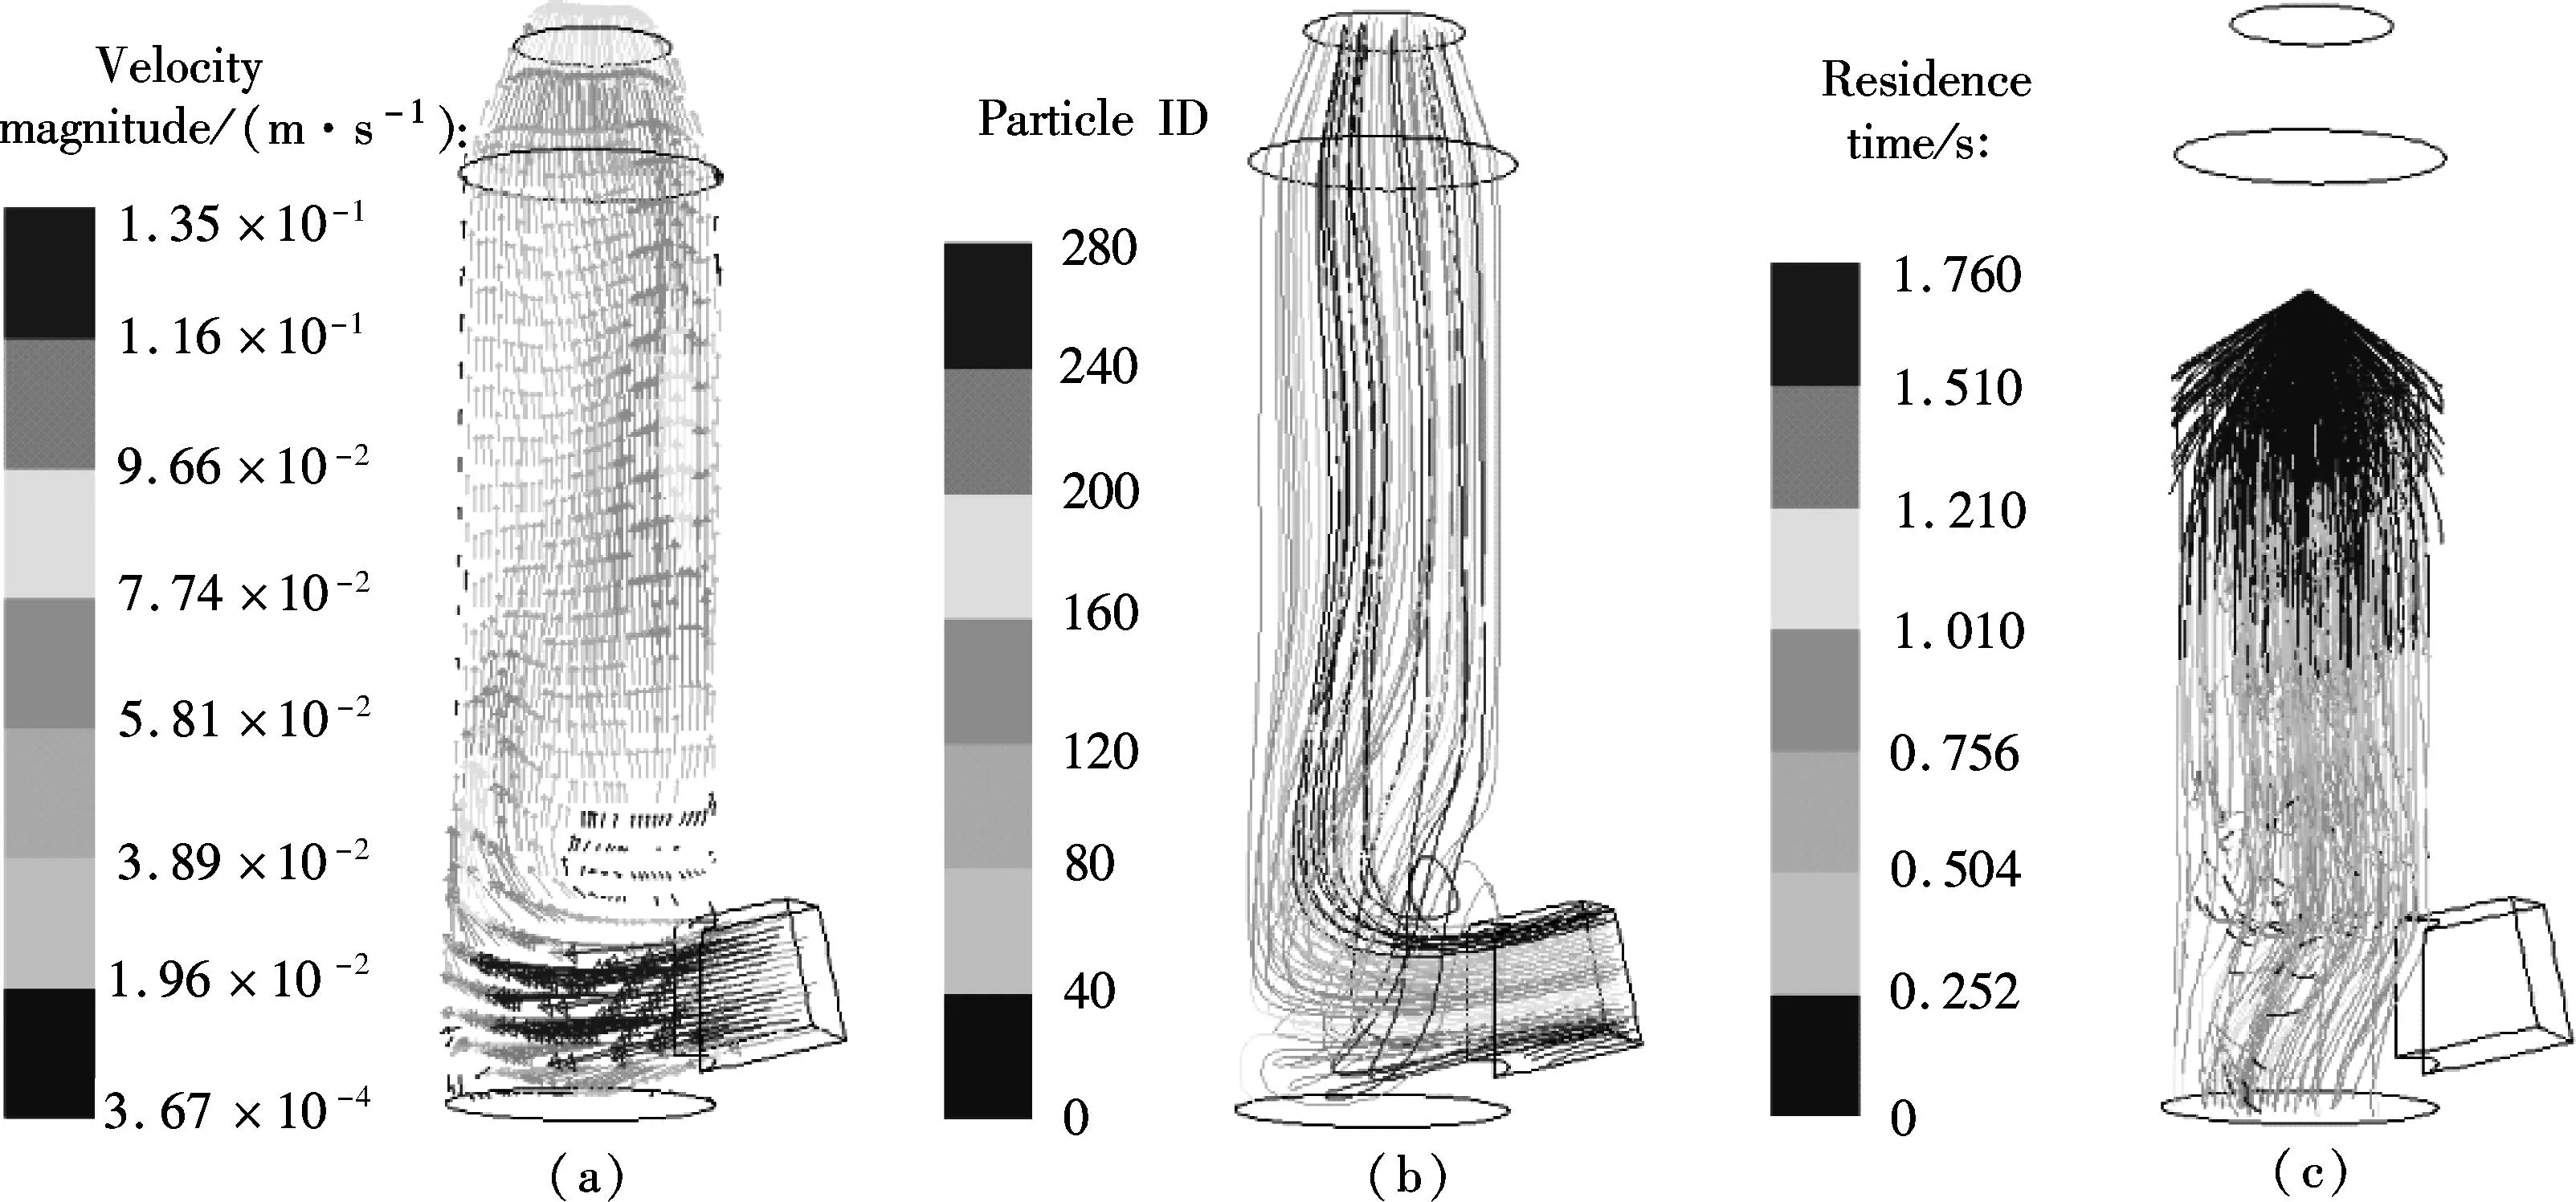
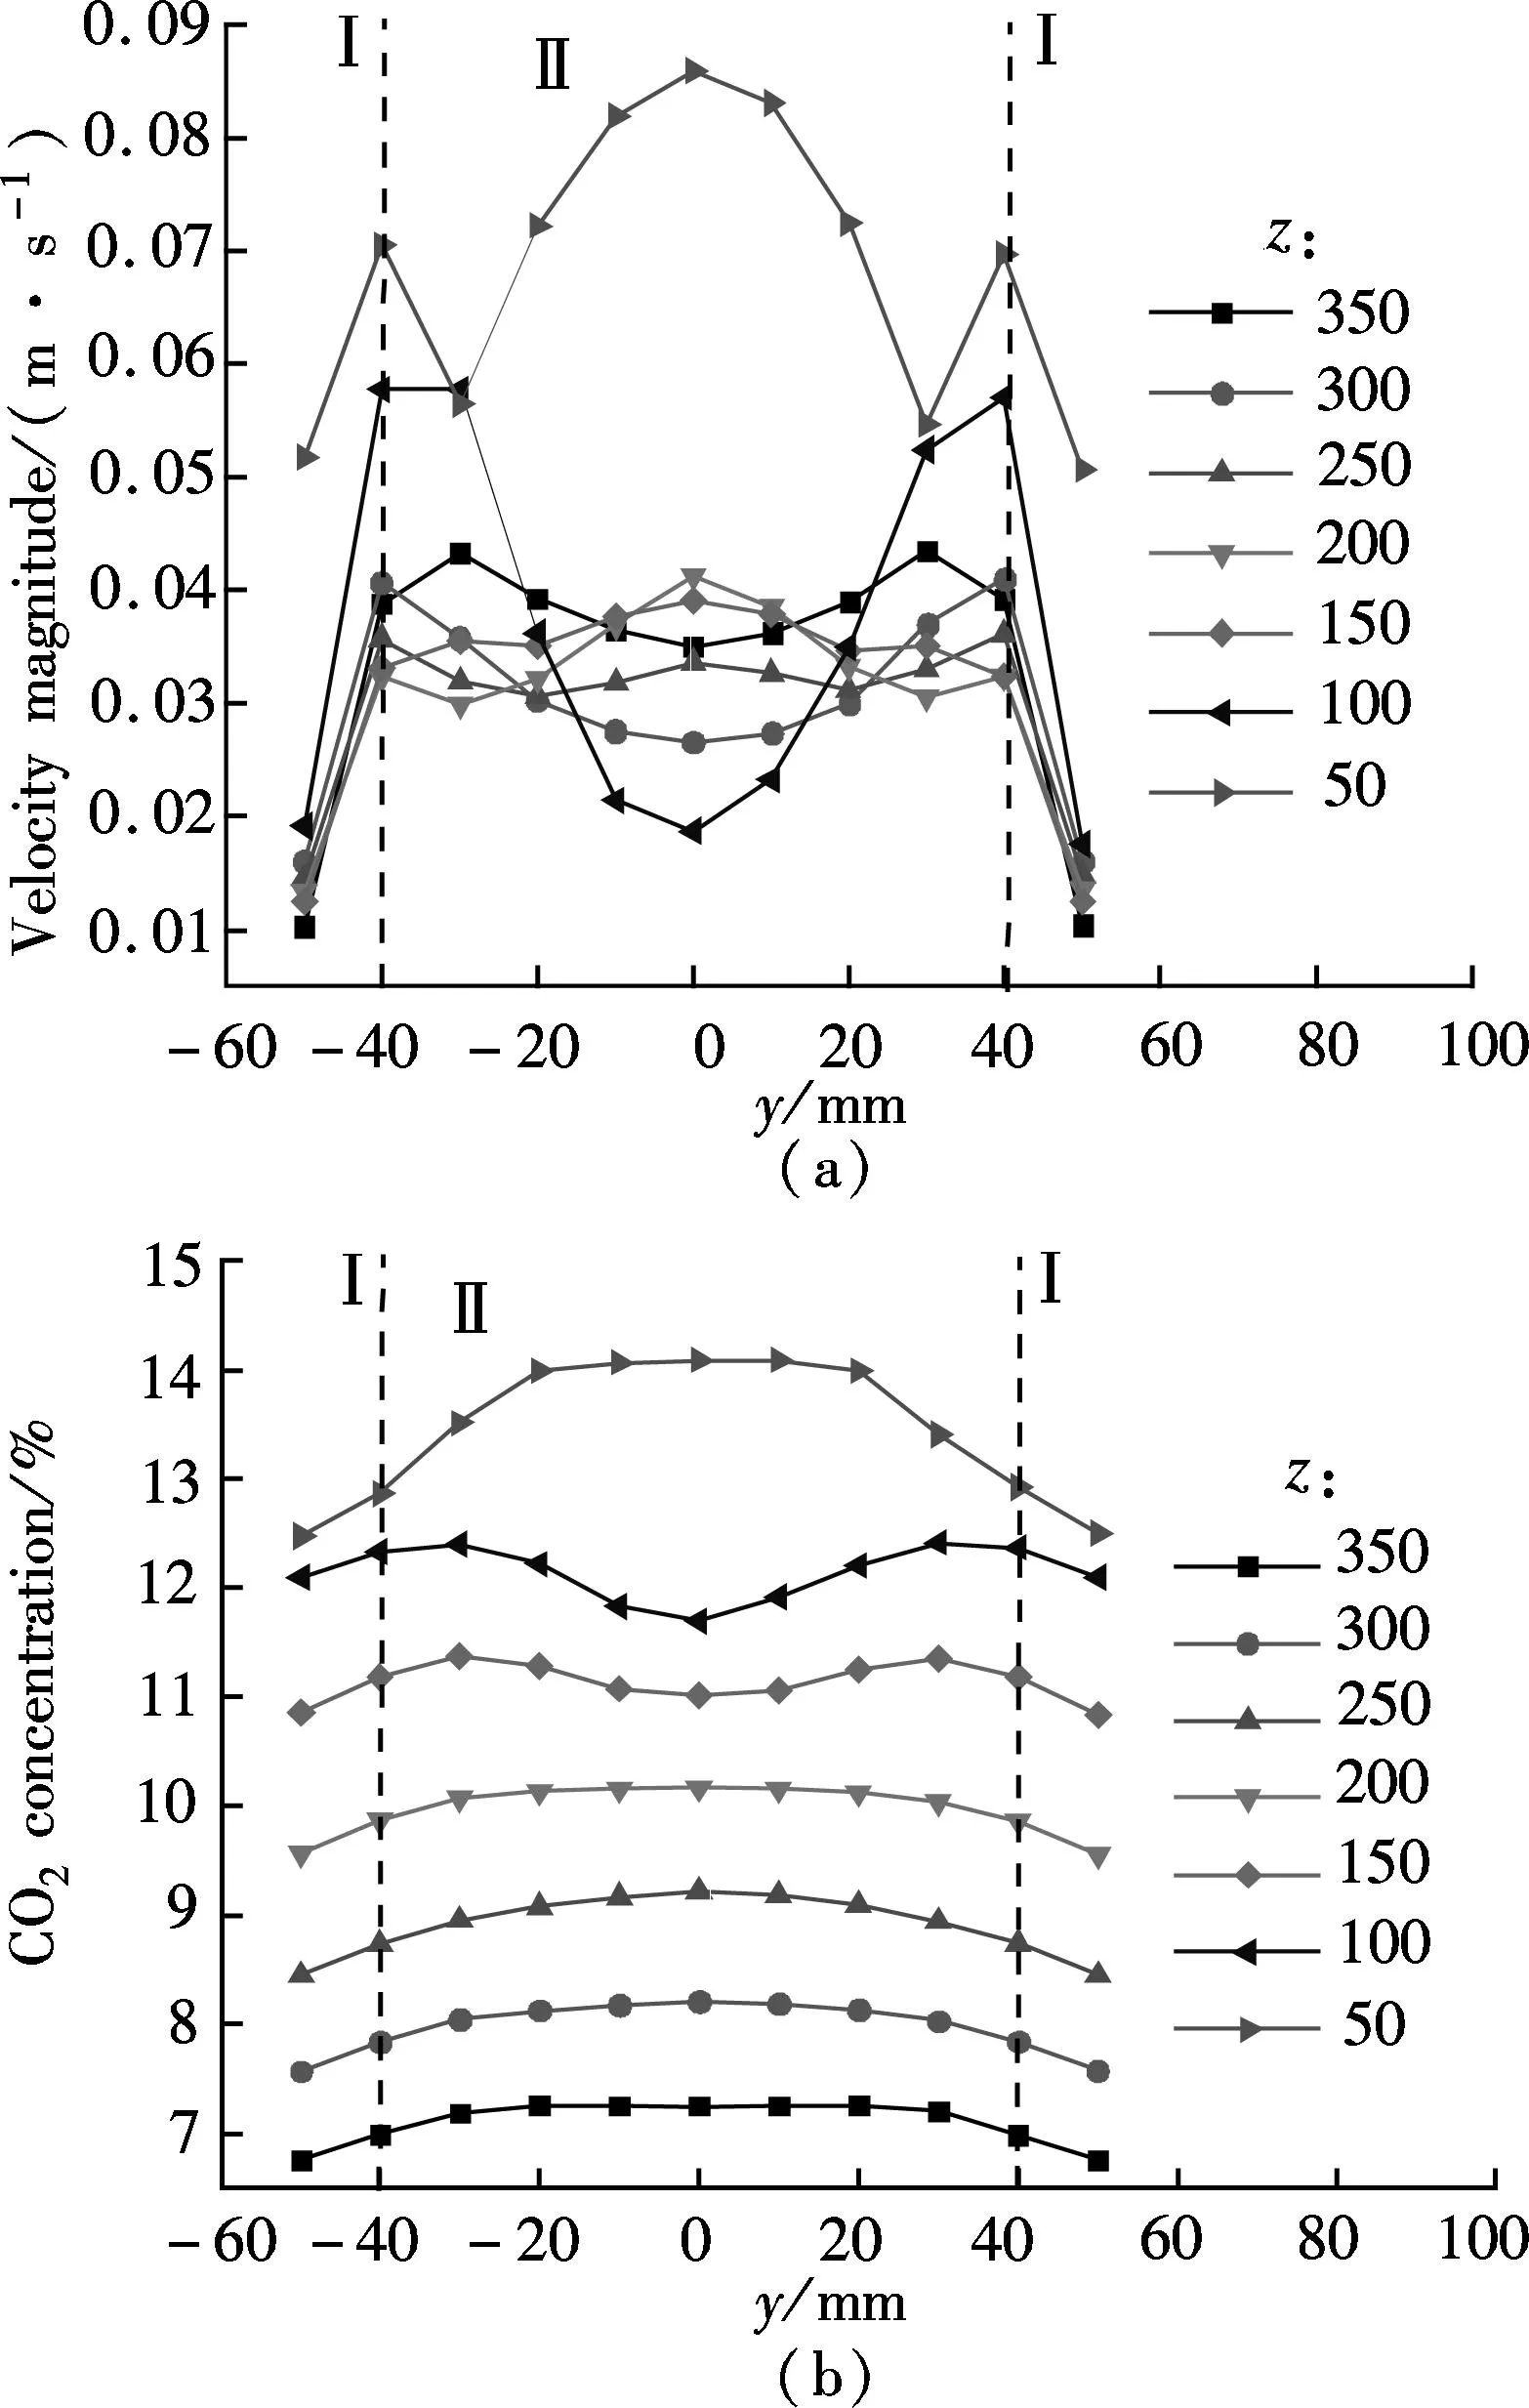
βis defined as the ratio of chemical absorption rate to physical absorption rate. Despite several complex reaction equations accounting for CO2absorption in aqueous ammonia[24-25], the researchers considered it a pseudo-first-order irreversible reaction. In the case that the absorption occurs in the so-called pseudo-first-order regime(3 (11) where isβiis the instant chemical reaction enhancement,Hais the Hatta number;kovis the pseudo-first-order reaction rate selected from the experimental results by Zeng[11]. For liquid droplets generated by pressure-swirl atomizer, Liu et al.[26-27]proposed a method to calculate the overall surface area by the correlation related to the Sauter mean diameter. (12) whereAdis the overall surface area of all the droplets, m2;Qis the total flow rate of spray liquid, m3/s2;WeandRedare the Weber number and Reynolds number, respectively. whereρLandμLare the density and viscosity of flue gas, respectively, kg/m3and Pa·s;σis the surface tension of spray liquid, N/m. Therefore,αcan be estimated as (13) whereVis the total volume of the spray column, m3. Then, we can obtain the CO2absorption rate in the form of mole concentration. (14) KGαis defined as the volumetric overall mass-transfer coefficient, mol·Pa/(m3·s). Therefore, the source term of mass conservative equation,Sm, is expressed as Sm=-NCO2αMCO2=-KGαpCO2MCO2 (15) and the source term of CO2concentration equation,Sc, is expressed as Sc=-NCO2αMCO2=-KGαpCO2MCO2 (16) The above source terms accounting for CO2absorption process are programmed as a user-defined function (UDF) file and loaded into Fluent 6.3 software to complete the numerical simulations. 1.3.2Validation of CO2absorption model Fig.2 shows the comparison of the volumetric overall mass-transfer coefficient from mathematical model data(KGα′) and Zeng’s experimental results (KGα). As can be seen, the relative error is within the trust-region of 10%, suggesting that the CO2absorption model is appropriate for ammonia-based CO2absorption in spray columns. We note that the calculated values from the mathematical model are a little lower than that of experimental result. The discrepancy may come from calculation of the averaged effective gas-liquid interfacial area in the unit volume. In fact, the local effective gas-liquid interfacial area in the unit volume varies in different regions in a spray column. There can be certain error to utilize an averaged one. Moreover, limitation of correlation for the mass-transfer coefficientkL,kGandβmay give rise to a certain deviation. Besides, the variation of two-phase hydrodynamics resulting from the absorption process is ignored, which directly affects the gas-liquid two-phase flow, blend and mass transfer. Seen from the modeling of CO2absorption,αappears in each of the conservation equations of mass, momentum, and concentration. Hence, it is pointed out that accurate modeling of the local effective interfacial area in unit volume is the first step to simulate and predict the mass transfer performance of a spray column[6]. Fig.2 Comparison of the volumetric overall mass-transfer coefficient 2Results and Discussion In this paper, the CO2removal efficiency is defined as (17) whereCoutis the averaged mass concentration of CO2of the outlet andCinis the averaged mass concentration of CO2of the inlet. 2.1.1The effect of ammonia concentration Fig.3 is a typical plot of CO2removal efficiency and ammonia slippage as a function of ammonia concentration in the spray column under the following conditions: the inlet flow of flue gas is 20 L/min; CO2concentration is 15%; aqueous ammonia flow rate is 8 L/h and temperature is 20 ℃. Ammonia concentration has a great impact on CO2removal efficiency and ammonia slippage, and the simulation result is consistent with the experimental data. As the ammonia concentration increases from 2% to 8%, the CO2removal efficiency doubles. The increase of aqueous ammonia concentration increases the free ammonia concentration at the gas-liquid interface, which greatly promotes chemical equilibrium to move forwards and decreases mass-transfer resistance in the liquid phase. As a result, it clearly accelerates the chemical absorption rate and increases CO2removal efficiency. However, it is important to note that the free ammonia of high concentration at the gas-liquid interface can easily spread to the gas phase, leading to secondary pollution. As seen from Fig.3, when aqueous ammonia is at a low concentration(≤4%), the amount of ammonia slippage is less than 0.25%. While aqueous ammonia is at a high concentration(>6%), the amount of ammonia slippage increases exponentially. When the ammonia concentration increases from 6% to 8%, ammonia slippage increases by about 0.9%. In actual application, the ammonia concentration should not be too high in order to avoid a large amount of ammonia slippage. Fig.3 Profile of the effect of ammonia concentration 2.1.2The effect of aqueous ammonia flow rate The variations of CO2removal efficiency and ammonia slippage with the ammonia aqueous flow rate in the spray column are shown in Fig.4 under the following conditions: the inlet flue gas flow rate is 20 L/min; CO2concentration is 15%; the ammonia concentration of ammonia aqueous is 6% and temperature is 20 ℃. In the range of allowable error, the simulation result is in good agreement with the experimental data. As the aqueous ammonia flow rate increases from 8 to 20 L/h, CO2removal efficiency increases by around 9%. The observed little increase in the CO2removal efficiency may be attributed to the restriction of other operating parameters. The CO2absorption rate is notably dependent upon the flow rate of aqueous ammonia. It is also dependent upon the retention time of the flue gas. The aqueous ammonia flow rate promotes CO2removal efficiency in two ways. First, the increase of aqueous ammonia flow rate leads to the reduction in the size of spray droplets and the increase in the number of droplets, which can apparently increaseα. Secondly, owing to the finite chemical reaction rate, the increase in the aqueous ammonia flow rate may increase the concentration of free ammonia at the gas-liquid interface, which is a driving force for chemical absorption. Thus, for aqueous ammonia with high concentration, the effect of the increase of free ammonia concentration at the gas-liquid interface becomes insignificant, leavingαto be the primary factor that increases the CO2removal efficiency. On the other hand, the increase of free ammonia concentration at the gas-liquid interface leads to the increase of ammonia slippage. When the aqueous ammonia flow rate increases from 12 to 20 L/h, ammonia slippage increases by approximately 0.4%. From the comparison of Fig.4 and Fig.3, it is concluded that ammonia slippage growth resulting from the increase of the aqueous ammonia flow rate is not so dramatic as that resulting from the increase of ammonia concentration. A suggestion for industrial application is that low concentration and appropriately excessive aqueous ammonia should be used to maintain high CO2removal efficiency and low ammonia slippage. Fig.4 Profile of the effect of aqueous ammonia flow rate 2.1.3The effect of the flue gas flow rate Fig.5 illustrates the variations of CO2removal efficiency and ammonia slippage with the flue gas flow rate under the following conditions: the ammonia aqueous flow rate is 16 L/min; CO2concentration is 15%; the ammonia concentration is 6% and the temperature is 20 ℃. As is seen, the simulation curve has the same trend as the experimental data, with a large error at a high flow rate of flue gas. With the flow rate of flue gas increasing from 10 to 28 L/min, the CO2removal efficiency reduces by nearly 30%. In a specific spray column, the increase of flue gas flow rate means an increase in the flue gas velocity. To some degree, the increase of flue gas velocity enhances gas-phase turbulence, which decreases gas-phase mass transfer resistance and promotes gas-liquid mass transfer. However, the increase of flue gas velocity greatly shortens gas-liquid two-phase contact time, which weakens the gas-liquid two-phase blend and mass transfer. The ultimate outcome is the reduction of CO2removal efficiency. On the other hand, the negative impact on gas-liquid mass transfer reduces CO2absorption flux, which substantially increases pH at the gas-liquid interface and causes ammonia volatilization into gas phase[28]. When the flue gas flow rate increases from 10 to 20 L/min, ammonia slippage increases by about 0.1%. While the flue gas flow rate increases from 20 to 28 L/min, ammonia slippage increases by about 0.3%.Thus, in actual application, a spray column should operate under the condition of the designed standard flue gas amount to avoid massive ammonia slippage. Fig.5 Profile of the effect of flue gas flow rate Comparing simulated and experimental CO2removal efficiency, it is concluded that the comprehensive CFD model is appropriate for predicting ammonia-based CO2absorption in the spray column. It should be noted that the simulation value is a little smaller than that of experimental result. The following reasons are responsible for the discrepancy. First, the calculational error of the volumetric overall mass-transfer coefficient directly causes the error of CO2removal efficiency. Secondly, the local reflux of flue gas in the spray column is ignored in the numerical simulation, which lengthens gas-liquid contact time and strengthens gas-liquid mass transfer. It is notable that, in actual application, the ammonia that is emitted into the atmosphere is much less than that of the numerical simulation. On the one hand, the volatilization model of the multi-component droplet is not accurate for the electrolyte solution with chemical reactions. On the other hand, the water wash apparatus connected to the outlet of spray column can tremendously reduce ammonia emissions into the atmosphere[29]. It is found that both pressurized operation and water scrubbers can reduce ammonia slippage[8]. Besides, adopting the modified solution by adding additives(PZ, ionic liquids,Cu2+etc.) to aqueous ammonia can effectively decrease ammonia slippage[30]. From the above result, the maximum CO2removal efficiency is around 75% when the flue gas flow rate is 20 L/min. In order to improve CO2removal efficiency, further study on the correlation of velocity field and CO2absorption is shown in this section. 2.2.1Parameters distribution field Two-phase parameters distribution are presented in Fig.6 to Fig.10, which are simulated under the conditions that the artificial flue gas flow rate is 20 L/min; the inlet CO2concentration is 15%; the ammonia concentration is 4% and the aqueous ammonia flow is 8 L/h. Fig.6 shows the three-dimensional distribution of the gas phase velocity magnitude. As seen from Fig.6(a) that after entering the inlet, except for a little flue gas circling on the rich solution level, most of the flue gas impinges against the left wall, forming a high velocity zone along the left wall between the elevation of about 50 and 120 mm. The impingement causes the flow direction of flue gas to turn to the right side. This can be clearly observed in the velocity vector distribution(see Fig.7(a)). While the flue gas changes flow direction, a swirl zone with a low velocity is produced above the inlet, as shown in Fig.7(b). Then, with the flue gas flowing upwards, a high velocity zone along the right wall between elevation of about 150 and 250 mm occurs. As seen from Fig.6(b), the velocity distribution on the longitudinal sectionx=0 is symmetric. Except for a high velocity zone and a low velocity zone affected by gas entrance, the flow field is relatively uniform. Fig.6(c) shows the radical variation of velocity magnitude at different elevations (z=50, 100, 150, 200, 250, 300, 350, 400 mm). Fig.7(c) shows the droplet trajectory distribution. Droplets with longer residence time exist in the bottom region of the column. Fig.6 Velocity magnitude distribution on longitudinal sections and horizontal sections.(a) x=0;(b) y=0;(c) Elevations Fig.7 Parameter distribution.(a) Velocity vector distribution;(b) Gas phase pathlines;(c) Particle distribution The three-dimensional distribution of CO2concentration in the spray column is shown in Fig.8. Seen from the color of longitudinal sections (Figs.8(a) and (b)), the CO2concentration value decreases gradually with the flue gas flowing up. However, many contour lines of CO2concentration are not level, indicating that the radical distribution of CO2concentration is not equal at the same horizontal plane. Similar to velocity distribution, CO2concentration distribution on longitudinal sectionx=0 is symmetric. Horizontal sections at different elevations are shown in Fig.8(c), includingz=50, 100, 150, 200, 250, 300, 350, 400 mm. As can be seen, a local radical difference of CO2concentration generally exists. This is caused by a radical deviation of gas velocity. As is known, the increase of local gas velocity enhances gas phase turbulence and strengthens gas-liquid mass transfer, thus leading to the decrease in the local liquid-gas ratio. Thus, the influence of local gas velocity on CO2concentration is the result of the combination of local turbulence and local liquid-gas ratio. This is in agreement with Ref.[19]. Fig.9 and Fig.10 show the velocity magnitude and CO2concentration distribution on longitudinal sections. The figures can be divided into two regions: region Ⅰ and region Ⅱ. Region Ⅰ is the region near the wall. In region Ⅰ, when the area is far from the wall, the gas velocity and CO2concentration are high. This is because the resistance for gas flow is large in the area near the wall. Region Ⅱ is the region where the gas flow field significantly affects CO2concentration distribution. Fig.8 CO2 concentration on longitudinal sections and horizontal sections.(a) x=0;(b) y=0;(c) Elevations Fig.9 Velocity magnitude and CO2 concentration distribution on longitudinal section y=0.(a) Velocity magnitude distribution; (b) CO2 concentration distribution Fig.10 Velocity magnitude and CO2 concentration distribution on longitudinal section x=0.(a) Velocity magnitude distribution; (b) CO2 concentration distribution The influence of local gas velocity on the radical distribution of CO2concentration is shown in Fig.9 and Fig.10. From Figs.9(a) and (b), it can be seen that whenz=100, 150 and 250 mm, the CO2concentration is low in the area where the gas velocity is high. This means that the increase in the local gas velocity can decrease the local CO2absorption rate, indicating that the liquid-gas ratio is the main factor for CO2absorption on these elevations. However, whenz=200 and 350 mm, the CO2concentration remains even in the area where the gas velocity is high. This can be explained by the contribution made by local turbulence and the liquid-gas ratio which may be counteracted. A similar phenomenon can be found in Figs.10(a) and (b). The radical distribution of CO2concentration becomes more uniform when the column elevation increases. 2.2.2Optimized parameters distribution field From the analysis above, the high velocity zone in the local region weakens the local CO2absorption rate to some degree. Due to its capability of effectively organizing gas flow, the orifice plate is arranged in the simulation model(z=80 mm) to optimize the parameters distribution field under the same operation conditions. Fig.11 and Fig.12 show the three-dimensional distribution of gas phase velocity magnitude and CO2concentration after arranging the orifice plate. Comparing Fig.6 and Fig.11, it is clear that after arranging the orifice plate, the swirl zone above the inlet and two high velocity zones disappear. The impingement phenomenon no longer occurs and the gas phase velocity in the spray column becomes more uniform. The orifice plate has a positive effect on organizing gas flow and preventing reflux. Comparing Fig.8 and Fig.12, it is clear that at the same elevation, the contour lines of CO2concentration become greater even after arranging the orifice plate, indicating that the radical distribution of CO2concentration become more uniform. This is due to the reduction of the radical deviation of gas velocity. Fig.11 Velocity magnitude distribution on longitudinal sections and horizontal sections.(a) x=0;(b) y=0;(c) Elevations Fig.12 CO2 concentration on longitudinal sections and horizontal sections.(a) x=0;(b) y=0;(c) Elevations Fig.13 is the plot of the variation of CO2removal efficiency with spray column elevation. The CO2concentration at different horizontal planes is the averaged value by surface integration. As can be seen, CO2removal efficiency increases rapidly below the spray layer (300 mm) due to the high absorbent droplets concentration and large gas-liquid mass-transfer area. While CO2removal efficiency increases slightly above the spray layer since there is few absorbent droplets except for those entrained. The slope of these curves decreases with the increase of elevation. This means that CO2removal amount within the unit height column decreases with the increase of elevation. This can be explained, with the flue gas flowing up, CO2is absorbed gradually, and the reduction of CO2partial pressure leads to the decrease of CO2absorption rate. Additionally, when the orifice plate is arranged, CO2removal efficiency on each horizontal plane is improved a little, and the ultimate CO2removal efficiency is improved by around 4%. Fig.13 Variation of CO2 removal efficiency with elevation 3Conclusion 1) The increase of aqueous ammonia flow rate and ammonia concentration can both promote CO2removal efficiency, but ammonia slippage growth resulting from the increase in aqueous ammonia flow rate is not so dramatic as that resulting from the increase of ammonia concentration. The increase in flue gas flow rate can decrease CO2removal efficiency and increase ammonia slippage. 2) Local gas velocity has a significant influence on the radical CO2concentration distribution. The influence of local gas velocity on local CO2absorption rate is the result of the combination of local turbulence and local liquid-gas ratio. 3) By arranging an orifice plate on the physical model, the high gas velocity zone and large vortex are eliminated and the ultimate CO2removal efficiency is improved by about 4%. References [1]Yeh A C, Bai H L. Comparison of ammonia and monoethanolamine solvents to reduce CO2 greenhouse gas emissions[J].ScienceoftheTotalEnvironment, 1999, 228(2/3):121-133. [2]Kuntz J, Aroonwilas A. Performance of spray column for CO2capture application[J].Industry&EngineeringChemistryResearch, 2007, 47(1):145-153. [3]Lim Y, Choi M, Han K, et al. Performance characteristics of CO2capture using aqueous ammonia in a single-nozzle spray tower[J].Industry&EngineeringChemistryResearch, 2013, 52(43):15131-15137. [4]Niu Zhenqi, Guo Yincheng, Lin Wenyi. Carbon dioxide removal efficiencies by fine sprays of MEA, NaOH and aqueous ammonia solutions[J].JournalofTsignhuaUniversity, 2010, 50(7):1130-1140.(in Chinese) [5]Javed K H, Mahmud T, Purba E. The CO2capture performance of a high-intensity vortex spray scrubber [J].ChemicalEngineeringJournal, 2010, 162(2): 448-456. [6]Zhang D S, Deen N G, Kuipers G A M. Euler-Euler modeling of flow, mass transfer, and chemical reaction in a bubble column[J].Industry&EngineeringChemistryResearch, 2009, 48(1): 47-57. [7]Zhang D S. Eulerian modeling of reactive gas-liquid flow in a bubble column[D]. Enschede, The Netherlands: University of Twente, 2007. [8]Yu Hai, Morgan S, Allport A, et al. Results from trialling aqueous NH3based post-combustion capture in a pilot plant Munmorah power station:absorption[J].ChemicalEngineeringResearchandDesign, 2011, 89(8): 1204-1215. [9]Liu Guobiao. Computational transport and its application to mass transfer and reaction processes in packed-beds[D]. Tianjin: School of Chemical Engineering, University of Tianjin, 2006.(in Chinese) [10]Lu Tongchang. Experimental research and CFD simulation of ammonia absorption of CO2from flue gas [D]. Baoding: School of Energy, Power and Mechanical Engineering, North China Electrical Power University, 2013.(in Chinese) [11]Zeng Qing. The experimental investigation on CO2absorption by aqueous ammonia[D]. Beijing: School of Aerospace Engineering, TsingHua University, 2011.(in Chinese) [12]Zhu Jie, Wu Zhenyuan, Ye S, et al. Drop size distribution and specific surface area in spray tower[J].JournalofChemicalIndustryandEngineering, 2014, 65(12):4710-4715.(in Chinese) [13]Cai Bin, Li Lei, Wang Zhaolin. Numerical analysis of liquid droplet breakup in airflow[J].JournalofEngineeringThermophysics, 2003, 24(4):613-616. (in Chinese) [14]Du Zhanbo,Mao Jingru, Sun Bi. Measurements of droplet sizes at mid-hight of stationary turbine blades and analysis of the critical weber number[J].JournalofPowerEngineering, 2005, 25(5):643-684.(in Chinese) [15]Li Tongming. Coalescence between small bubbles or droplets[J].JournalofChemicalIndustryandEngineering, 1994, 45(1):38-44.(in Chinese) [16]Li Tongming, Zhao Liyan. The influence of interfacial rheological property on coalescence process of small droplet[J].ActaPhysico-ChimicaSinica, 1996, 12(8):708-714.(in Chinese) [17]Yu Guocong, Yuan Xigang.Computationalmasstransferintroductionforchemicalengineeringprocess[M]. Tianjin: Tianjin University Press, 2011.(in Chinese) [18]Fluent Inc.Fluent user’s guide[EB/OL]. (2006-09)[2015-05-15]. http://wenku.baidu.com/link?url=MU4BlrL5d_b-uHKVD41mdubXvw94p9FQ22UXE_EQStKH5piDiYVwDgCPcT4Ib43S5D5rMRVAdy-XsC2V E9RYpidwEi_fd8jSzaoDya4eX9a. [19]Zhong Yi, Gao Xiang, Wang Huiting, et al. The performance optimization of the wet flue gas desulfurization system based on CFD[J].ProceedingsoftheCSEE, 2008, 28(32):18-23.(in Chinese) [20]de Montigny D, Tontiwachwuthikul P, Chakma A. Comparing the absorption performance of packed columns and membrane contactors[J].Industry&EngineeringChemistryResearch, 2005, 44(15):5726-5732. [21]Warych J, Szymanowski M.Model of the wet limestone flue gas desulfurization process for cost optimization[J].Industry&EngineeringChemistryResearch, 2001, 40(12):2597-2605. [22]Derks P W J, Versteeg G F. Kinetics of absorption of carbon dioxide in aqueous ammonia solutions[J].EnergyProcedia, 2009, 1(1):1139-1146. [23]Liu Jinzhao, Wang Shujuan, Qi Guojie, et al. Kinetics and mass transfer of carbon dioxide absorption into aqueous ammonia[J].EnergyProcedia, 2011(4): 525-532. [24]Liu Jinzhao,Wang Shujuan, Zhao Bo, et al. Absorption of carbon dioxide in aqueous ammonia[J].EnergyProcedia, 2009, 1(1):933-940. [25]Bai H L, Yeh A C. Removal of CO2greenhouse gas by ammonia scrubbing[J].Industry&EngineeringChemistryResearch, 1997, 36(6):2490-2493. [26]Liu Nailing, Zhang Xu. Experimental study of atomization characteristic of pressure spiral nozzle[J].JournalofExperimentsforFluidMechanics, 2006, 20(3):8-12.(in Chinese) [27]Chen Hongyu, Liu Guorong. The theoretical study of a novel water-spraying desulfurization by aqueous ammonia[J].GeneralMachinery, 2007(4):23-26.(in Chinese) [28]Budzianowski W M. CO2reactive absorption from flue gases into aqueous ammonia solutions: the NH3slippage effects[J].EnvironmentProtectionEngineering, 2011, 37(4):5-19. [29]Li Liqing, Zhang Chun, Huang Guijie, et al. A multicomponent droplet model in simulating mass transfer of the ammonia-based spray process[J].ProceedingsoftheCSEE, 2014, 34(32):5741-5749.(in Chinese) [30]Liu Xi. Experimental research on effects of additives to the ammonia-based CO2capture process[D]. Nanjing: School of Energy and Environment, Southeast University, 2014.(in Chinese) doi:10.3969/j.issn.1003-7985.2015.04.009



2.1 Analysis of CO2 removal efficiency and ammonia slippage

2.2 Parameters distribution field and optimization




杂志排行
Journal of Southeast University(English Edition)的其它文章
- Mitigation of inter-cell interference in visible light communication
- Modified particle swarm optimization-based antenna tiltangle adjusting scheme for LTE coverage optimization
- Distribution algorithm of entangled particles for wireless quantum communication mesh networks
- Kernel principal component analysis networkfor image classification
- Simulation and performance analysis of organic Rankine cycle combined heat and power system
- Experimental investigation on heat transfer characteristics of a new radiant floor system with phase change material
