Analytical method of minimum spacing of signalized intersectionson bidirectional two-lane highways
2015-03-01MaYongfengYuanLiZhangWenbo
Ma Yongfeng Yuan Li Zhang Wenbo
(1School of Transportation, Southeast University, Nanjing 210096, China)(2College of Civil and Transportation Engineering, Hohai University, Nanjing 210098, China)(3Department of Civil Engineering, Purdue University, West Lafayette, IN 47907, USA)
Analytical method of minimum spacing of signalized intersectionson bidirectional two-lane highways
Ma Yongfeng1Yuan Li2Zhang Wenbo3
(1School of Transportation, Southeast University, Nanjing 210096, China)(2College of Civil and Transportation Engineering, Hohai University, Nanjing 210098, China)(3Department of Civil Engineering, Purdue University, West Lafayette, IN 47907, USA)
Abstract:In order to improve the smoothness of traffic flow on bidirectional two-lane highways, an analytical method is proposed to optimize the minimum spacing of the signalized intersections. The minimum signal spacing is determined by two parts, including the necessary distance for stabilizing the traffic flow after it passes through the signalized intersections and the length of the upstream functional area of intersection. For the former, based on the platoon dispersion theory, the stable distance determination problem of traffic flow is studied and a model of dispersion degrees varying with the distance from the upstream intersection is presented, in which the time headway is intended to yield the shifted negative exponential distribution. The parameters of the model for arterial and collector highways are estimated respectively based on the field data. Then, the section at which the slope of dispersion degree curve equals -0.1 is regarded as the beginning of the dispersion stable state. The length of the intersection upstream functional area is determined by three parts, including the distance traveled during perception-reaction time, the distance traveled while a driver decelerates to a stop, and the queue storage length. Based on the above procedures, the minimum signal spacing of each highway category is proposed.
Key words:highway; signalized intersection; spacing; platoon dispersion
Received 2015-01-30.
Biography:Ma Yongfeng (1980—), male, doctor, associate professor, mayf@seu.edu.cn.
Foundation item:The National Natural Science Foundation of China (No.51208100, 51308192).
Citation:Ma Yongfeng, Yuan Li, Zhang Wenbo. Analytical method of minimum spacing of signalized intersections on bidirectional two-lane highways[J].Journal of Southeast University (English Edition),2015,31(4):547-552.[doi:10.3969/j.issn.1003-7985.2015.04.020]
Intersection spacing is an important element in highway design and can greatly affect the operational efficiency and traffic safety. Closely-spaced or irregularly-spaced traffic signals on arterial or collector roadways can result in frequent stops, unnecessary delays, increased fuel consumption, excessive vehicular emissions, and high crash rates[1-4]. Wang et al.[5]examined 161 road segments of eight suburban arterials in Shanghai. Their modeling results showed that the density of signal spacing along arterials had a significant influence on minor injuries, severe injuries, and total crash frequencies; and non-uniform signal spacing had a significant impact on the occurrence of minor injury crashes. A long signal spacing interval increased the range of the cycle lengths and speeds, which can produce efficient traffic progression. When the signals are installed at a suboptimal location, a corresponding reduction in the through band or time will occur. Moreover, increasing signalized intersections per mile resulted in more stop-and-go movement, which may lead to more fuel consumption and vehicular emissions[1].
Some indices have been introduced to research the intersection spacing, such as the weaving section distance, the additional left-turn lane, sight distance, deceleration lane distance, and traffic management, etc. AASHTO[6]indicates that the length between accesses and intersections should be not less than the length of the functional area of at-grade intersections. Generally speaking, few studies emphasized traffic flow characteristics. On the segment between two signalized intersections, the traffic flow characteristics present “turbulence-transition-stable moving-transition-turbulence”[4]. Due to the compression and splitting at signal lights, traffic flow is separated into series and moves downstream in platoons. Vehicles in platoons travel at different speeds due to the driving behaviors of drivers and the maneuvering characteristics of vehicles. While moving downstream, the platoon starts spreading out in a long segment. At the beginning, vehicles move at low speeds, are at small headways, and clusters, which can be seen as turbulence. Afterwards, vehicles speed up and attain suitable headways and similar operating states, which can be regarded as stable movement. This phenomenon, known as platoon dispersion, has been studied by many researchers[7-11]. Platoon dispersion is a procedure for determining the deterioration of platoon integrity, which means a change in the compactness of a platoon depending on the time[9].
The purpose of this paper is to introduce a procedure to measure the minimum spacing of signalized intersections on bidirectional two-lane highways. Based on the platoon dispersion theory, an analytical method is proposed and calibrated. Furthermore, the minimum spacing criteria for bidirectional two-lane highways are computed.
1Methodology
1.1 Definition of minimum spacing
According to the platoon dispersion theory, when the traffic flow departs from the upstream signalized intersection, the speed of each vehicle is affected by the speed of others, resulting in a high inter-vehicles influence degree. With the platoon moving downstream, the mean speed increases, some vehicles begin to overtake others, the inter-vehicles influence degree decreases, and the traffic flow ultimately reaches a stable state, meanwhile, the vehicles basically achieve their expected speeds. Before this, the traffic flow should not be affected by the downstream intersection. For presentation purposes, the platoon dispersion degree is adopted to express the inter-vehicles influence. The mathematical form of the minimum spacing is

(1)
with
d2=l1+l2+l3
The functional intersection area is critical to its function, in which motorists respond to the intersection, decelerate, and maneuver into the appropriate lane to stop or to complete a turn. It consists of the distance during perception-reaction time, the distance for maneuvering and deceleration, and the length of the queue storage, as shown in Fig.1. The current procedure and parameter values, which are used to determine the upstream functional intersection area, can be found in Refs.[1,4]. The emphasis in this paper is on determining the vehicles’ platoon stable distanced1.

Fig.1 Illustration of minimum spacing
1.2 Platoon stable distance
The number of traffic conflicts is minimum when the platoon is completely in a dispersion state. Therefore, the platoon dispersion degree can be used to measure the safety performance of different road sections. The higher the platoon dispersion degree, the larger the headway, which means a high level of safety performance. The time headway is introduced to specify the platoon dispersion degree,

(2)
whereRis the platoon dispersion degree in the traffic flow;nis the total number of vehicles;f(hi) is the influence function between vehicles;hiis the time headway between vehicles, s;h0is the time headway threshold when vehicles have no effect on each other, s;hminis the minimum safe time headway threshold, s.
WhenR=1, the traffic flow is under a free flow state; whenR=0, it is in a congested state. Using the platoon dispersion degree to describe the freedom degree of the traffic flow is a solid basis for studying the platoon dispersion process.
1.2.1Relationship between volume and dispersion degree
For a two-lane highway, the time headways yield different distribution forms under various traffic flow conditions. Each distribution form has its special characteristics and limitations. The shifted negative exponential distribution, which is not complicated and commonly suitable for low to medium volume conditions, was adopted in this paper. This distribution form can satisfy the precision requirement[10]. The mathematical form of the distribution is


(3)
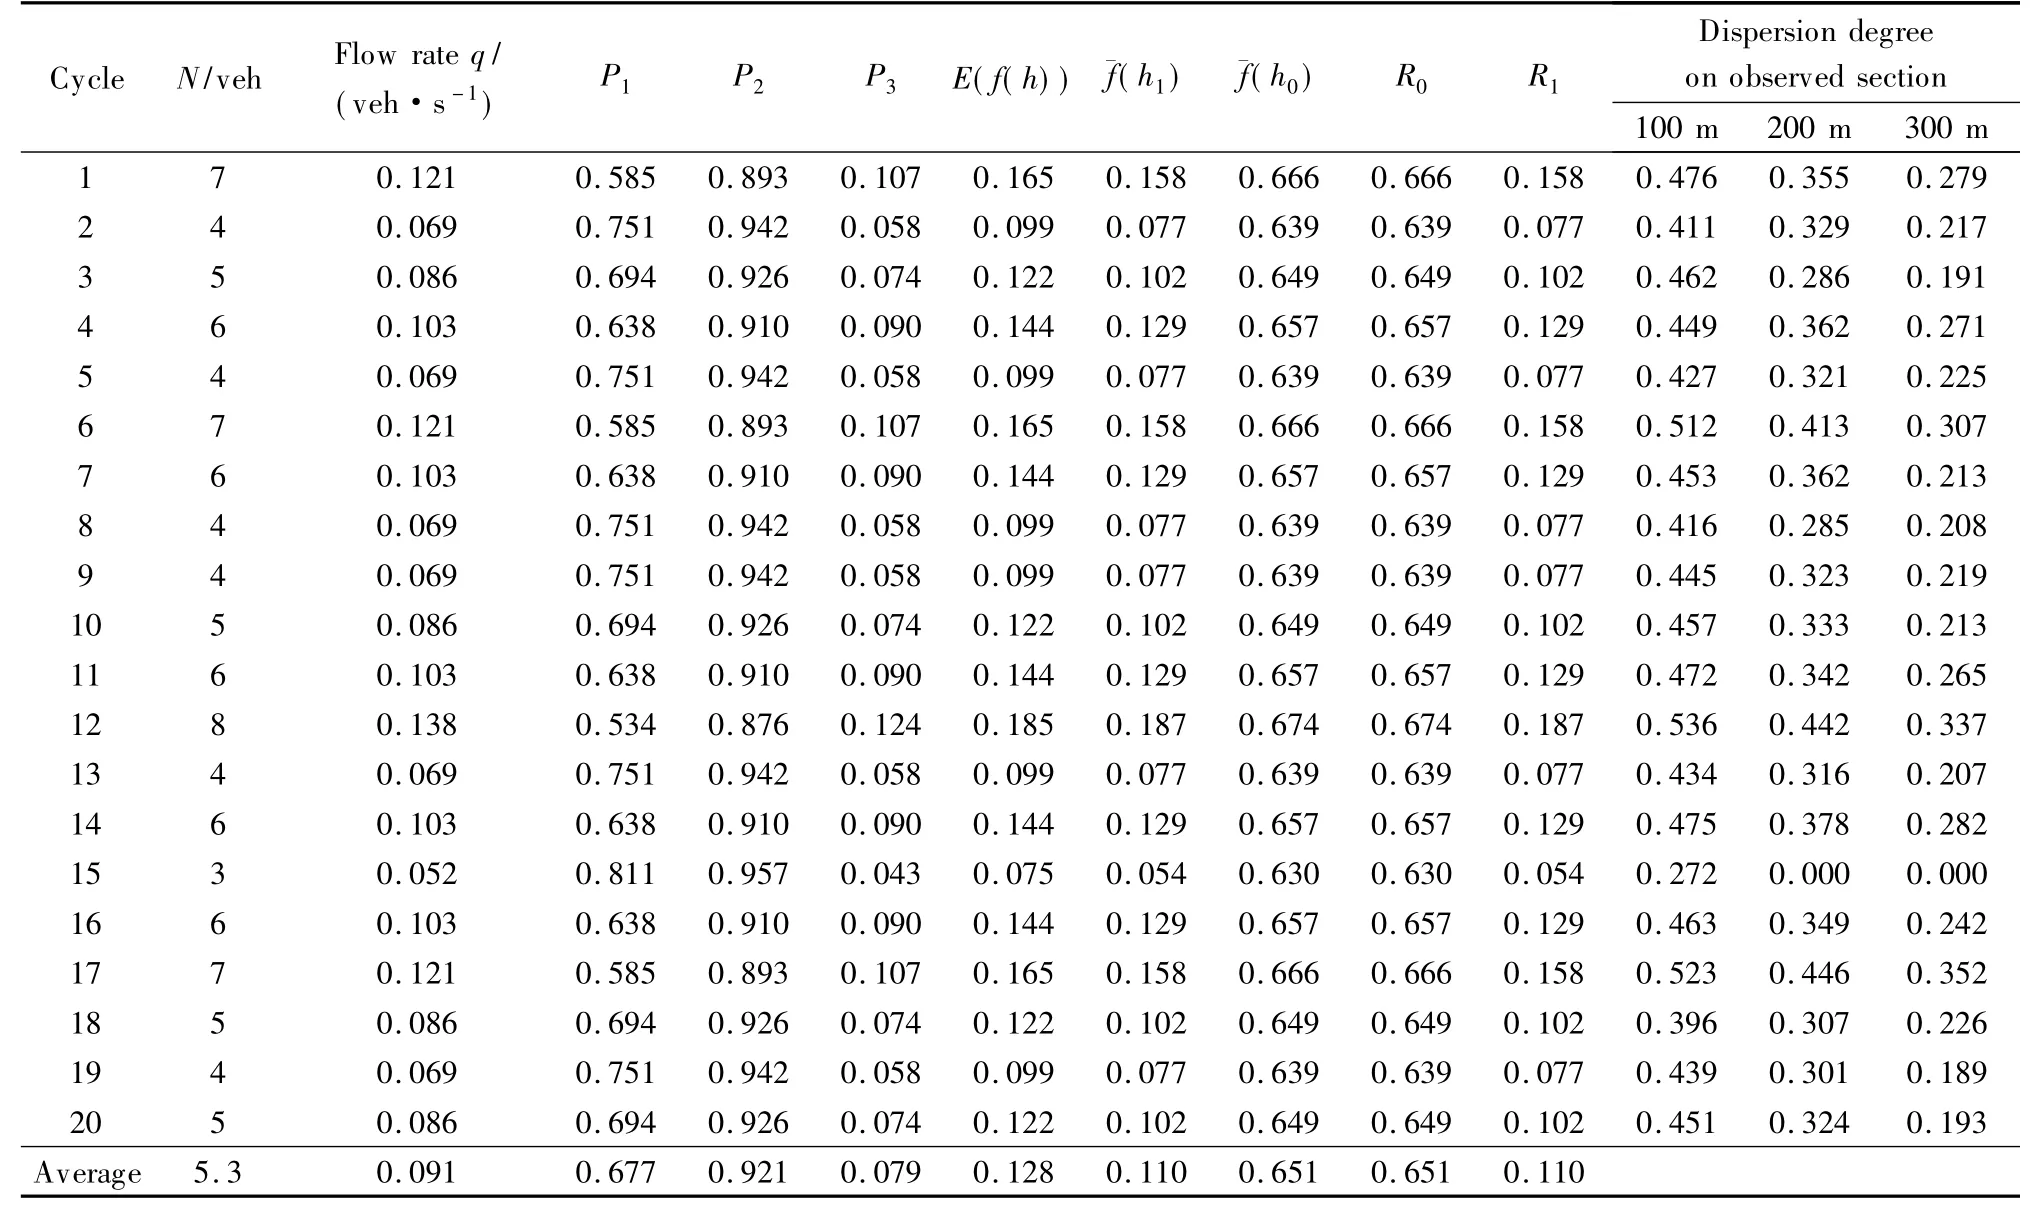
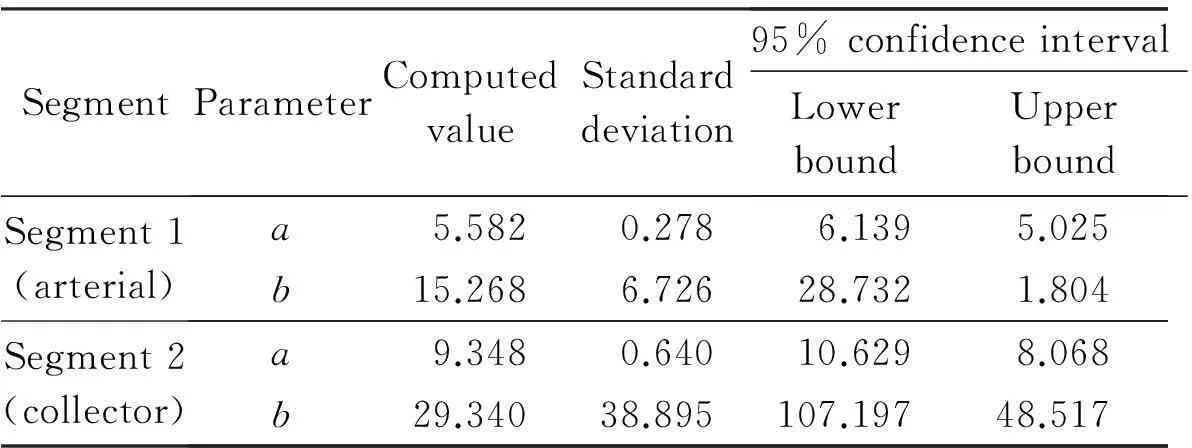
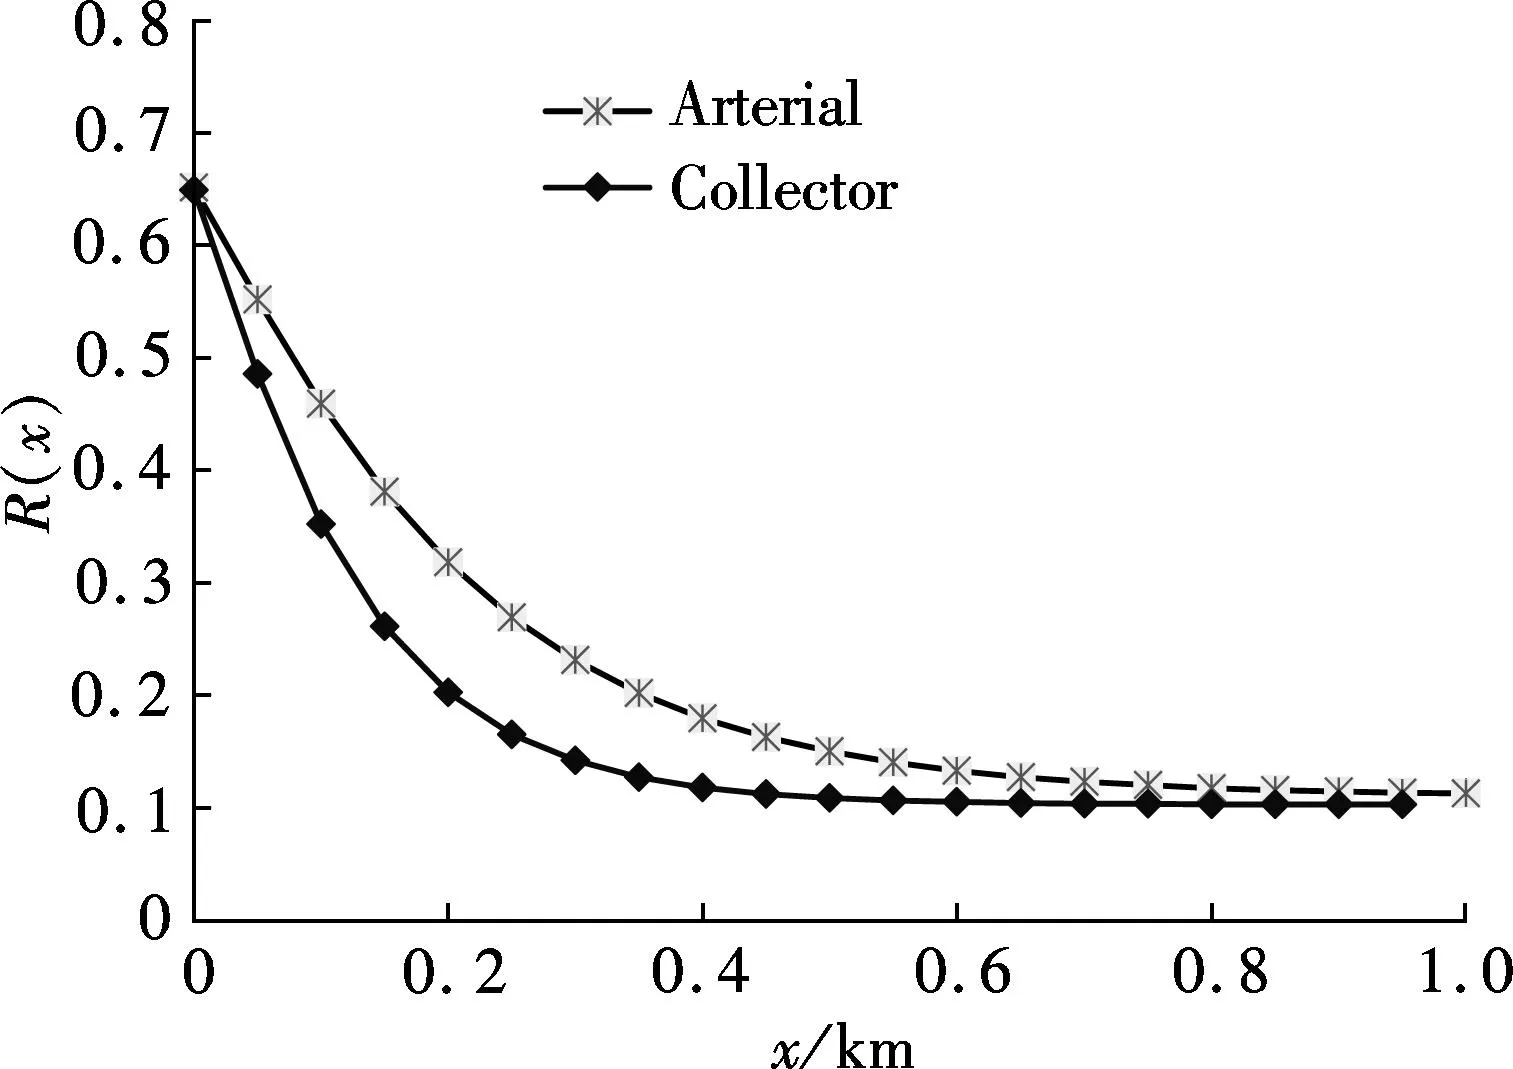
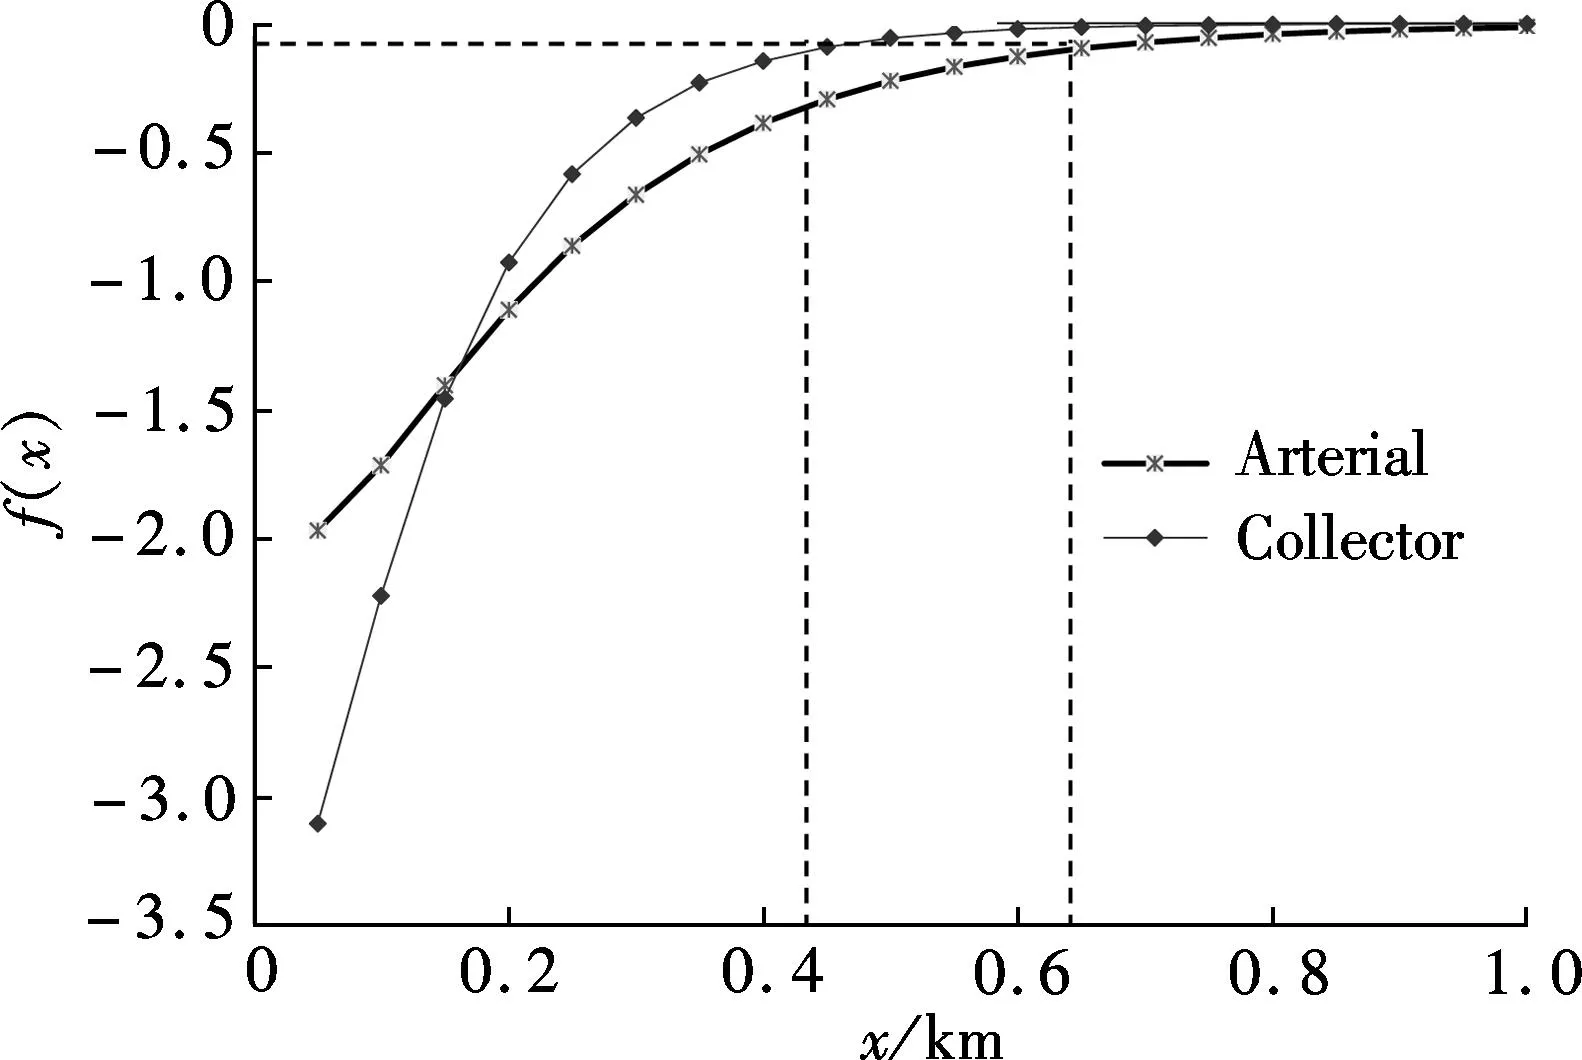
whereqis the traffic flow rate, veh/s;τis the parameter estimation value, which can be estimated by the sample mean and variance, and its value interval is [1.0,1.5]. The time headway distribution is usually divided into three states: the overtaking state (0 According to the definition of dispersion degreeRand influence degree functionf(h), whenh≥h0,f(h)=0; whenh≤hmin,f(h)=1; and for vehicles whose headway yieldsh∈{hmin,h0}, the mean influence degree yields the following equation: (4) Based on the calculated probabilities, Eq.(4) and the definition of influence degree functionf(h), the arithmetic mean value of the influence degree function under the dispersion stable state can be computed using the following equation: (P2-P1)E[f(h)]+(1-P2) (5) In Eqs.(4) and (5), the computation ofP1,P2can refer to Ref.[10]. Therefore, the expression of the dispersion degreeR1under stable state is (6) 1.2.2Dispersion degree when vehicles departing When vehicles pass through an intersection, the traffic flow condition consists of two parts: 1) During the early green period, traffic flow is under saturation traffic flow, and 2) During the late green period, traffic flow is under the non-saturation state. In order to simplify the calculation, the number of vehicles that arrive in each cycle is assumed to yield a uniform distribution, then Nu=Q-N=qc-q(r+t) (7) with (8) 1.2.3Model of dispersion degree along the segment Based on the above analysis, the dispersion degree along the segment can be figureted. Whenx=0,R=R0; whenx=∞,R=R1. Hence, the dispersion degree yields the following equation: R(x)=R0exp(-ax)+R1(1-exp(-bx))(9) whereR(x) is the dispersion degree value at a certain section which isxaway from the upstream intersection;aandbare the undetermined constants;xis the distance between the control point and the upstream intersection, km. The parametersaandbin Eq.(9) can be estimated by the field data, which should be collected from at least two control points. In order to ensure the precision of the estimation, four control points are investigated in this study on the spot, where the investigated results at 0 m are adopted in the parameter estimation. 2Data Collection The field surveys were carried out on sections of arterial highways and collector highways. The following criteria were used in selecting and observing the sample road segments: 1) Independent, fixed period and two-phase signalized intersection; 2) Low external disturbance, low non-motorized vehicles, and pedestrians flow; 3) Low lateral interference within 500 m of an intersection downstream area (e.g., driveway); 4) The distance to the downstream intersection is longer than 1 000 m; 5) The wide field of vision, favorable for the arrangement of traffic survey equipment. Segment 1Intersection “S122-G312” is located in Jiangsu province, signalized by a signal cycle of 58 s. The exit segment on S122 from west to east was observed. S122 belongs to the minor arterial highway (2B access classification) with a design speed of 80 km/h. Segment 2Signalized intersection “Danyang Road-G312” is located in Jiangsu province, with a signal cycle of 52 s. The exit segment from west to east on Danyang Road was observed. Danyang Road belongs to the 3C access classification with a design speed of 60 km/h. Cameras were deployed at the successive control points (100, 200, and 300 m) in the departure lane. The duration time of the synchronous observation was 1 h. The videos were processed with the help of Moviemaker software manually. At each control point, the vehicular license plate numbers and front bumper passing time were recorded. The time headways were extracted during each signal cycle. The dispersion degree was calculated under stable stateR1and at the starting point of the segmentR0. For each signal cycle, the number of vehicles that passed through the intersection under saturation traffic flow was found to be 60% of the total traffic volume.N/Q=0.6 was adopted during the calculation. After the data comparison of each cycle, the data of 20 signal cycles was selected. The data analysis results for the two segments are shown in Tab.1 and Tab.2. Overall, the waving range of the dispersion degree at different control points for each signal cycle is relatively large. However, the general distribution tendency is accordant; i.e., as the distance away from the upstream intersection increases, the platoon dispersion degree decreases. Tab.1 Field data analysis on Segment 1 Tab.2 Field data analysis on Segment 2 3Determination of Parameters Numerous observations and statistics are required to determine the time headway threshold. Generally, the thresholds are related to vehicle speeds and vehicle types[12]. Due to the speeds varying along with road sections, the corresponding thresholds should be different. Furthermore, the differences in the proportions of vehicle types for various functional category highways will also result in different headway thresholds. Considering the numerous differences, we measured the headway threshold based on the previous research results[10-13]. The minimum time headwayhminto ensure safe driving is 2 s; the time headway threshold under free flow state is 5 s. Based on the conclusions of the field survey, the parameters used in the dispersion degree model were calibrated using the Leverberg-Marquardt method in SPSS. At the beginning of calibration,R0andR1were input as the known parameters. The initial value of parameterais 3, andbis 4. The model calibration results are shown in Tab.3. Tab.3 The results of model calibration Rarterial=0.651 3exp(-5.582x)+ 0.110 2(1-exp(-15.268x)) (10) Rcollector=0.648 8exp(-9.348x)+ 0.102 8(1-exp(-29.34x)) (11) According to Eq.(10) and Eq.(11), whenx→∞,R→R1. It is found that the curve is monotone decreasing, at least before reaching the stable state. Therefore, the slopefof the dispersion degree function can be used to estimate the stable point, the curve slope equations are farterial=1.682 5exp(-15.268x)-3.635 6exp(-5.582x) (12) fcollector=3.016 2exp(-29.34x)-6.065exp(-9.348x) (13) The changes in the dispersion degrees and slopes with increasing distances to the upstream signalized intersections can be observed (50 m interval), as shown in Fig.2 and Fig.3. Whenf=-0.1, the dispersion degrees are regarded as reaching a sufficient small value. The corresponding distance is the expected distance to stabilize the traffic flow. The dispersion stable distance for two-lane highways are shown in Tab.4. Fig.2 Platoon dispersion degree trend Fig.3 Curve slope of dispersion degree distribution trend Tab.4 Minimum spacing of signalized intersections Based on the analysis above, the minimum spacing of highway signalized intersections can be measured as shown in Tab.4. 4Conclusion Based on the platoon dispersion theory, an analytical method is proposed to measure the minimum spacing for signalized intersections, which is determined by the traffic flow stable distance and the length of the intersection upstream functional area. In order to obtain the minimum distance that will make the platoon dispersion stable, the changes in platoon dispersion are estimated with the varying distance to the upstream signalized intersection. The length of the upstream functional intersection area is determined based on previous research. This paper places particular emphasis on the theoretical analysis of optimal spacing of signalized intersections from the aspect of traffic flow stability. However, the traffic flow stable distance is influenced by various factors, such as the proportion of vehicle types, traffic volumes, and distribution of time headways. Future research should collect more detailed field data to calibrate the model. Furthermore, in engineering practice, the recommended specifications for signalized intersection spacing should be adjusted considering various influencing factors, such as access category, land use, driveways, and median openings. References [1]Williams K M, Stover V G, Dixon K K, et al.Accessmanagementmanual[M]. Washington, DC: Transportation Research Board, 2014. [2]Gluck J S, Levinson H S, Stover V G.Impactsofaccessmanagementtechniques[M]. Washington, DC: Transportation Research Board, 1999. [3]Ministry of Transport of the People’s Republic of China. JTG B01—2014 Technical standard of highway engineering [S]. Beijing: China Communications Press, 2014. (in Chinese) [4]Ma Yongfeng, Xiang Qiaojun, Lu Jian. Analysis of signalized intersection safety spacing of multi-lane based on traffic flow stability distance [J].ChinaJournalofHighwayandTransport, 2010, 23(3): 83-88. (in Chinese) [5]Wang X, Song Y, Yu R, et al. Safety modeling of suburban arterials in Shanghai, China [J].AccidentAnalysis&Prevention, 2014, 70: 215-224. [6]AASHTO.Apolicyongeometricdesignofhighwaysandstreets[M]. Washington, DC: American Association of State Highway and Transportation Officials, 2011. [7]Manar A, Baass K G. Traffic platoon dispersion modeling on arterial streets [J].TransportationResearchRecord, 1996, 1566: 49-53. [8]Wu W, Jin W, Shen L. Mixed platoon flow dispersion model based on speed-truncated Gaussian mixture distribution [J/OL].JournalofAppliedMathematics, 2013. http://dx.doi.org/10.1155/2013/480965. [9]Bonneson J A, Pratt M P, Vandehey M A. Predicting arrival flow profiles and platoon dispersion for urban street segments[J].TransportationResearchRecord, 2010, 2173: 28-35. [10]Yang Peikun, Huang Wenzhong, Che Peiming. Traffic flow model of platoon dispersion process for urban highways [J].TongjiUniversityTransaction, 1994, 22(3): 294-299. (in Chinese) [11]Bonneson J A, Pratt M P, Vandehey M A. Predicting arrival flow profiles and platoon dispersion for urban street segments[J].TransportationResearchRecord, 2010, 2173: 28-35. [12]Luo Xia, Du Jinyou, Huo Yamin. Study on the distribution patterns of time headway of vehicles [J].JournalofSouthwestJiaotongUniversity, 2001, 36(2): 113-116. (in Chinese) [13]Chang Yulin, Wang Wei, Deng Wei, et al. Research of the headway distribution models on two lane highways and their applications [J].JournalofSoutheastUniversity:NaturalScienceEdition, 1999, 29(6): 108-112. (in Chinese) doi:10.3969/j.issn.1003-7985.2015.04.020


3.1 Time headway threshold
3.2 Model parameter calibration


3.3 Platoon dispersion stable distance


3.4 Minimum spacing
杂志排行
Journal of Southeast University(English Edition)的其它文章
- Mitigation of inter-cell interference in visible light communication
- Modified particle swarm optimization-based antenna tiltangle adjusting scheme for LTE coverage optimization
- Distribution algorithm of entangled particles for wireless quantum communication mesh networks
- Kernel principal component analysis networkfor image classification
- CFD simulation of ammonia-based CO2 absorption in a spray column
- Simulation and performance analysis of organic Rankine cycle combined heat and power system
