A novel similarity measurement approach considering intrinsic user groups in collaborative filtering
2015-03-01GuLiangYangPengDongYongqiang
Gu Liang Yang Peng Dong Yongqiang
(School of Computer Science and Engineering, Southeast University, Nanjing 211189, China)(Key Laboratory of Computer Network and Information Integration of Ministry of Education, Southeast University, Nanjing 211189, China)
A novel similarity measurement approach considering intrinsic user groups in collaborative filtering
Gu Liang Yang Peng Dong Yongqiang
(School of Computer Science and Engineering, Southeast University, Nanjing 211189, China)(Key Laboratory of Computer Network and Information Integration of Ministry of Education, Southeast University, Nanjing 211189, China)
Abstract:To improve the similarity measurement between users, a similarity measurement approach incorporating clusters of intrinsic user groups (SMCUG) is proposed considering the social information of users. The approach constructs the taxonomy trees for each categorical attribute of users. Based on the taxonomy trees, the distance between numerical and categorical attributes is computed in a unified framework via a proper weight. Then, using the proposed distance method, the naïve k-means cluster method is modified to compute the intrinsic user groups. Finally, the user group information is incorporated to improve the performance of traditional similarity measurement. A series of experiments are performed on a real world dataset, MovieLens. Results demonstrate that the proposed approach considerably outperforms the traditional approaches in the prediction accuracy in collaborative filtering.
Key words:similarity; user group; cluster; collaborative filtering
Received 2015-03-22.
Biographies:Gu Liang (1989—), male, graduate; Yang Peng (corresponding author), male, doctor, associate professor, pengyang@seu.edu.cn.
Foundation items:The National High Technology Research and Development Program of China (863 Program) (No.2013AA013503), the National Natural Science Foundation of China (No.61472080, 61370206, 61300200), the Consulting Project of Chinese Academy of Engineering (No.2015-XY-04), the Foundation of Collaborative Innovation Center of Novel Software Technology and Industrialization.
Citation:Gu Liang, Yang Peng, Dong Yongqiang. A novel similarity measurement approach considering intrinsic user groups in collaborative filtering[J].Journal of Southeast University (English Edition),2015,31(4):462-468.[doi:10.3969/j.issn.1003-7985.2015.04.006]
As the current innovations in the information and Internet technology boom, people are facing the problem of information overload. The significance of recommendations becomes heightened due to people’s inability to find the most interesting and valuable information on the Internet. The research of the recommendation system is ongoing in different areas, e.g., e-commerce[1], social networks[2]and the TV system[3]. Generally speaking, recommendation systems consist of three prevalent methods, the content-based method, collaborative filtering (CF) and sequential pattern analysis. Among these methods, collaborative filtering, first proposed by Goldberg et al. in 1992[4], has been widely studied and applied due to its effectiveness and simplicity.
Generally speaking, the model-based methods and memory-based methods are the main CF techniques[5-6]. The memory-based methods perform better than the model-based methods in some aspects and thus attract considerable attention in this research area. Given an unknown rating on a test item from a test user, the memory-based CF measures the similarity between the test user and other users (user-based) or the similarity between the test item and other items (item-based). Then, the rating to be predicted can be computed by averaging the weighted previous ratings on the test item from similar users (user-based) or by averaging the weighted previous ratings on the similar item from the test user (item-based).
As we can see that, the similarity measurement is a fundamental step in both user-based and item-based methods. Researchers have put forward quite a few similarity measurement methods, including the cosine-based method (COS), Pearson correlation coefficient (PCC) and Euclidean distance (ED)[7-9]. In particular, the COS focuses more on the angle between the vectors to be computed while paying little attention to their lengths. In addition, PCC is used to compare the changing trend of the vector while ignoring the numerical magnitudes. Different from these two approaches, although ED is almost the most traditional method in distance computing, it tends to provide low accuracy due to its simplicity. That is to say, all of them have some inherent defects. Ref.[10] proposed a mitigation method to select different neighbors for each test item. Ref.[10] combined these three methods and provided nine combinations. Besides, a similarity measurement, named Jaccard uniform operator distance, was proposed in Ref.[11] to effectively measure the similarity aiming at unifying similarity comparison for vectors in different multidimensional vector spaces and handling dimension-number difference for different vector spaces. Different from Ref.[11], Ref.[12] argued that traditional similarity measures can be improved by taking into account the contextual information drawn from users. An entropy-based neighbor selection approach for collaborative filtering was put forward in Ref.[13]. The proposed method incorporates similarities and uncertainty values to solve the optimization problem of gathering the most similar entities with minimum entropy difference within a neighborhood. Although some of these methods mentioned above improve the recommendation accuracy to some extent, they do not make full use of social information. Some research results on semantic information have also been presented in recent years. Ref.[14] put forward a clustering approach for categorical data based on TaxMap. Ref.[15] proposed a probabilistic correlation-based similarity measure to enrich the information of records, by considering correlations of tokens. A semantic measure named link weight was demonstrated in Ref.[16], in which the semantic characteristics of two entities and Google page count are used to calculate an information distance similarity between them. The above works make some achievements in similarity measurement while overlooking the significance of numerical data which is considered in this paper. Besides, other neighbor selection approaches were also proposed to improve recommendation quality[17-20].
In this paper, we first propose a novel distance measurement for user record considering its numerical attributes, categorical attributes and the correlation between them. To make the distance metric more reliable, we weigh the attributes by a controlling parameter. Specifically, for the categorical attribute, we build a weighted taxonomy tree to compute the distance. Based on the novel distance measurement, we then attempt to discover the clusters of intrinsic user groups before the similarity computing, i.e., find the neighbors of the test user according to the social information of users. Finally, we propose an incorporation method to compute the similarity between users considering the groups they belong to. The experiments show the advantages of our novel approach over prediction accuracy.
1Preliminaries
1.1 User-based collaborative filtering
As mentioned above, the memory-based CF method can be divided into user-based and item-based approaches. The recommendation relies on a user-item matrix. This matrix contains the information of users, items and users’ ratings. A row vector in the matrix represents a user’s ratings on all items, while a column vector expresses the ratings on an item from all users. Note that, the element in the matrix remains null when the item has not been rated by the corresponding user.
Here, we focus on the user-based collaborative filtering. The user-based methods compute the similarity between the test user and others based on their previous ratings on all items. According to the user-item matrix, we can use the three traditional approaches to compute the user similarity. Here, we take the PCC approach as an example. The figuretion is as follows:

(1)
After that, the user-based CF sorts the users according to their similarity with the test user. The rating to be predicted is computed by aggregating the ratings from other users with proper weight. The more similar a user is to the test user, the higher the weight assigned to the prediction rating. The detailed aggregating strategy is as

(2)
whereUAis the set of users similar to userA;s(A,u) is computed according to Eq.(1). In particular,rAmis equal to the average rating of userAwhen there are no similar users for him.
1.2 k-means clustering
In data mining area, k-means clustering is a well-known method for cluster analysis aiming to partitionnobservations intokclusters, in which each observation belongs to the cluster with the nearest mean. The rationale of k-means clustering can be illustrated as follows: Given a set of observations {X1, X2, …, Xn}, where each observation is a multi-dimensional real vector, k-means clustering attempts to partition thenobservations intok(≤n) setsC={C1, C2, …, Ck} so as to minimize the within-cluster sum of squares. In other words, its objective function is

(3)
The k-means clustering technique has been proved to be useful in many applications. Notice that, k-means clustering cannot deal well with categorical attributes due to its distance metric in clustering iterations.
2A Novel Similarity Measurement Approach
In this section, we describe our proposed approach in detail. First, we give a new definition of the distance metric in clustering aiming to deal with numerical and categorical attributes in a unified model. Then, we present the clustering process of discovering the intrinsic user groups. Finally, we show the proposed similarity measurement approach based on the intrinsic user groups.
2.1 New definition of the distance metric
The distance function is a critical element in the clustering problem. Generally speaking, the distance function computes the dissimilarities among data points (two-dimensional) or hyper-points (n-dimensional,n>2). Choosing an appropriate distance metric is important for obtaining an accurate result under attributes of specific types (numerical or categorical) or different sizes.
Unlike the normal attributes in the clustering problem, the attributes in CF technique typically consist of both the numerical and categorical attributes and every attribute always has a unique scale. Hence, in the CF area, we need a new distance metric to handle the above features. Ref.[21] introduced a measure that uses the simple matching similarity measure for categorical attributes. However, the measure in Ref.[21] cannot deal well with the attributes of user information in CF due to its indiscrimination of the distance between different categorical elements in the same attribute.
In this paper, we propose a new definition of the distance metric by considering the normalization of both the numerical and categorical attributes and the effect of the association-rule-based taxonomic tree. Here, we provide the definitions of numerical distance and categorical distance including the normalization.
Definition 1(numerical distance)Letnminandnmaxbe the minimum and maximum values of a numerical attribute. Given that two valuesn1andn2belong to this numerical attribute, the normalized distance is defined as

(4)


Tab.1 Typical cases
As the categorical attributes cannot be converted into numerical values, it is difficult to compute the distance between two values under some categorical attribute directly. One solution is that, if the two values under the attribute are the same to each other, the distance between them is 0. Otherwise, the distance is 1. Besides, Ref.[21] captured the semantic relationship among the values and built the taxonomy tree for them, thus improving the distance accuracy to some extent. However, this method faces difficulty when the two values belong to the same level of the taxonomy tree. In this paper, we attempt to solve this problem by discovering their association rules with other numerical attributes.
Definition 2(categorical distance)Let V={C1,…,Cp,…,N1,…,Nq} be a record includingpcategorical attributes {C1,C2,…,Cp} andqnumerical attributes {N1,N2,…,Nq}. LetTh(h∈[1,q]) be a taxonomy tree forCh.yi,yjare two values from the same categorical attributeCh, andNs(s∈[1,p]) is a numerical attribute that has a value interval [nmin,nmax]. The normalized distance betweenyiandyjis defined as

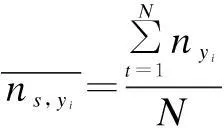
(5)


(6)
whereNis the number of all the records.
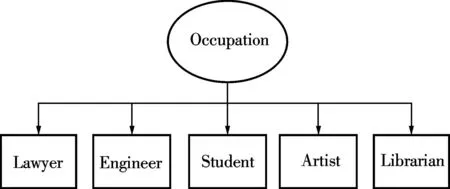
A simple case is shown in Fig.1. Fig.1 illustrates the taxonomy tree of the attribute Occupation in Tab.1. In this case, every profession is equal in the taxonomy tree and the distance between them is 0 without considering the association rules with other numerical attributes like Salary. However, it is not difficult to infer that any profession should have some underlying correlation with other professions. This paper attempts to discover this correlation. With the function proposed in Definition 2, we can discover the association rule between Occupation and Salary. The new distance between the attribute Occupation of records 4 and 5 is How to construct the taxonomy tree of each attribute is a key point in our approach. Generally speaking, researchers construct the tree manually according to the domain knowledge or use the decision tree algorithm, e.g., ID3 and C4.5. The former possesses better performance than the latter while having worse operability when the attributes are complicated. In our proposed approach, we construct the taxonomy tree manually to obtain better performance considering that the user attribute in this paper is relatively simple.


Fig.1 Taxonomy tree of Occupation
Definition 3 (record distance)Given two recordsr1andr2with the attributes as introduced in Definition 2, the distance between them is defined as


(7)
whereri[x] represents the value of attributexinri;CandNare defined in Definitions 1 and 2, respectively;Cxis the center of the cluster which the recordxbelongs to; andλis a weight parameter to control the contributions of numerical attributes and categorical attributes. Notice that, whenλis equal to 0, the distance between the records is entirely dependent on their numerical attributes and this can deal well with the cases that user records have few or no categorical attributes.
2.2 Discovering intrinsic user groups
Based on the distance metric proposed above, in this part, we attempt to discover the intrinsic user groups using the k-means clustering technique. We first give the definition of intrinsic user groups in our approach.
Definition 4 (intrinsic user groups)Given a user record setU, it will be divided intomintrinsic user groups, {g1,g2,…,gm} according to the record distance defined in Definition 3 so that, for each user recorduinU, ifuis grouped intogi, two conditions must be satisfied:

(8)

(9)
The intrinsic user groups can be obtained by the record distance between user records. Given the initial set of records, the k-means algorithm can be divided into three distinct phases: initial, assignment and update phase. In the initial phase,kpoints are selected as the initial centers ofkclusters. In the assignment phase, each point is assigned to the closest center according to a distance metric. While in the update phase, the cluster centers of any changed clusters are recomputed as the average of members of each cluster. The last two phases are executed iteratively until the algorithm converges. We set up the brief process to discover the intrinsic user groups as follows.
Algorithm 1Discovering algorithm
Input: a positive integerk, an iteration numberm, a convergence thresholdδ0, a set of user recordsS.
Output: a set ofkgroups and their centers.

Return;
End If;
Pickkuser records as centers randomly, cost=MAX;
While(m>0 ‖δ<δ0)

Forj=1,2,…,k
N(Si,gj);
C(Si,gj);
R(Si,gj);
End For;
c=Min-Rdis(Si);
gc←Si;
End For;

cost=Cost(g);
Fori=0,1,…,k
Center(gk);
End For;
m=m-1;
End While;
Returngmand Center(gm),m=1,2,…,k;
End;
In Algorithm 1, Min-Rdis(Si) is the function to obtain the center closest toSi.C(g) is computed using Eq.(3). Center(gk) represents the center ofgk. Once Algorithm 1 is finished, we obtain thekintrinsic user groups.
2.3 CF with Novel Similarity Measurement Approach
In Section 2.2, we have discovered the intrinsic user groups by a new distance metric. Then, we incorporate this information to compute the similarity between users. The incorporation strategy can be illustrated as

(10)

3Empirical Analysis
This section describes the experimental design for evaluating the proposed similarity measurement approach, as well as how the approach affects the quality of recommendation. The implication of the experiments is also introduced in this section.
3.1 Dataset
In order to evaluate the performance of our approach, we perform the experiments on the MovieLens dataset, which is a well-known dataset for collaborative filtering collected by the GroupLens research team at the University of Minnesota. The dataset includes 100 000 ratings on 1 682 items by 943 users. Moreover, the rating scale of the dataset is from 1 to 5 and each user rated at least 20 movies. To obtain reliable experimental results, 90% of each target user’s ratings are used as training data, and the remaining ratings are used as test data.
3.2 Evaluation metrics
The accuracy of prediction is the most common assessment criteria in CF area. We use the well-known mean absolute error (MAE) to evaluate the prediction accuracy. MAE is the average absolute deviation of predictions to the ground truth, which is defined as

(11)

3.3 Performance comparison
3.3.1Comparisons with other traditional approaches
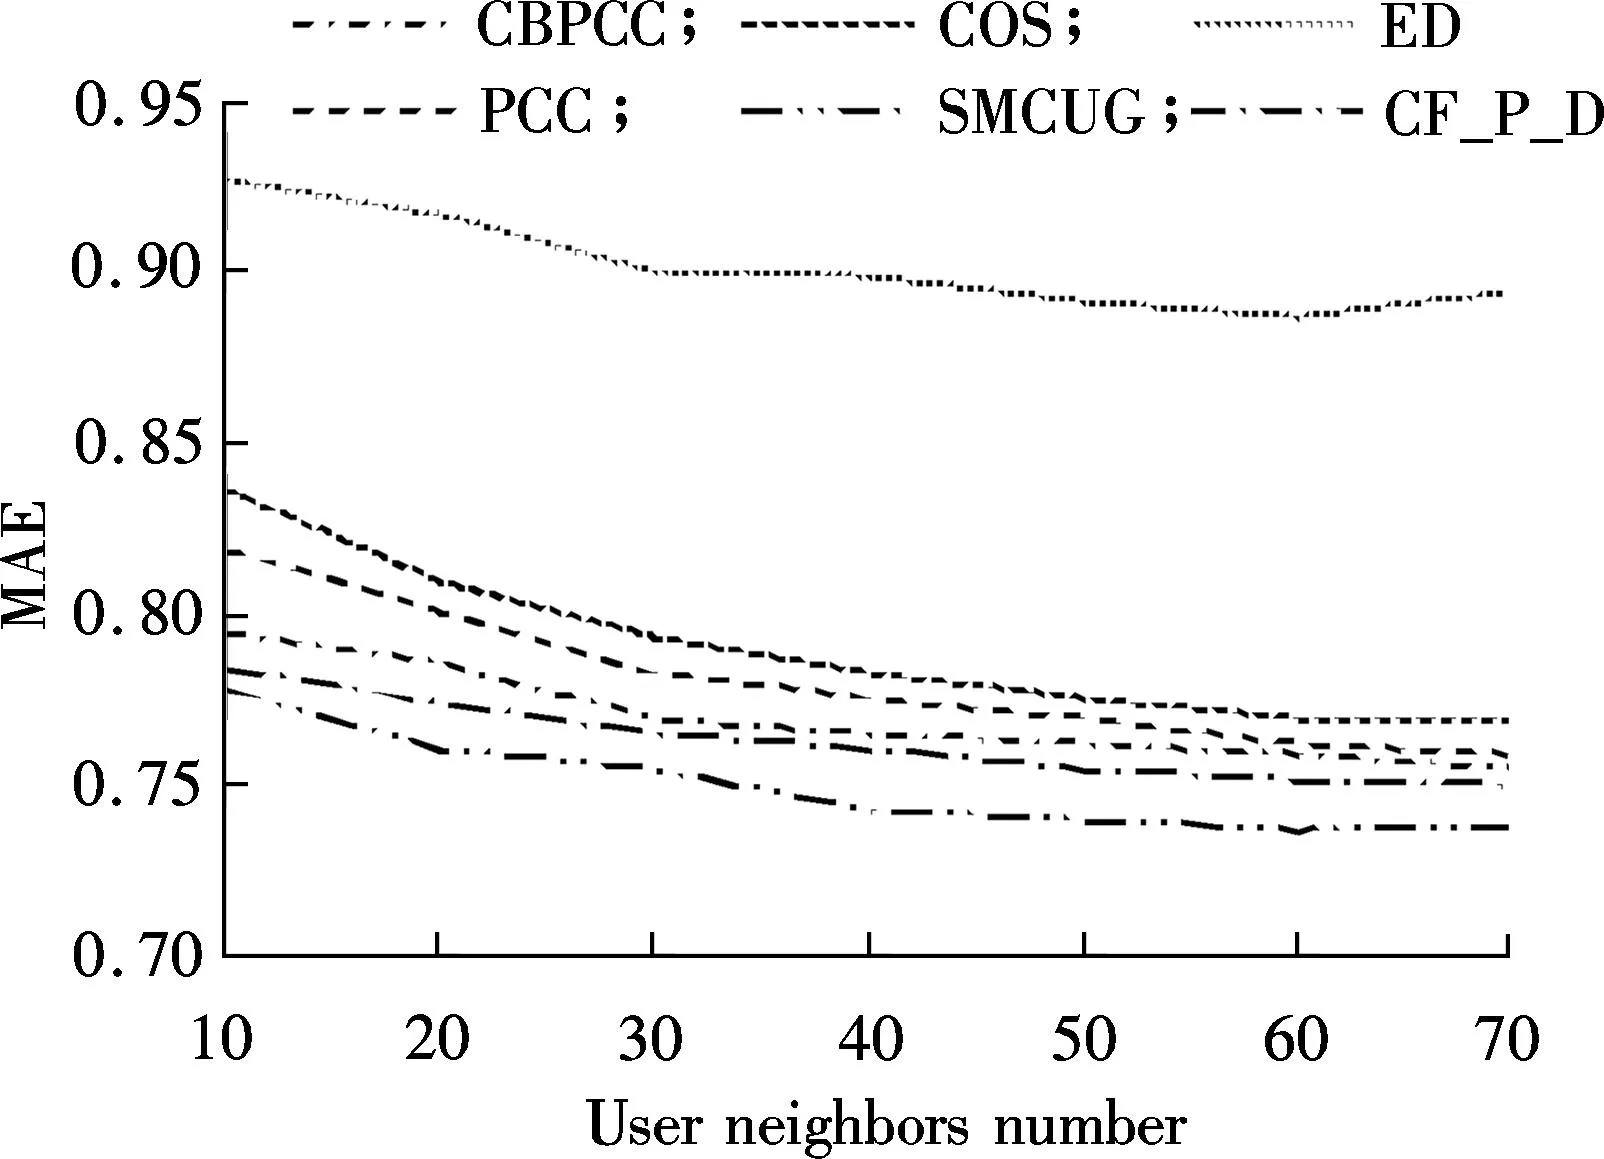
In order to illustrate the effectiveness of our proposed approach SMCUG, we compare it with five representative similarity measurement approaches: COS[6], PCC[7], ED[8], CF-P-D[9]and CBPCC[18]. In particular, Ref.[9] introduces nine combination methods and CF-P-D shows the best performance among them on the Movielens dataset. According to Definition 3, we can observe thatλis a significant parameter. In this experiment, we setλto be 0.5. That is, the categorical attributes and numerical attributes of user record have equal contributions to the clustering of intrisic user groups. We attempt to group all users into 50 groups by setting the parameterkto be 50 in the clustering process. We vary the neighbor’s size from 5, 20, 40, 60, 80, to 100. Fig. 2 shows the MAE performance comparison of all the evaluated approaches. From Fig.2 we can infer that, as the neighbors number increases, all the approaches tend to obtain lower MAE results, which means more accurate predictions. Among them, the ED approach obtains a relatively high MAE result. We believe that this is caused by its inherent metric limitation. Our proposed approach outperforms all the other approaches with different numbers of neighbors.

Fig.2 MAE plots of all the approaches with different numbers of neighbors
3.3.2Impacts of factors
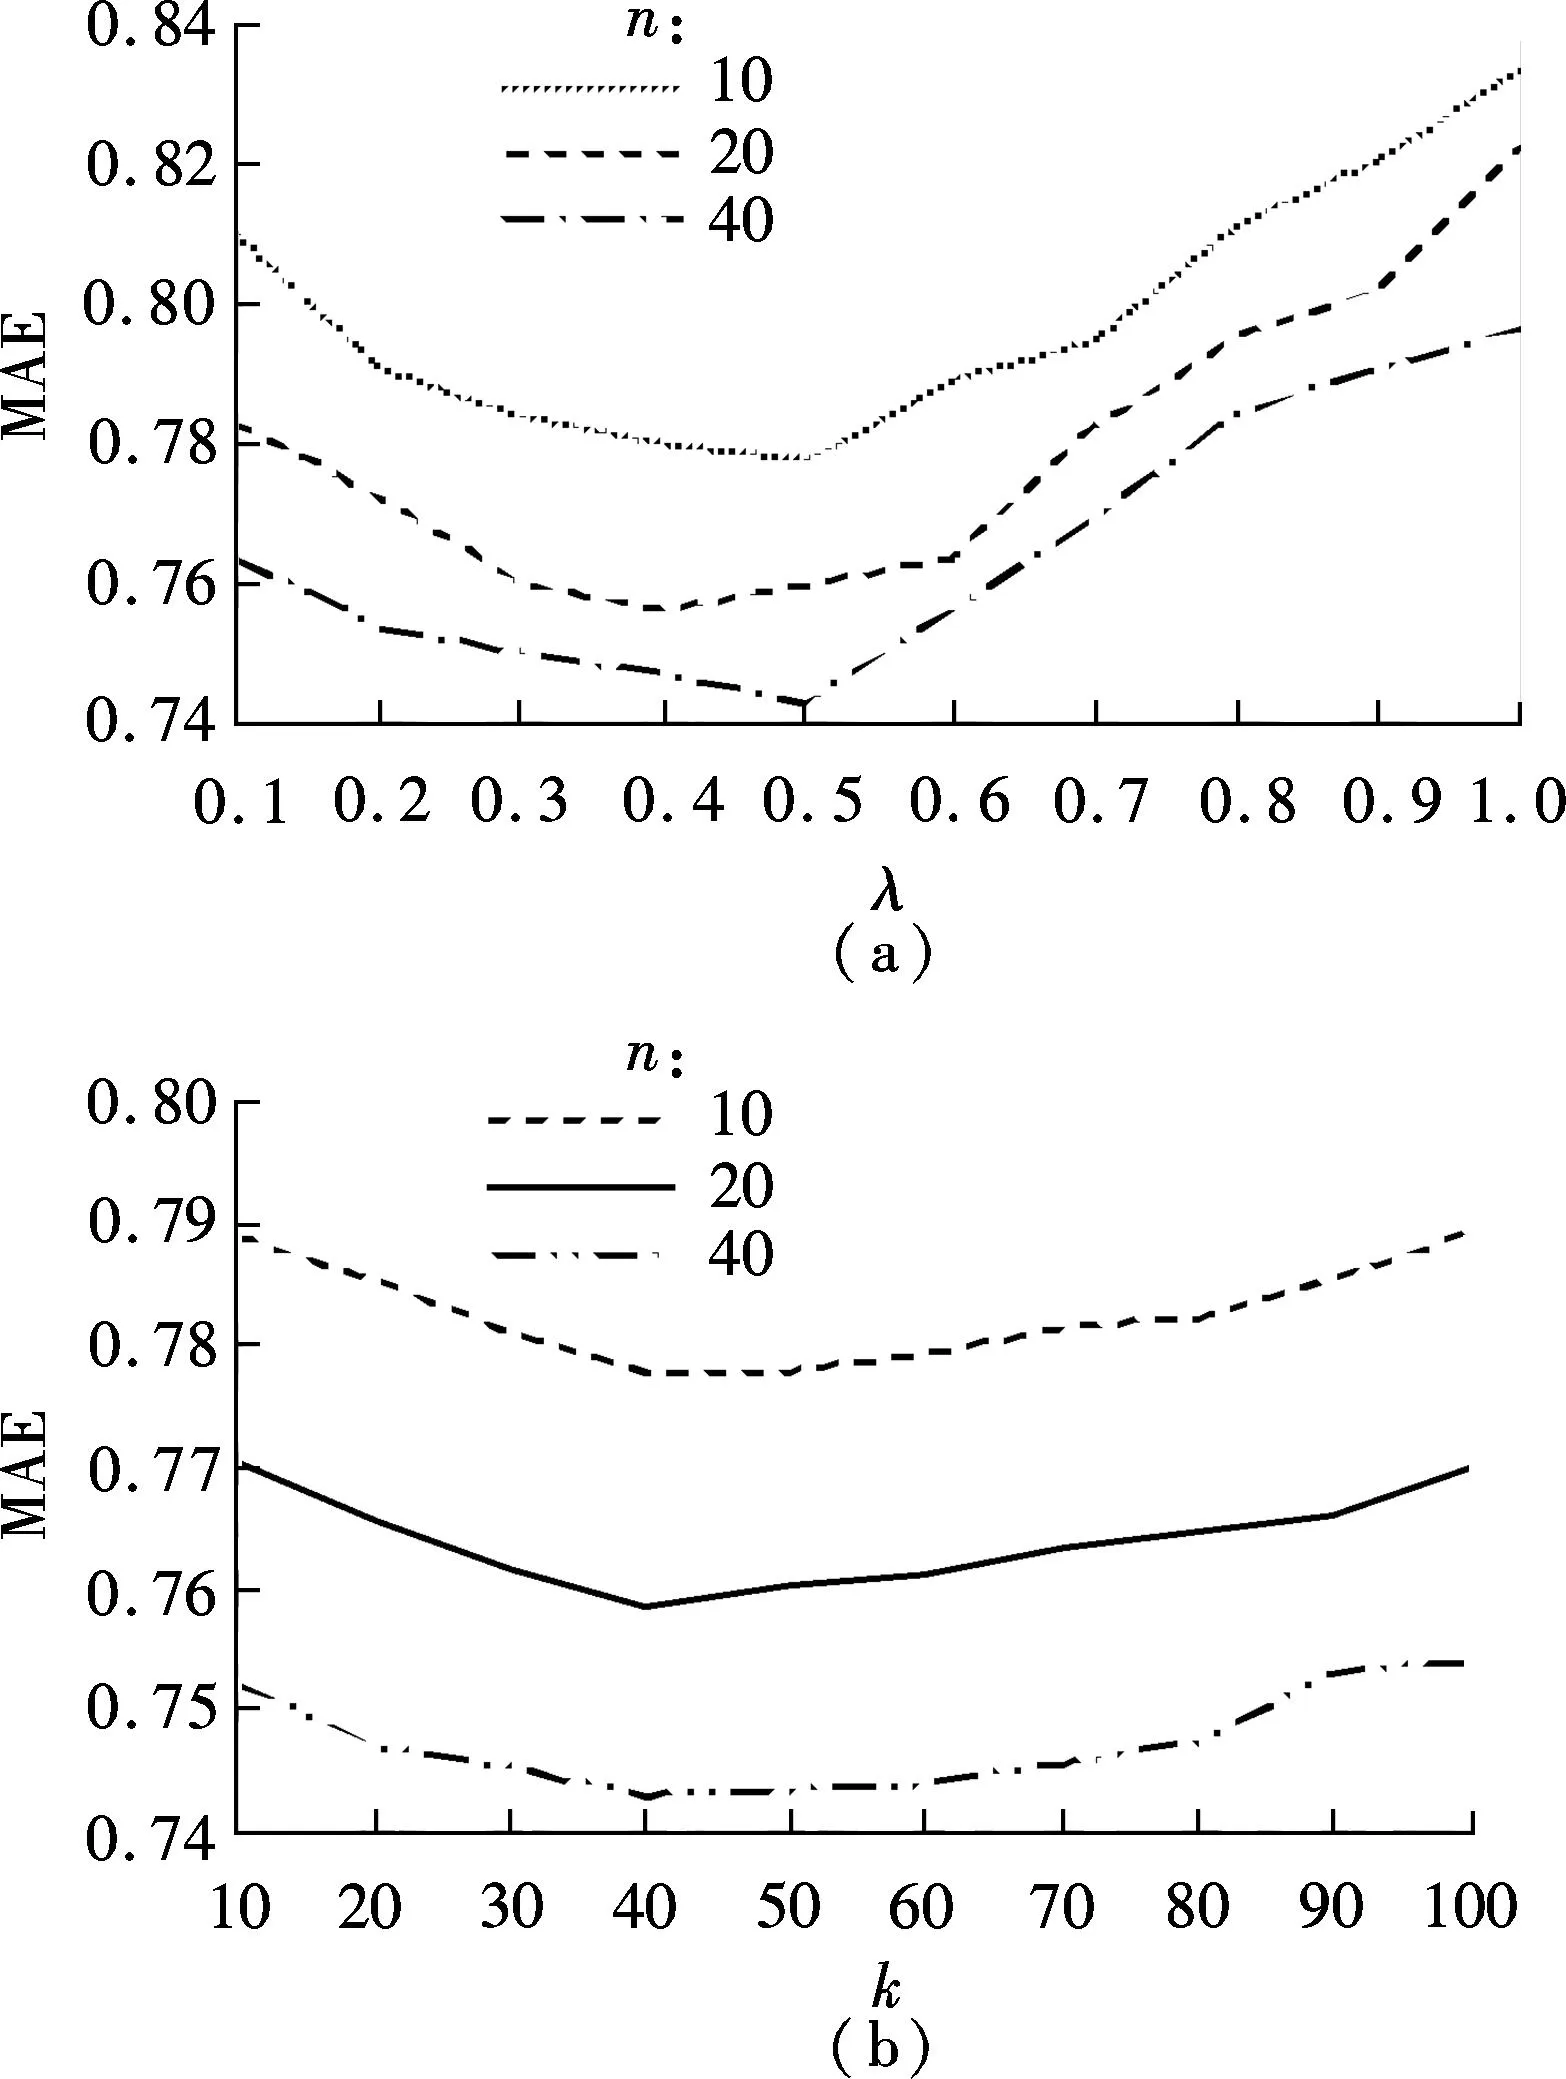
In our proposed approach, the cluster number and attribute factor have significant effects on the final predictions. We let one of them be a constant and then observe the effect of the other on the prediction result. First, the cluster number parameterkis set to be 50 and we vary the attribute factorλfrom 0 to 1. The experimental result is illustrated in Fig.3(a). As can be seen, we conduct the experiments when the neighbors number is 10, 20, and 40. Under these three conditions, the MAE curves with different neighbor numbers are similar. The most accurate prediction can be obtained around the value of 0.4. We hold that this is mainly because our proposed approach assigns an appropriate weight to both the numerical and categorical attributes at this point. The numerical attributes seem more important for prediction accuracy than the categorical attributes. As for other datasets, we can train the parameterλwith a small part of the dataset to ensure a satisfactory result due to the fact that the dataset feature of one application tends to be stable as its data size increases.
Fig.3(b) illustrates the effect of user groups number on overall prediction accuracy. The attribute parameterλis set to be 0.5. From Fig.3(b), it is apparent that the number of user groups does have an effect on the performance of our approach. As the number of user groups increases, the MAE of our approach descends until the number reaches around 40. After then, the MAE goes up again when the number varies from 40 to 100. We infer that, the large number of user groups makes the user information more specific, thus leading to the overfitting problem. Moreover, the small number of user groups makes the groups imprecise and we cannot utilize the intrinsic information adequately. Both the conditions are detrimental to the prediction accuracy.

Fig.3 MAE plots of SMCUG with different λ and k. (a) Plots with different λ (k=50); (b) Plots with different k(λ=0.5)
4Conclusion
We propose a novel similarity measurement approach incorporating clusters of intrinsic user groups in collaborative filtering. Due to the proper clustering technique, our approach can utilize the user social information effectively and improve the prediction results notably. Experiments performed on a real-world dataset demonstrate that our proposed approach outperforms other approaches. In the future, we plan to conduct a better analysis of the approach and focus on the item grouping.
References
[1]Resnick P, Iacovou N, Suchak M, et al. GroupLens: an open architecture for collaborative filtering of netnews[C]//Proceedingsofthe1994ACMConferenceonComputerSupportedCooperativeWork. Chapel Hill, NC, USA, 1994: 175-186.
[2]Walter F E, Battiston S, Schweitzer F. A model of a trust-based recommendation system on a social network[J].AutonomousAgentsandMulti-AgentSystems, 2008, 16(1): 57-74.
[3]Hsu S H, Wen M H, Lin H C, et al. AIMED—a personalized TV recommendation system[M]//InteractiveTV:asharedexperience. Berlin: Springer, 2007: 166-174.
[4]Goldberg D, Nichols D, Oki B M, et al. Using collaborative filtering to weave an information tapestry[J].CommunicationsoftheACM, 1992, 35(12): 61-70.
[5]Adomavicius G, Tuzhilin A. Toward the next generation of recommender systems: a survey of the state-of-the-art and possible extensions[J].IEEETransactionsonKnowledgeandDataEngineering, 2005, 17(6): 734-749.
[6]Sahoo N, Singh P V, Mukhopadhyay T. A hidden Markov model for collaborative filtering[J/OL].ManagementInformationSystemsQuarterly, 2012. http://ssrn.com/abstract=1700585.
[7]Sarwar B, Karypis G, Konstan J, et al. Item-based collaborative filtering recommendation algorithms[C]//Proceedingsofthe10thInternationalConferenceonWorldWideWeb. Hong Kong, China, 2001: 285-295.
[8]Ma H, King I, Lyu M R. Effective missing data prediction for collaborative filtering[C]//Proceedingsofthe30thAnnualInternationalACMSIGIRConferenceonResearchandDevelopmentinInformationRetrieval. Amsterdam, Holland, 2007: 39-46.
[9]Kim H K, Kim J K, Ryu Y U. Personalized recommendation over a customer network for ubiquitous shopping[J].IEEETransactionsonServicesComputing, 2009, 2(2): 140-151.
[10]Choi K, Suh Y. A new similarity function for selecting neighbors for each target item in collaborative filtering[J].Knowledge-BasedSystems, 2013, 37(2): 146-153.
[11]Sun H F, Chen J L, Yu G, et al. JacUOD: a new similarity measurement for collaborative filtering[J].JournalofComputerScienceandTechnology, 2012, 27(6): 1252-1260.
[12]Bobadilla J, Ortega F, Hernando A. A collaborative filtering similarity measure based on singularities[J].InformationProcessing&Management, 2012, 48(2): 204-217.
[13]Kaleli C. An entropy-based neighbor selection approach for collaborative filtering[J].Knowledge-BasedSystems, 2014, 56(3): 273-280.
[14]Dos Santos T R L, Zárate L E. Categorical data clustering: what similarity measure to recommend?[J].ExpertSystemswithApplications, 2015, 42(3): 1247-1260.
[15]Song S, Zhu H, Chen L. Probabilistic correlation-based similarity measure on text records[J].InformationSciences, 2014, 289(5): 8-24.
[16]Jiang Y, Wang X, Zheng H T. A semantic similarity measure based on information distance for ontology alignment[J].InformationSciences, 2014, 278(10): 76-87.
[17]Xue G R, Lin C, Yang Q, et al. Scalable collaborative filtering using cluster-based smoothing[C]//Proceedingsofthe28thAnnualInternationalACMSIGIRConferenceonResearchandDevelopmentinInformationRetrieval. Singapore, 2005: 114-121.
[18]Roh T H, Oh K J, Han I. The collaborative filtering recommendation based on SOM cluster-indexing CBR[J].ExpertSystemswithApplications, 2003, 25(3): 413-423.
[19]Honda K, Sugiura N, Ichihashi H, et al. Collaborative filtering using principal component analysis and fuzzy clustering[M]//Webintelligence:researchanddevelopment. Berlin: Springer, 2001: 394-402.
[20]Bilge A, Polat H. A comparison of clustering-based privacy-preserving collaborative filtering schemes[J].AppliedSoftComputing, 2013, 13(5): 2478-2489.
[21]Huang Z. Extensions to the k-means algorithm for clustering large data sets with categorical values[J].DataMining&KnowledgeDiscovery, 1998, 2(3): 283-304.
doi:10.3969/j.issn.1003-7985.2015.04.006
杂志排行
Journal of Southeast University(English Edition)的其它文章
- Mitigation of inter-cell interference in visible light communication
- Modified particle swarm optimization-based antenna tiltangle adjusting scheme for LTE coverage optimization
- Distribution algorithm of entangled particles for wireless quantum communication mesh networks
- Kernel principal component analysis networkfor image classification
- CFD simulation of ammonia-based CO2 absorption in a spray column
- Simulation and performance analysis of organic Rankine cycle combined heat and power system
