Fermentative coproduction of hydrogen and ethanol with mixed anaerobic culture environment
2014-09-14WANGZhichaoLIYuwen
WANG Zhi-chao, LI Yu-wen
(School of Forestry, Northeast Forestry University, Harbin 150040, China)
Introduction
With the current inevitable global issues such as petroleum depletion and global warming, hydrogen has been considered an ideal and clean energy carrier for the future since it has high energy content and non-polluting nature[1]. Dark fermentation was widely studied for hydrogen generation[2-4]and showed the great potential for development as a practical energy system. An effective fermentation hydrogen system and efficient hydrogen generating cultures can be obtained from various sludge sources. In dark fermentation, toxic chemical addition[5], acid/base pretreatment and heat pretreatment[6]were commonly used to enhance hydrogen production by activating clostridia spores and inhibiting hydrogen-consuming non-spore-forming bacteria. During fermentative hydrogen production process, a significant amount of ethanol can also produced from the following metabolic pathway (Eq. (1)). As an attractive alternative fuel, ethanol was already used for road vehicles and for other applications due to the possibility of domestic production which can secure energy supplies[7]. HRT is related to the amount of organics that can be handled per unit time[8], and therefore HRT can determine the substrate uptake efficiency, microbial population, and metabolic pathway[9]. Despite a great deal of attention on dark fermentation, most studies have only emphasized on the effect of individual factors on either hydrogen[10,11]or ethanol production[12]. To our best knowledge, information about the fermentative coproduction of hydrogen and ethanol from sugary wastewater with mixed anaerobic culture microenvironment is scarcely found. Therefore, the objective of this study was to identity the performance of fermentative coproduction of hydrogen and ethanol from sugary wastewater with mixed anaerobic culture microenvironment using anaerobic continuous stirred tank reactor (ACSTR) with aerobic pretreatment sludge addition.
1 Materials and methods
1.1 Substrate
In this study, the sugar wastewater used as experimental substrate for sequential hydrogen and ethanol coproduction was collected from local sugar refining industry (Harbin, China). As shown in Table 1, the sugary wastewater contained a high concentration of carbohydrates which correspond to readily fermentative sugars. In addition, it contained enough nitrogen and phosphorus sources which are essential for cultivation of microorganisms.
Table1Thecharacteristicsofsugarwastewaterusedinthispaper.
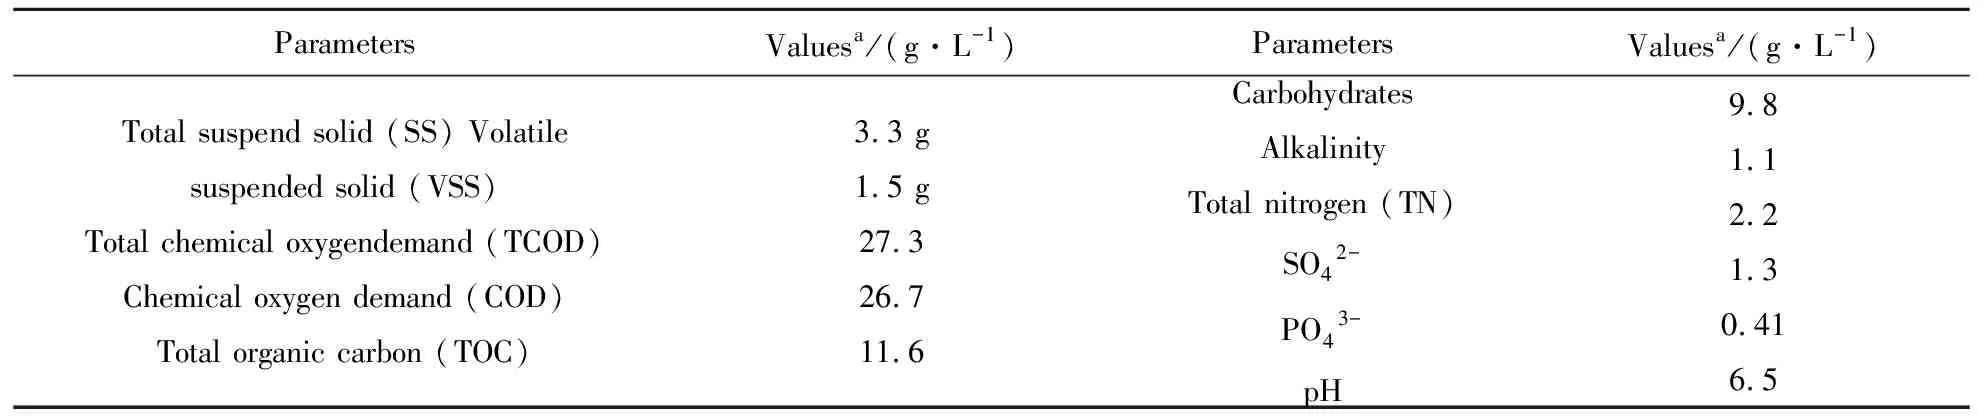
ParametersValuesa/(g·L-1)ParametersValuesa/(g·L-1)Total suspend solid (SS) Volatile suspended solid (VSS)Total chemical oxygendemand (TCOD)Chemical oxygen demand (COD)Total organic carbon (TOC)3.3 g1.5 g27.326.711.6CarbohydratesAlkalinityTotal nitrogen (TN)SO42-PO43-pH9.81.12.21.30.416.5
a-Values were averaged of 5 determinations
1.2 Sludge
The seed sludge used in this paper was the anaerobic sludge obtained from a local municipal wastewater treatment plant (Harbin, China). The sludge was first sieved through mesh with a diameter of 0.5 mm in order to eliminate large particulate materials that could cause pump failure. Then the seed sludge was aerated for 30 days using synthetic wastewater as substrate to inactivate hydrogen-consuming bacteria, especially methanogens. During the aerobic cultivation process, biological activity of hydrogen-producing bacteria was examined by analyses of glucose consumed. After enough cultivation, the hydrogen-producing sludge with suspended solids (SS) of 11.17 g/L and volatile suspended solids (VSS) of 9.45 g/L was inoculated into the ACSTR system.
1.3 Experimental procedures
ACSTR with a working volume of 6 L was employed in this study. The reactor, operated in a continuous flow mode, was completely mixed by a variable speed stirred with a gear shift. Temperature was maintained automatically at the level of (35±1) ℃ using an electric jacket. A gas-liquid-solid three-phase separator was installed inside the ACSTR to promote retention of sludge. The reactor was sealed to assure anaerobic condition. The generated biogas was collected by a water displacement method through an outlet provide at the top of the reactor and measured by a wet gas meter.
After the seed sludge was inoculated into the ACSTR, a rest of the volume in the reactor was filled with synthetic wastewater under complete anaerobic condition with the aid of peristaltic pump (Model No. 7523-30, Masterflex, USA). Then the ACSTR was operated in a continuous mode by supplying synthetic wastewater continuously in two stages. In stage I (120 days), substrate concentration was increased from 2 to 8 g COD/L in 3 steps to establish its effect on hydrogen and ethanol production. In stage II (150 days), HRT was decreased from 10 to 4 h in 4 steps while substrate concentration was held constant at 6 g COD/L to establish its effect on hydrogen and ethanol production. The steady-state condition in this study was defined as the condition that the biogas varied within 5% for 10 days.
1.4 Analytical methods
COD and pH were monitored and measured daily according to Standard methods[13]. The oxidation-reduction potential (ORP) was measured by a pHS-25 acidity voltmeter. Biogas generated from the ACSTR was collected using a wet gas meter (Model LML-1, Changchun Filter Co. Ltd., Changchun, China) calibrated to a temperature of 25 ℃ and pressure of 1 atm condition. Effluent samples from the reactor were also collected for metabolites analyses over the entire period of reactor operation.
Hydrogen was analyzed using a gas chromatography (SC-7, Shandong Lunan Instrument Factory). The gas chromatography was equipped with a thermal conductivity detector (TCD) and a stainless steel column (2 m × 5mm) filled with Porapak Q (50~80 meshes). Nitrogen was used as the carrier gas at a flow rate of 40 mL/min. Detection of VFAs in the fermentation solution was analyzed by another gas chromatograph (GC 112, shanghai Anal. Inst. Co.) with a flame ionization detector (FID). A 2-m stainless steel column was packed with the supporter GDX-103 (60~80 meshes). The temperatures of the injection port, oven, and detector were 220 ℃, 190 ℃, and 220℃, respectively. Nitrogen was used as the carrier gas at a flow rate of 30 mL/min.
Substrate utilization reflecting the conversion rate of substrate into hydrogen/ethanol during fermentation process can be calculated using equation (a).

(A)
WhereRrepresents the conversion rate of substrate into hydrogen and ethanol in ACSTR.Wrepresents the feed rate in ACSTR (L/d), respectively. 2.09 represent the COD equivalent of ethanol. 0.71 represent the COD (kg O2) of 1 m3H2.Mpresents the ethanol concentration in the effluent (g/L).VHrepresents the hydrogen production (L).CODrepresents the COD concentration of synthetic wastewater (g/L).
2 Results
2.1 Hydrogen and ethanol production at various substrate concentrations and HRTs
The performance of hydrogen and ethanol production in ACSTR is depicted in Fig.1 and Fig. 2. Experimental data from profile documented the feasibility of fermentative hydrogen and ethanol production during operation. The biogas was composed of hydrogen and carbon dioxide, and free of methane. It should be noticed that the hydrogen content stabilized in the range of (28.8±2.0) ~(30.6±1.0) % and (53.1±1.71)~(59.7±0.70) % for the whole stage I and II process. When the substrate concentration was increased from 2 g COD/L to 6 g COD/L, hydrogen and ethanol production rate rose slightly from (6.49±0.14) to (7.25±0.08) mmol/L·h)and from (1.42±0.01) to (1.62±0.04) mmol/(L·h)respectively. Higher substrate concentration (8 g COD/L) resulted in VFAs and hydrogen accumulation, and therefore caused the inhibition of hydrogen and ethanol production. An abrupt decrease in production rate of hydrogen and ethanol was observed. During the second stage operation, with constant substrate concentration the stepwise decreased HRT led to the obvious fluctuation of hydrogen and ethanol production. The HRT 6 h tested gave the highest hydrogen production rate of (8.73±0.07) mmol/(L·h). The highest ethanol production rate also reached (2.97±0.12) mmol·(L/h) for HRT 6 h. Drastic decrease in hydrogen and ethanol production rate was observed which attributed to the shorter HRT 4 h caused insufficient time for hydrolysis of substrate. As we known, hydrogen is produced as a by-product in the hydrolysis of various, e.g., carbohydrate[9]and the parameter HRT can negatively affect the hydrolysis process would decrease the hydrogen production rate. According to Figure 1 and Figure 2 it can be emphasized that the low HRT (from 8 h to 6 h) is more suitable for hydrogen and ethanol production fermentation when the indigenous sludge microbial populations were used as hydrogen producer. The obtained results are also sustained by the reported literature in which[14]observed the washout of propionate bacteria, which consume hydrogen during their metabolism, upon transition of the HRT from 8 to 6 h.
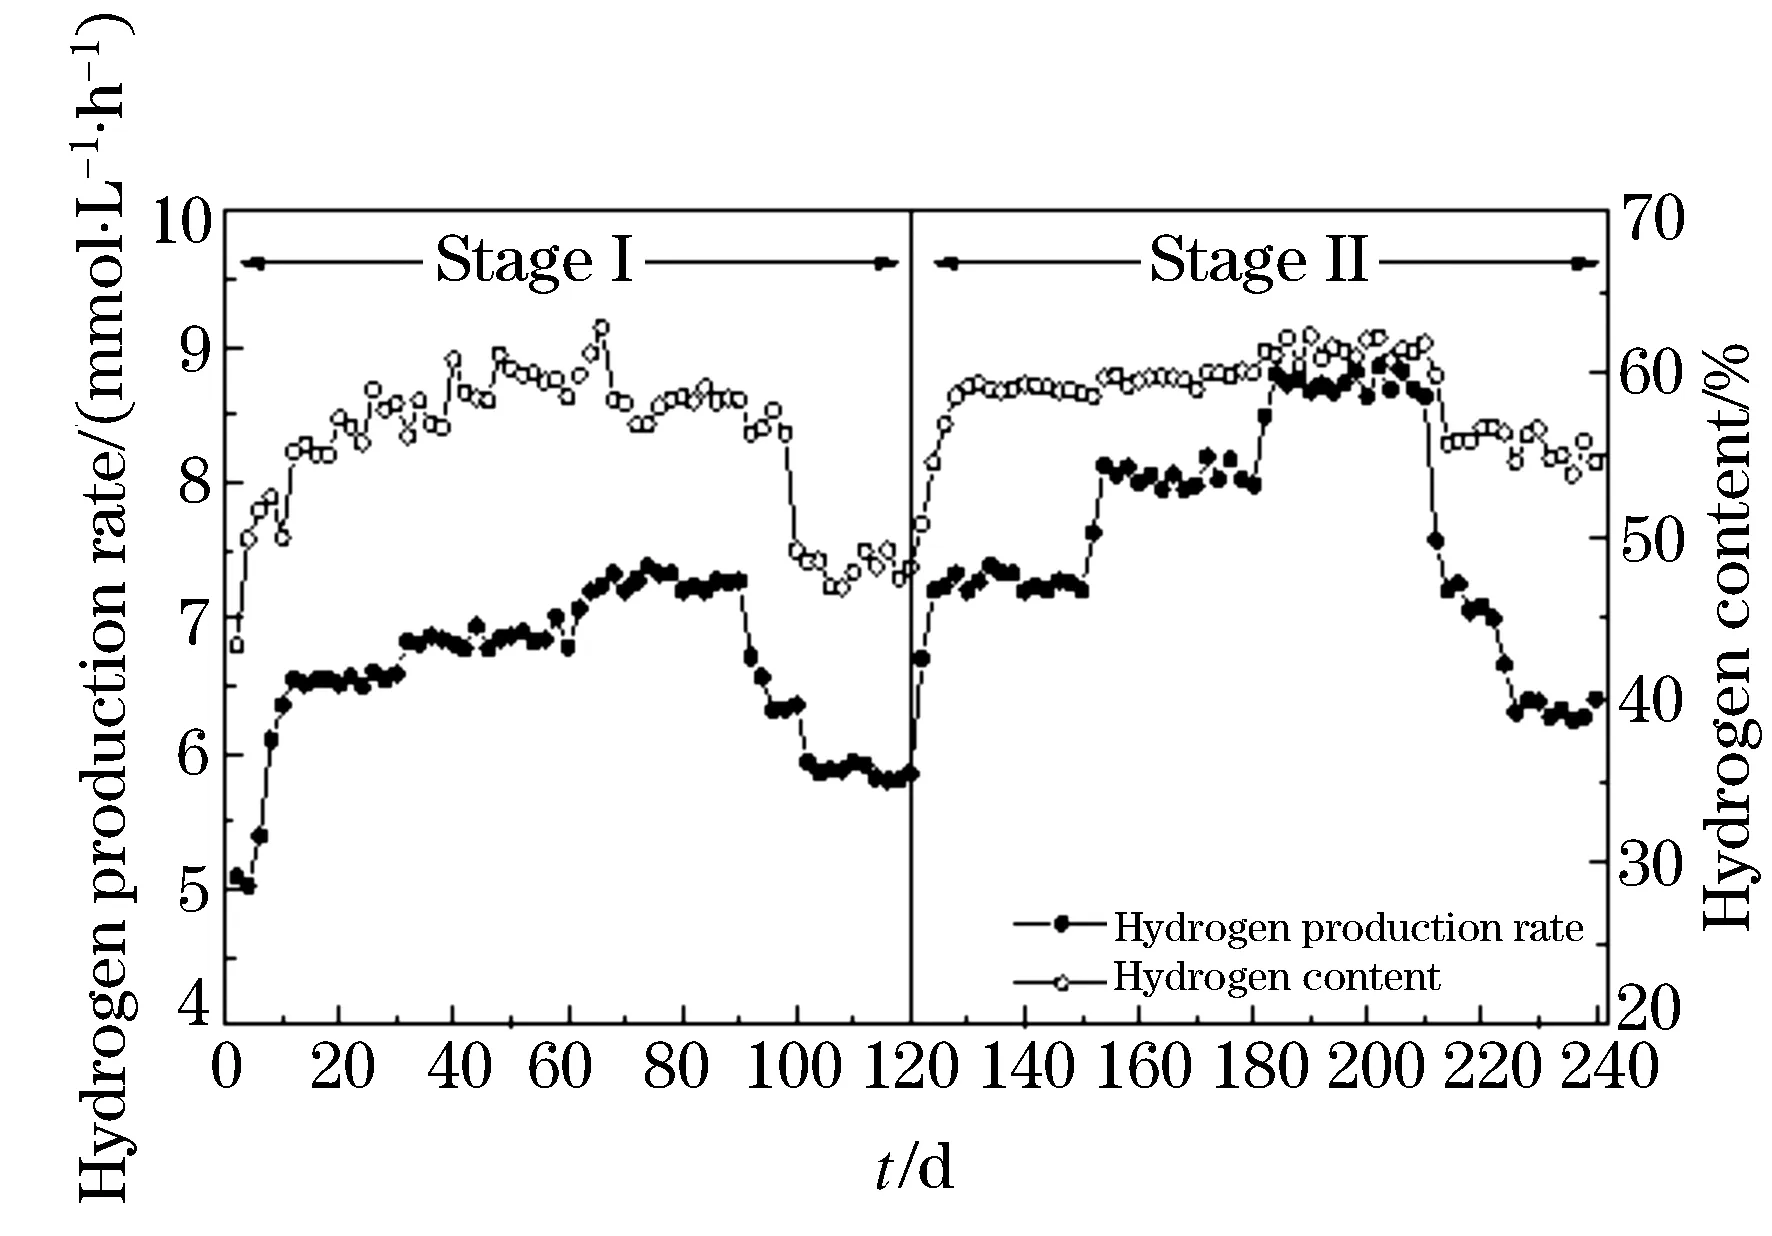
Figure 1 Profile of hydrogen productionand content during operation
2.2 Process performance of ACSTR system
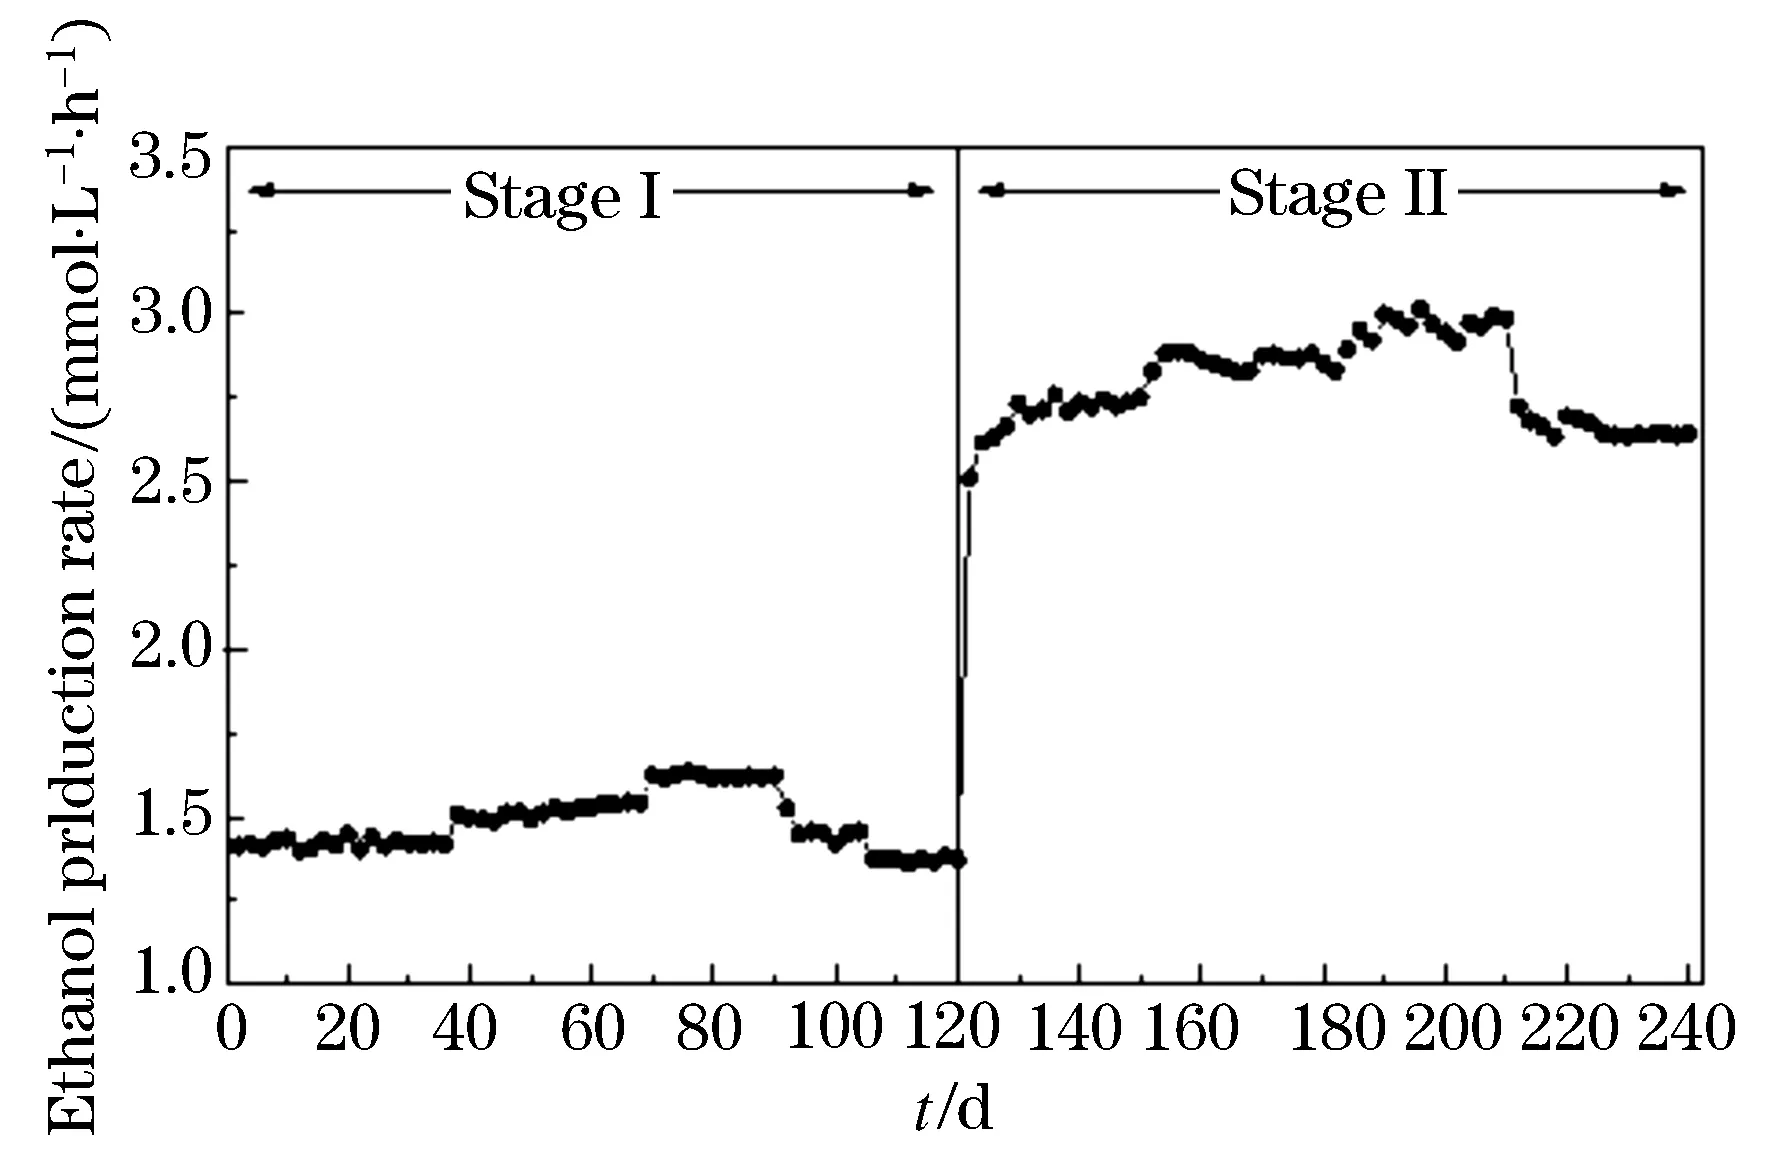
Figure 2 Profile of ethanol production rate during operation
Table 2 showsed the process performance of ACSTR system at different substrate concentrations and HRTs. System ORP ranged between -392 and -440 mV in anaerobic microenvironment. With inlet pH of feed being adjusted to 7.0 prior to feeding, outlet pH varied between 4.16 and 4.40 during the whole operation which might be attributed to the production of volatile fatty acid. This pH range for hydrogen and ethanol coproduction differed from other reports[15-16]. The pH range of 5.5~6 was considered to be ideal to avoid both methanogenesis and solventogenesis in addition hydrogen generation[17-18]. In this study, no detected methane in biogas indicated that low operational pH would effectively block the bioactivities of methanogenic bacteria which has considerable influence on the substrate removal. This might be the reason for relatively low substrate removal observed in ACSTR system, ranging between 31.2 and 39.3% accounting for substrate concentration of 0.71~2.90 g COD/L (Table 2).
Formation of hydrogen was accompanied with VFAs production and the distribution of metabolites was often considered as a crucial signal in assessing the metabolic pathway of fermentation process[19]. According to Table 2, the total VFAs concentration varied in the range of 1.49~2.75 g COD/L at substrate concentration condition and 2.75~3.44 g COD/L at HRT condition. The fluctuation in total VFAs production indicated the variations of bacterial metabolism and structure. Experimental data revealed the production of higher fraction of ethanol (37.2~63.7%) along with relatively lower fraction of acetate (13.6~21.4%), butyrate (13.9~30.8%) and propionate (7.5~10.3%). Ethanol was observed to be the major metabolite and suggested the persistence of ethanol-forming pathway, which is considered to be favorable microenvironment for effective hydrogen production[20]. Compared with the value obtained at substrate concentration condition, the increase by 83.3% in ethanol production rate indicated that the bacterial metabolism activities were forwarded to the direction of ethanol production at HRT condition. The substrate utilization in ACSTR indicated the ratio of substrate converted into hydrogen and ethanol in fermentation process. Based on experimental data (Figure 1 and 2), the obtained substrate utilization can be seen in Table 2. In this paper, expect for high substrate concentration (8 g COD/L) and short HRT (4 h) condition, about 45.8%~61.0% of substrate was converted into hydrogen and ethanol. Even though the conversion rate was lower than the theoretical conversion rate (66.7%), the obtained values are reasonably good.
Table2ProfileaboutprocessperformanceofACSTRsystemduringoperation

VariablesStage I: substrate concentration/(g COD·L-1)Stage II: HRT/h246810864ORP/mV(-417 ±6.2)(-413 ±11.4)(-422 ±9.8)(-416 ±10.9)(-437 ±7.6)(-420 ±11.4)(-440 ±12.5)(-392 ±6.3)pH(4.17 ±0.03)(4.16 ±0.07)(4.23 ±0.05)(4.27 ±0.05)(4.36 ±0.08)(4.25 ±0.07)(4.37 ±0.09)(4.40 ±0.05)TVFAs/(g COD·L-1)(1.49 ±0.15)(2.95 ±0.16)(3.34 ±0.11)(2.75 ±0.07)(2.76 ±0.17)(3.16 ±0.15)(3.44 ±0.14)(2.75 ±0.08)EtOH/TVFAs/%(38.7±2.5)(38.1 ±1.8)(41.2 ±1.9)(37.2 ±1.2)(57.8 ±2.4)(62.6 ±0.8)(63.7 ±1.4)(55.0 ±1.1)HAc/TVFAs/%(20.6 ±1.2)(20.7 ±0.7)(19.8 ±0.8)(21.4 ±0.5)(15.3 ±1.1)(13.6 ±0.8)(13.6 ±1.3)(14.8 ±0.9)HPr/TVFAs/%(8.9 ±1.3)(9.0 ±0.5)(8.1 ±0.4)(9.8 ±0.5)(9.1 ±0.4)(8.2 ±0.5)(7.5 ±1.1)(10.3 ±0.5)HBu/TVFAs/%(30.0 ±1.3)(30.8 ±1.5)(29.6 ±1.3)(30.3 ±0.9)(16.5 ±1.0)(14.2 ±0.5)(13.9 ±0.6)(18.3 ±0.9)Substrate removal/%(35.3 ±1.9)(35.3 ±3.1)(39.3 ±0.5)(36.4 ±1.4)(39.0 ±0.6)(38.9 ±0.9)(39.3 ±0.8)(31.2 ±2.3)Substrate utilization/%(60.1 ±7.6)(61.0 ±2.3)(45.8 ±7.9)(27.4 ±1.3)(46.0 ±2.9)(50.2 ±1.0)(50.5 ±1.9)(32.5 ±1.5)
HAc: acetate acid; HBu: butyrate acid; HPr: propionate acid; EtOH: ethanol; TVFAs (total volatile fatty acid) = HAc+HBu+HPr+EtOH.COD equivalent of VFAs: EtOH 2.09, HAc 1.07, HBu 1.51, HPr 1.82.
3 Discussion
In this paper, experimental data revealed the feasibility of sequential hydrogen and ethanol coproduction with mixed anaerobic culture microenvironment. At optimal condition (Substrate concentration: 6 g COD/L; HRT: 6 h), the ACSTR system obtained the highest hydrogen and ethanol production rate[21], and also obtained the maximum hydrogen production rate from molasses using ACSTR at substrate concentration 6 g COD/L and observed the serious inhibition of hydrogen production with higher substrate concentration. The hydrogen production rate of (8.73±0.07) mmol/(L·h) obtained is comparable with the production rate from other studies using anaerobic mixed culture microenvironment[22-23]. From Figure 2, it seemed that ethanol/hydrogen production has a similar variation tendency in the relationships between substrate concentrations, HRTs, hydrogen production and ethanol production. Both peak hydrogen and ethanol production rate occurred at substrate concentration 6 g COD/L of stage I and HRT 6 h of stage II. This result differ from some reports showing that in dark fermentation there is a possible competition of hydrogen and ethanol production, that is, high ethanol production can accompany low hydrogen production[24]. Some methods such as iron mineral limitation[25]have been taken to increase the production of ethanol without the reduction of hydrogen production. However, although formation of ethanol that would consume free electrons from NADH oxidation is usually unfavorable for hydrogen production[26], more hydrogen can generate from the change of metabolic pathway leading to the synthesis of more reduced fermentation metabolites such as acetate or butyrate[25]. Thereby, high hydrogen production can company high ethanol production[26].
Figure 3 showed a good description of linear correlation between ethanol production rate (y) and hydrogen production rate (x) for different substrate concentration and HRT condition, respectively. The linear regression results in each stage allowed the linear correlation to be expressed asy=0.156 6x+0.448 7 (r2=0.877 8) andy=0.148 8x+1.671 4 (r2=0.983 8), respectively. Regression coefficientr2indicated that there existed a stronger linear correlation between ethanol production rate and hydrogen production rate at HRT condition. As hydrogen and ethanol are coproducts in dark fermentation, it seemed that the optimization of one product was at the expense of another. Although few studies have so far looked on the coproduction of hydrogen and ethanol, most researchers recognized the competition relation between hydrogen and ethanol production. However, our study concurrently directed to the high hydrogen and ethanol production rate by controlling substrate concentration and HRT condition. The similar variation tendency (Figure 1 and Figure 2) for hydrogen and ethanol production rate also could correspond to equal optimization of both biofuels. This possibility may have energy advantages where alteration of flexible and variable energy carrier might satisfy different market demands. Moreover, separation of hydrogen and ethanol would be relatively easy since the two biofuels are present in different phases[16], enhancing the feasibility of coproduction of hydrogen and ethanol with mixed anaerobic culture microenvironment in dark fermentation.

Figure 3 The correlation between ethanol production rate and hydrogen production rate
Acknowledgments
Financial support was from public welfare research program (the early warning technology of environmental risk about the influence of pharmaceutical wastewater on environmental microbiology), Ministry of Environmental Protection, China (Grant No.200909043).
参考文献:
[1] HAWKES F R, DINSDALE R, HAWKES D L,etal. Sustainable fermentation hydrogen production: challenges for process optimization[J]. Int J hydrogen Energy,2002, 27: 1339-1347.
[2] DAS D, VEZIROGLU N T. Hydrogen production by biological processes: a survey of literature[J]. Int J hydrogen Energy,2001, 26: 12-28.
[3] NIELSEN A T, AMANDUSSON H, BJORKLUD R,etal. Hydrogen production from organic waste[J]. Int J hydrogen Energy,2001, 26: 547-550.
[4] HAWKES F R, HUSSY I, KYAZZE G,etal. Continuous dark fermentative hydrogen production by mesophilic microflora: Principles and progress[J]. Int J hydrogen Energy,2007, 32: 172-184.
[5] Liang TM, Cheng S S, Wu K L. Behavioral study on hydrogen fermentation reactor installed with silicone rubber membrane[J]. Int J hydrogen Energy,2002,27: 1157-1165.
[6] MOHAN S V, BHASKAR Y V, KRISHNA P M,etal. Biohydrogen production from chemical wastewater as substrate by selectively enriched anaerobic mixed consortia: Influence of fermentation pH and substrate composition[J]. Int J hydrogen Energy,2007, 32: 2286-2295.
[7] BALAT M, BALAT H, OZ C. Process in bioethanol processing[J]. Prog Energy Combust Sci,2008, 34: 551-573.
[8] JUNG K W, KIM D H, KIM S H,etal.Bioreactor design for continuous dark fermentative hydrogen production[J].Bioresour Technol.,2011, 102: 8612-8620.
[9] Wang X, Zhao YC. A bench scale study of fermentative hydrogen and methane production from food waste in integrated two-stage process[J].Int J hydrogen Energy,2009, 34: 245-254.
[10] HWANG M H, JANG N J, HYUN S H,etal. Anaerobic biohydrogen production from ethanol fermentation: the role of pH[J].J Biotechnol,2004, 111: 297-309.
[11]VAN G S, LOGAN B E. Increased biological hydrogen production with reduced organic loading[J].Water Res.,2005, 39: 3819-3826.
[12] LYND L R. Production of ethanol from lignocelluloses materials using thermophilic bacteria: critical evaluation of potential and review[J]. Adv Biochem Eng Biotechnol.,1989, 28: 1-52.
[13]APHA. Standard Methods for the Examination of Water and Wastewater[S].19th ed. American Public Health Association, Washington, DC.1995.
[14] ZHANG Z P, SHOW KY, TAY J H,etal. Effect of hydraulic retention time on biohydrogen production and anaerobic microbial community[J].Process Biochem.,2006, 41: 2118-2123.
[15]LIN CY, HUNG W C. Enhancement of fermentative hydrogen/ethanol production from cellulose using mixed anaerobic cultures[J]. Int J hydrogen Energy,2008, 33: 3660-3667.
[16] ZHAO C X, O-THONG S, KARAKASHEV D,etal. High yield simultaneous hydrogen and ethanol production under extreme-thermophilic (70 ℃) mixed culture environment[J].Int J hydrogen Energy,2009, 34: 5657-5665.
[17]Fang HP, Liu H. Effect of pH on hydrogen production from glucose by a mixed culture[J].Bioresour Technol.,2002, 82: 87-93.
[18] KHANAL S K, CHEN W H, LI L,etal. Biological hydrogen production: effects of pH and intermediate products[J].Int J hydrogen Energy,2004, 29: 1123-1131.
[19]VENKATA M, MOHANAKRISHNA G, SARMA P N. Integration of acidogenic and methanogenic process for simultaneous production of biohydrogen and methane from wastewater treatment[J].Int J hydrogen Energy,2008, 33: 2156-2166.
[20] REN N, WANG B, HUANG J C. Ethanol-type fermentation from carbohydrate in high rate acidogenic reactor[J]. Biotechnol Bioeng.,1997, 54: 428-433.
[21]HAN W, CHEN H, JIAO A Y,etal. Biological fermentative hydrogen and ethanol production using continuous stirred tank reactor[J]. Int J hydrogen Energy,2012, 37: 843-847.
[22] KIM S H, HAN S K, SHIN H S.Optimization of continuous hydrogen fermentation of food wastes as a function of solids retention time independent of hydraulic retention time[J].Process Biochem.,2008, 43: 213-218.
[23]VENETSANEAS N, ANTONOPOULOU G, STAMATELATOU K,etal. Using cheese whey for hydrogen and methane generation in a two-stage continuous process with alternative pH controlling approaches[J].Bioresour Technol.,2009, 100: 3713-3717.
[24] LI C, FANG H H. Fermentative hydrogen production from wastewater and solid wastes by mixed cultures[J].Crit Rev Environ Sci Technol.,2007, 37: 1-39.
[25]KENGEN S W, STAMA A J M, DE V WM. Sugar metabolism of hyperthermophiles[J]. FEMS Microbial Rev.,1996, 18: 119-137.
[26] WU K J, CHANG C F, CHANG J S. Simultaneous production of biohydrogen and bioethanol with fluidized-bed and packed-bed bioreactors containing immobilized anaerobic sludge[J].Process Biochem.,2007, 42: 1165-1171.