Fatigue Reliability Assessment of Correlated Welded Web-frame Joints
2014-07-30HuangGarbatovandGuedesSoares
W. Huang, Y. Garbatov and C. Guedes Soares
Centre for Marine Technology and Engineering (CENTEC), Instituto Superior Técnico, Universidade de Lisboa, Av. Rovisco Pais, 1049-001 Lisboa, Portugal
1 Introduction1
Fatigue assessment has been gaining attention during the last several decades and much effort has been spent to develop methodologies for predicting the fatigue strength or life of the welded joints in structures. The main step in fatigue analysis is based on direct calculations that involve the description of the wave induced loading,Guedes Soares(1990), the stress distribution, Guedes Soareset al. (2003),fatigue life estimation, Chakarovet al.(2008) and the probabilistic evaluation of the different steps to arrive at a reliability index or time dependent reliability, Garbatov and Guedes Soares (1998).
The hotspot stress approach, using the structural stress range∆σHSat the weld, considers additionally the effects of the structural discontinuity. The hotspot stress approach accounts for the stress increases due to the structural configuration or in other words, the macro-geometry. The hotspot stress approach as presented by Frickeet al. (2008)defines the reference points for the stress evaluation and extrapolation at certain distances away from the weld, which depend on the plate or shell thickness.
The notch stress approach, using the elastic notch stress rangekσ∆ , accounts for the notch effect of the weld toe or root, as initially proposed by Radaj (1990). It deals with problems of high or even infinite stress peaks at sharp notches and of micro-structural support effects defining the stress relevant for the crack initiation and propagation. The notch stress approach is one of the principal approaches included in the International Institute of Welding (IIW)fatigue design recommendations, as reported by Niemiet al.(2004).
The crack propagation approach uses special parameters such as the J-integral or the range of the stress intensity factor, ∆Kto describe the crack growth per cycle. The approach is well established for the fatigue assessment of welded details and many application examples may be seen,for example by Garbatov and Guedes Soares (2004). Simple stress calculation methods cannot accurately predict local stress responses. Sophisticated finite element models need to be used to describe the local stress responses and typically yield tohierarchical multilevel modelling where a lower level global model is used for calculating loads for the higher-level local model (Garbatovet al., 2010). Not only the mesh density of the local finite element model but also the accuracy of the loads applied to the local model influences the accuracy of the calculated local stresses.
Fatigue damage assessment of welded joints, based on the hotspot stress approach, is one of the most practical methods in combination with detailed finite element analysis as defined by Niemiet al.(2004). The aim of the detailed finite element analysis is normally not to calculate directly the stress at a detail, but to calculate the stress distribution in the region of the hotspot and to use these stresses as a basis for the derivation of the geometric stress concentration factors,which can even be considered as time dependent (Garbatovet al., 2002). In this aspect, the open literature has a large spectrum of the applied finite element modelling techniques(Guedes Soareset al., 2003).
The time variant formulation of the ship reliability results from modelling the problem with the stochastic processes that represent the random nature of the load and strength parameters. In general, failure is seen as the upcrossing of a threshold level that separates a safe state from an unsafe state. The time variant approach to ship structural reliability was developed in connection to the fatigue problem, in particular to be able to deal with the time degradation of reliability as presented by Garbatov and Guedes Soares(1998) and with the improvements made by the maintenance actions of Guedes Soares and Garbatov (1996b).
The present work covers several steps of calculations,including the generation of a three-dimensional finite element model of the web-frame structure with welded details. The fatigue damage and life of all hot spots in the structure is estimated to employ the S-N approach based on hotspot stress. The fatigue reliability of a web-frame joint is modelled as a series system consisting of several critical structural components (e.g. critical hotspot details).
2 Finite element analysis
The web-frame welded structure analyzed here is composed of a ship side shell plate, a longitudinal stiffener,five equally spaced transverse frames with stiffeners and welded lugs as can be seen in Fig. 1. The frame structure is made of normal shipbuilding steel, 235 MPa of the yield stress.
The structural geometry is given in Fig. 2, where the ship side shell plate is defined as 12 800 mm×800 mm×16 mm and five frames of 1 300 mm×800 mm×12 mm oriented in the longitudinal direction of the ship. The lugs are about 180 mm×149 mm×12 mm, which are attached to the longitudinal stiffener and the frame. The longitudinal stiffener is made of HP 320×14 mmand is 12 800 mm long.The stiffeners on the frames are made of HP 260×12 mm.
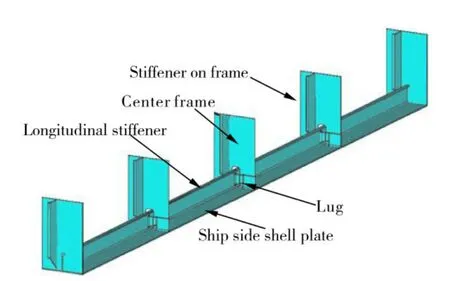
Fig. 1 Welded structure with multiple web-frame joints
The stresses and their distributions are influenced by the mesh density and element properties, which requires following some guidelines in predefining the element type,mesh size as well as the stress evaluation at the extrapolation points.
The complexity of the structural geometry and the existence of many hotspots, defined by welding toes,requires a three dimensional finite element model. The finite elements used in the present model are 20-node quadratic solid elements with mid-side nodes at the edges. The 20-node elements tolerate irregular shapes without much loss of accuracy. The displacement shapes of the elements are compatible with the model curved boundaries. The 20-node solid element has three degrees of freedom per node: translations in the nodal directionsX,YandZ.
The finite element model of the web-frame structure including weld toes is shown in Fig. 3. In order to save on computing time, a 3-D detailed finite element model of the middle part (three web-frame joints) of the entire welded structure with five web-frame joints is defined accounting for the periodic symmetry of the web-frame structure. The boundary conditions are defined in the way that all the displacements and rotations of the nodes in the bottom areas of the frames and stiffeners are constrained at zero. The finite element mesh is generated in such a way that a relatively coarse one is used in the zones away from the welded joints and a fine mesh of the element sizet×tis generated around the welded joints studied wheretrepresents the thickness of the local plate.
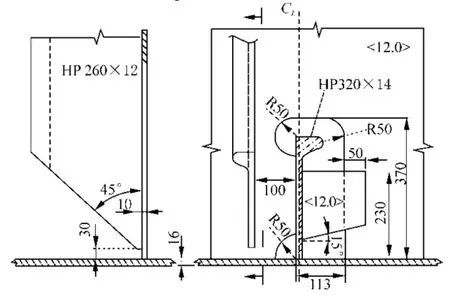
Fig. 2 Web-frame structuralsection
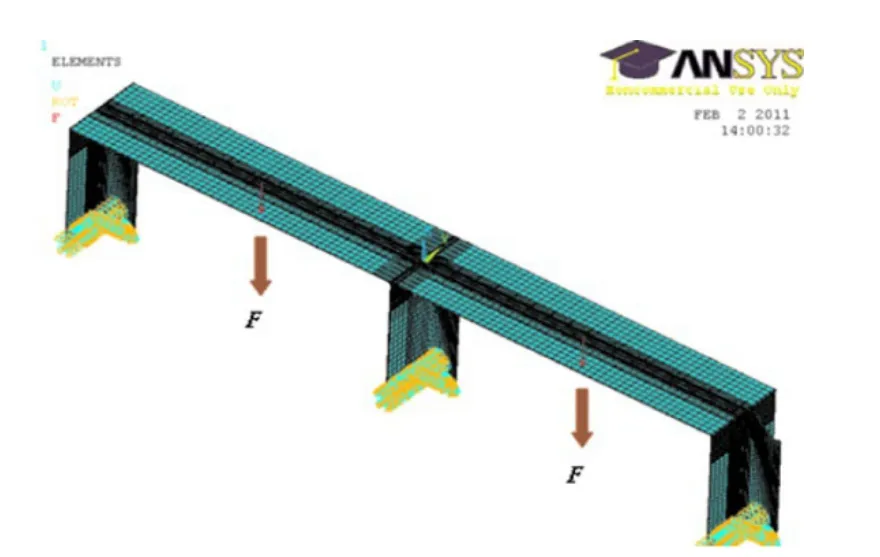
Fig. 3 Finite element model of the web-frame welded structure
The global finite element model of the entire web-frame welded structure consists of 24 051elements and 143 206 nodes. The material properties used for the FEA include the Young modulus,E=206MPa and a Poisson ratio of 0:3.The assumed loading is defined as the welded structurebeing subjected to two concentrated forces of 100 kN, which leads to a simplification of the load modelling (see Fig. 3).
The sizes of the weld toes, in the finite element model of the web-frame structure, are determined based on the IIW recommendations as reported by Niemiet al. (2004) and are listed in Table 1.

Table 1 Description of welded joints

Fig. 4 Types of welded joints
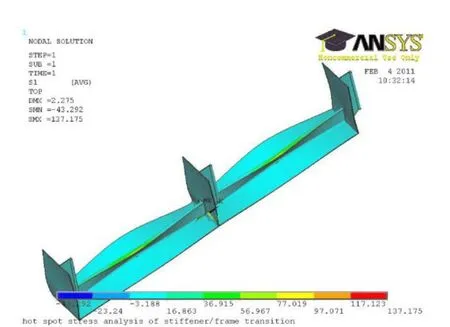
Fig. 5 Global structural stress distribution
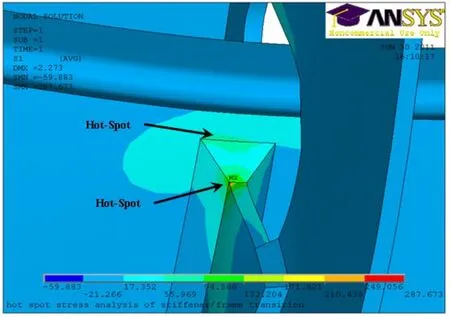
Fig. 6 Hotspots in the welded joint between the longitudinal stiffener and lug
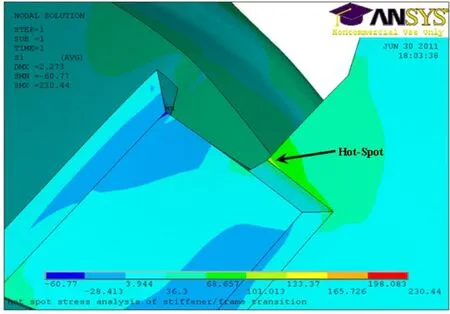
Fig. 7 Hotspot in the welded joint between the center frame and lug
The finite element analysis performed here, applies the linear static analysis capability of ANSYS. The aim of the finite element analysis is to determine the structural stress distributions around the welded joints and to locate the hot spots in the structure. Based on the results of the structural stress analysis, the structural stresses are defined. The weld joint is assumed to be polished and a fully penetrated butt weld. In our analysis, the stress concentration caused by welding defects will not be taken into account. Fig. 5 shows the structural stress (principal stress) distribution of the web-frame welded structure. Fig. 6, 7 and 8 show some high stress concentration areas.
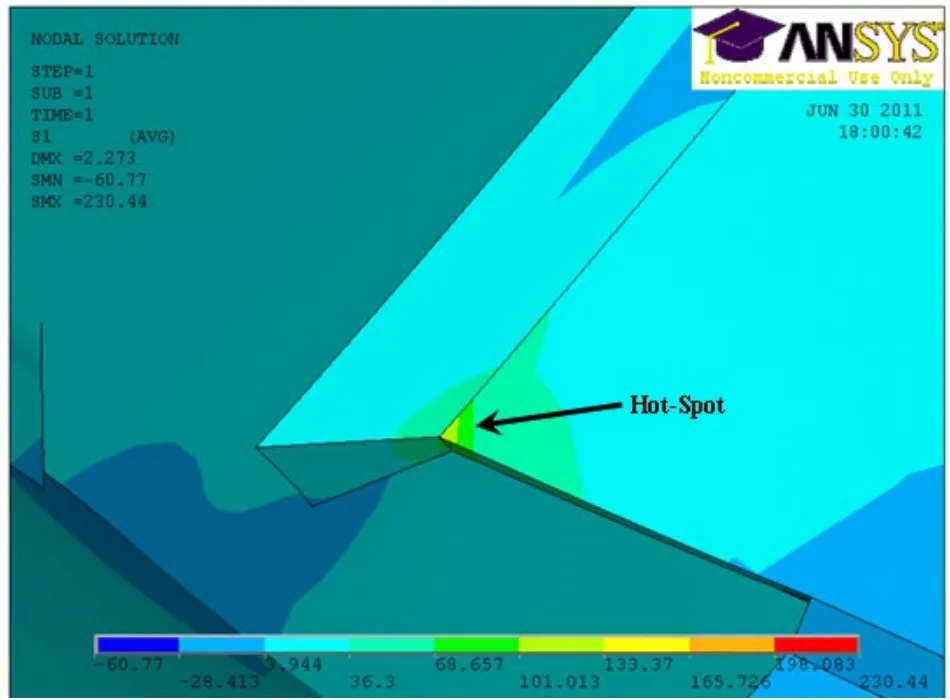
Fig. 8 Hotspot in the welded joint between the longitudinalstiffener and lug
3 Hotspot stress analysis
Currently the hotspot stress approach is the most acceptable method for analyzing a complex welded structure.The hot spot is a weld toe position in a welded structure where a fatigue crack may initiate due to the combined effects of structural stress fluctuation and weld geometry.The aim of the hotspot stress analysis is to evaluate the principal stress distribution around the welded structural details.
The structural stress at a hotspot is defined asσHS. The structural stress includes all the stress raising effects excluding the stress due to the local weld profile itself. The stresses are determined on the structural surface at the point of the vicinity of the welded joints as can be seen in Fig. 9.The structural stress is determined using reference points and extrapolation to the weld toe at the hot spot in consideration as defined by Hobbacher (2009).
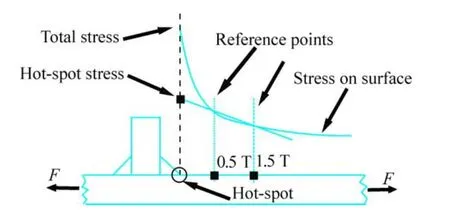
Fig. 9 Structural stresses
For fatigue assessment, the hotspot stressσHSis determined at the hot spot of the welded joint, where the maximum principal stresses are analyzed. The hotspot stressσHSis the maximum principal stress at the weld toe calculated at reference points and extrapolated to the weld toe at the hotspot in consideration.
The hotspot stress extrapolation procedures may be based on a surface stress extrapolation, with the assumption that the hotspot stress varies linearly through the plate thickness and the effects of the weld notch are localized within a distance close to the weld, where the locations of the reference points are not expressed as a function of plate thickness.
First, the stresses at the reference points are determined and secondly the hotspot stressesσHSare calculated using a linear extrapolation equation as given by Niemiet al.(2004):

wheretis the plate thickness,σHSis the structural stress,σ0.5tis the principal stress of the reference point, which is located at a distance away from the weld toe (hot spot) andσ1.5tis the principal stress at 1.5t.
The positions of all hotspots analyzed in a web-frame joint are marked as black dotsas shown in Fig. 10. There are 16 hotspots altogether and the results are shown in Table 2.
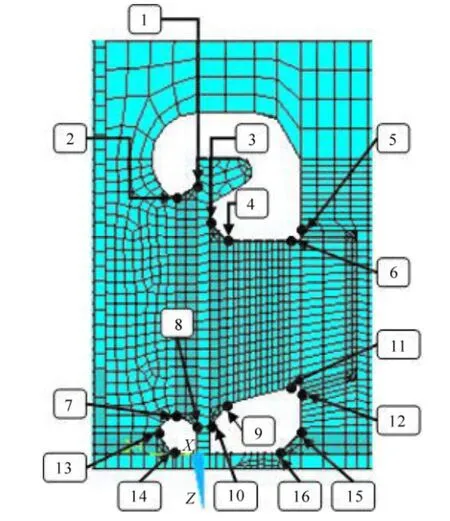
Fig. 10 Hotspots of web-frame welded structures

Table 2 Fatigue life and damage of each hotspot
4 Fatigue damage assessment
Fatigue damage analysis is based on the response of the welded joint structures to the wave induced loading. The long term distribution of wave induced loading may be estimated using the long term frequency of the occurrence of different sea states, in which each sea state is described by a significant wave height and zero crossing period. The long term distribution of the response is established as the weighted sum of the individual short term response distributions over all the sea states and heading directions,weighted with the relative occurrence rate of each combination of sea states and heading directions (Guedes Soareset al., 2003).
An adequate approximation for the long term distribution of wave induced loading can be described by the Weibull distribution as stipulated by Guedes Soares and Moan(1991). The long-term distribution of the stress range of the welded details is also assumed here to be a two-parameter Weibull distribution by:

whereQis the probability of exceedance of the stress rangeσ∆ , which is defined as a difference between the maximum and minimum stress amplitude as ∆σ=σmax−σmin,αLis the shape parameter of the Weibull distribution, which may be established from the long term wave load analysis andqis the scale parameter, defined as:

where0σ∆ is the stress range value at the local detail exceeded once out of0ncycles,0nis the total number of cycles associated with the stress range level,0σ∆ .
Once the stresses corresponding to each loading cycle in the fatigue loading are quantified, the cumulative fatigue damage can be calculated based on the Miner (1945) rules that accumulate individual fatigue damage ratios caused by all the stress range occurrences during the anticipated service life of the structure. The Palmgren-Miner linear cumulative damage hypothesis remains the most widely used methods for predicting the fatigue life of welded joint structures subjected to fatigue loading. The basic assumption of the S-N approach is that the structural damage per load cycle is constant at a given stress range.
The basic design S-N curve is given as DNV (2003):

where Γ(∙) represents the Gamma function, and it can be written as:

whereNdefines the predicted number of cycles to failure,qis calculated as the scale parameter of the Weibull distributed long-term stress range,Kis a parameter, given as 1012.38andmis a material parameter of the S-N curve for welded joints in an air/cathodic protected environment,given as 3.0 representing the 97.5 confidence level of the S-N curve (DNV, 2003).
A one-slope S-N curve is used for the fatigue damage assessment as defined by Nolte and Hansford (1976):

whereν0is the long-term average response zero-crossing frequency, assumed as 0.1Hz,Tdis the ship design life,taken as 25 years, which can be converted into 7.884E+8 seconds,Lαis considered as 1.0 andDrepresents the accumulated fatigue damage.
The cycling load acting on the web-frame welded structure varies from -100 kN to 100 kN, resulting from the hotspot stress range ∆σHSfor each weld toe in the web-frame structure. The notch spot stress range is defined asaccounting for an assumed zero mean stress level,fm=0.9, assumed for a worldwide trading route,fe=0.8 and by the stress concentration factor due to the weld geometry, which is taken here for simplicity asKw=1.5as defined by DNV (2003), as can be seen in Table 2. The shakedown effect is not considered here.
Table 2 summarizes the fatigue damage of the hotspots of the web-frame. The fatigue life of each individual hotspot is determined using Eq.(5) and the accumulated fatigue damage of each hotspot during the design service life of the welded joint structure is performed based on Eq.(6). The comparison of fatigue damage between different hotspots is shown in Fig.11.

Fig. 11 Fatigue damage of each hot spot (without weld improvement)
As may be seen from Fig. 11, the maximum fatigue damage is observed at the hotspot 4, which is equal to 1.024.This hotspot contains a sharp corner which may start growing a fatigue crack when the structure is subjected to fatigue loads, thus reducing or eliminating the crack initiation stage of the fatigue life.
The principal ways to reduce the probability of crack initiation is by reducing the stress concentration factor of the weld, removing the crack-like defects at the weld toe or by removing the harmful tensile welding residual stresses or introducing compressive stresses. The first two methods involve altering the local geometry and are identified as weld geometry modification methods and the third one is identified as a residual stress method.
The hot spot 4 is considered to be treated with the post weld improvement technique using weld toe grinding leading to a final fatigue damage of 0.2 and this is the fatigue damage that is used for the reliability assessment.
5 Fatigue reliability
Using the S-N fatigue damage approach, the fatigue damage may be defined based on Eq. (6), as:

whereaNormal distributed random variableBis considered to take into account the uncertainty in the fatigue stress estimation. As the stress calculation has several steps, each of which with its own uncertainty, the stochastic variableBcan be split into four components includingBLmodelling the uncertainty in the load calculation,Bσmodelling the uncertainty with the nominal stress calculation,BHmodelling the uncertainty of the hot spot concentration factors andBQmodelling the uncertainty of the weld quality and of the value of misalignment.
Based on an extensive study reported by Folsoet al.(2002) and some different suggestions for the stochastic modelling of the variables that accounts for the uncertainty in fatigue stress estimation, the following stochastic model is proposed for the present reliability calculations.
The reliability calculations can also be performed using the total uncertainty in fatigue stress estimation represented by the random variableBwith a mean value and coefficient of the variation determined by:

whereiandCiare the mean value and the covariance respectively of the i-th uncertainty.
The choice of a stochastic model is a very complicated issue. Table 3 shows the assumed descriptors of the random variable B. Several models have been proposed by Mansouret al. (1997), where a finite element analysis was carried out in order to determine the stresses, which may explain the small COV’s in the three random variables describing the uncertainty connected with the estimation of the fatigue stresses,Bs;BHandBQ.
The mean value ofcan be calculated by:

whereKis assumed here as 1012.38andsis the standard deviation of log10Kequal to 0.2 as given by DNV (2003).
A round robin study on the numerical analysis of local stresses on a ship’s structural details has been performed by Frickeet al. (2008) which quantified the uncertainties related to modelling and stress evaluation and identified the sources of the scatter. The round robin studywas performed by using a different expertise in modelling welded structures and evaluating the hotspot and notch stresses. The results showed some scatter of the computed stresses which are highest in the rather complex second example. It has been pointed out that the sources of the scatter are mainly due to different types and properties of the finite elements, the mesh density chosen and the type of stress extrapolation used for the determination of the hotspot stress. Typical coefficients of variation seen from local stress analyses are in the order of 5%, while in complex details somewhat higher scatter may occur and particularly when shell elements and simplified weld modelling are used.
Also it should be noted that the uncertainty in the load calculation,BLis based on the linear strip theory approach.However, these uncertainties can vary depending on how the structural analysis is performed, the use of the beam theory or finite element theory with local or global models. Another variation can be observed due to some minor differences in how the load is formulated (see Table 1).

Table 3 Uncertainty with the fatigue stress estimation
Based on Eq. (7), the first two moments of fatigue life are linearized aboutKandqand the acknowledgement that they are not correlated is expressed, Guedes Soares and Garbatov(1996a, b) by:

Fatigue life,N(years) is a random variable too, following a two-parameter Weibull distribution, as:

whereNαis the shape parameter andNβis the scale parameter of the fatigue life distribution. The statistical properties of the Weibull distribution, the mean value and the variance of the fatigue life can also be expressed as:

As can be seen from Table 2, the hot spots 3, 4, 5, 9 and 12 are the most critical ones that govern the fatigue life of the web-frame welded structure. The probabilistic characteristics of the fatigue life of the critical hot spots are calculated and presented in Table 4.
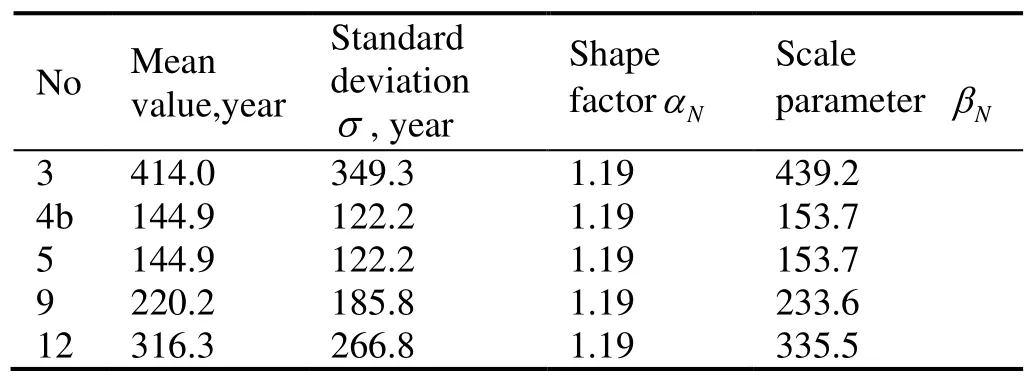
Table 4 Probabilistic descriptors of the fatigue life
It is assumed that the fatigue life is following the Weibull distribution and the reliability of any hotspot may be defined by:

whereαN,iβN,iare given in Table 4. Fig. 12 presents the fatigue reliability assessment of the series system of five critical hot spots operating during a 50-year service life.
The system reliability of the web-frame joint, containing those five critical hot spots, is defined as a series system.The failure of any hot spot will result in the failure of the web-frame joint. The fatigue life of the web-frame joint(system) is also assumed to follow a two-parameter Weibull distribution. If the fatigue life of each individual critical hot spot is considered independently, then the reliability of the series system may be calculated as:

whereSαis the shape factor andSβis the scale parameter of the reliability of the system, modelled by the Weibull distribution.
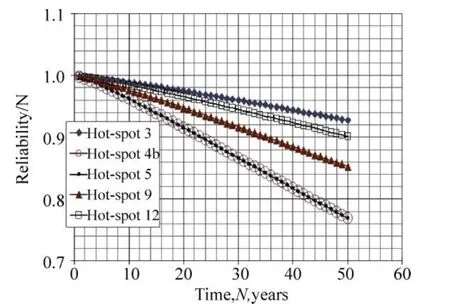
Fig. 12 Fatigue reliabilities of the critical hot spots
Fig. 13 presents the variation of ln[−ln(RS)] with the natural logarithms of the service lifeND, whereRSis the fatigue life reliability of the entire web-frame joint composed of the five critical hotspots calculated as:

Based on the fitting of ln[−ln(RS)] at the different service life, using a straight line as shown in Fig. 13, the shape factor and the scale parameter of the fatigue life of the entire web-frame joint is defined asαS=1.19 andβS=56.51.The probability of failure of any hotspot may be defined as presented by Melchers, (1999)as:

whereiβis the reliability index calculated asβi(N)=−Φ−11−Ri(N).

Fig. 13 Fatigue reliability of the web-frame joint
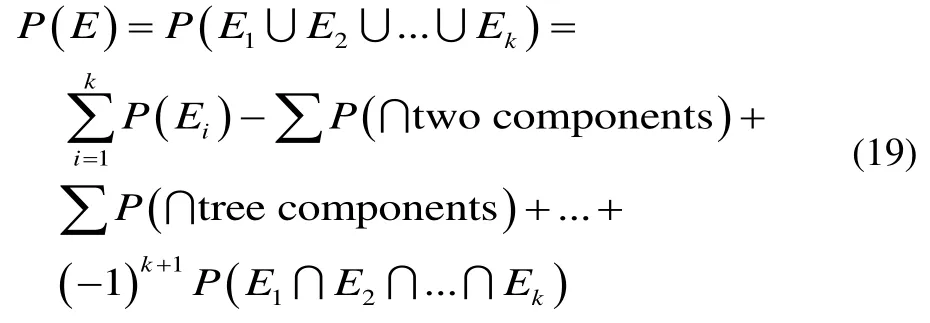
The occurrence of the failure mode at any hotspot(component),Ei, for a series system of multiple components,will cause the failure of the entire system. The failure mode of the entire system composed ofkcomponents,Eis a union of all possible component failures, which can be expressed as follows:

The failure probability can be computed either by use of Morgan’s law,Papoulis, (1984):
or by the use of bounding techniques including the “narrow”bounds on the probability of failure of a series system asproposed by Ditlevsen, (1979b):

where the joint probabilities of failure,P(Eij) can be expressed as given by Ang and Tang, (1984):

where:

whereiβandjβare the reliability indices corresponding to the failure mode of the i-th and j-th component respectively,ijρis the correlation coefficient between thei-th andj-th component’s failure mode andφ2(.)andΦ2(.)are the probability density function and cumulative distribution function respectively, of the 2D standard normal distribution.
Eq.(20) represents the narrow bounds for the system probability of failure, and the joint failure modes are still regarded. Ditlevsen (1979a) also proposed a method for the bounding joint probability of failure,P(Eij) as:

where,

Although, the Ditlevsen (1979b) bounds demonstrated to be more practical and usable than the exact expressions as can be seen from an example by Garbatov and Guedes Soares (2011). In the present study, the effects of the assumed correlations of 0.5, 0.75 and 0.9999 between the component failure modes and accounting for the Ditlevsen bounds, using Eq. (20), for determining the joint probability of failure is analyzed. For any actual structure the correlations between components have to be identified based on a specific algorithm. It is expected that when the hotspots are closely located, and manufactured with similar quality and are subjected to similar loading, the correlation between any two hotspots will be very strong.
Fig. 14 shows the reliability of a web-frame welded hotspot at several critical fatigue hotspots modelled by a series system of correlated components (failure modes) as a function of service life.
Finally, for a structure composed of three web-frame joints as shown in Fig. 1, the system reliability is modelled as a parallel structural system of the three components. The fatigue reliability of the structure subjected to a given wave induced loading at the given service life is calculated as:

and it is shown in Fig. 15.
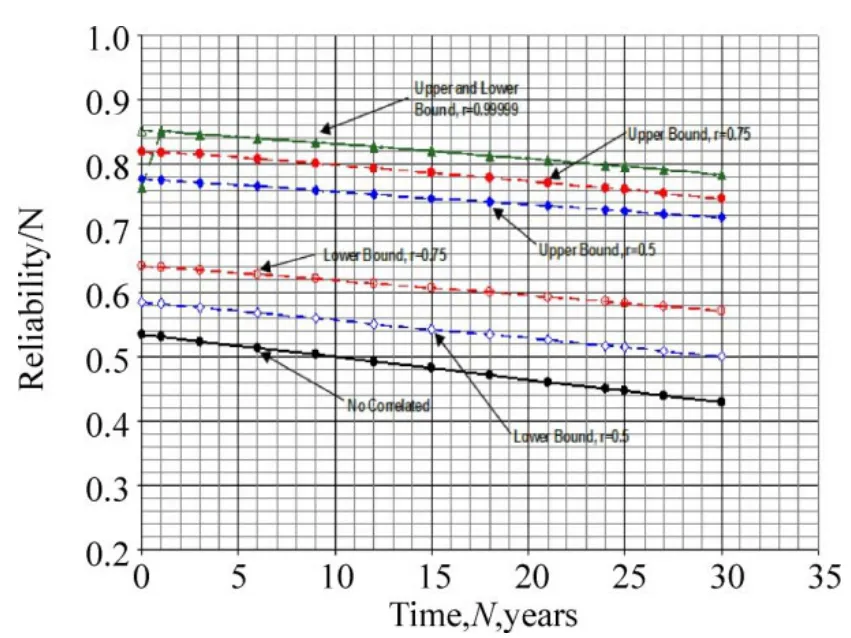
Fig. 14 System reliability (series) of the web-frame joint,RS,1(N), as a function of time
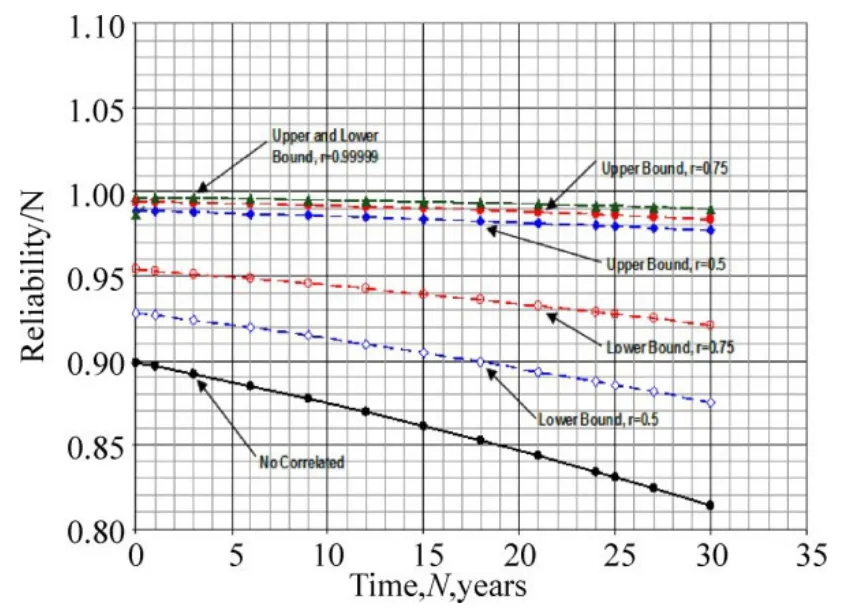
Fig. 15 System reliability (parallel) of the entire structure
6 Conclusion
The present work analyzed the fatigue reliability of a complex ship side shell structure. The welded structure is composed of three web-frame joints including several hotspots. The finite element analysis of the web-frame structure revealed the areas of high stress concentrations.The hot spots in the welded structure are identified by using a linear extrapolation. The fatigue damage assessment of each hotspot is quantified based on the S-N approach. The comparison of the fatigue damage of each hotspot of the web-frame structure showed that the fatigue damage of the hotspot 4 exceeds 1.0 during the anticipated service life of the structure and the fatigue life is less than the design life.Hotspot 4 is the most critical for the structural integrity of the web-frame structure. Hotspot 4 is located in the welded joint between the lug and the longitudinal stiffener in the web-frame structure, so this welded joint is the most critical structural element.
The results demonstrated that the welded joint between the longitudinal stiffener and lug cannot provide adequate fatigue strength and it is the weakest hot spot of the structure where fatigue crack initiation is most probable. The fatigue strength of the welded joint, between the longitudinal stiffener and the lug in the web-frame welded structure,should be reinforced in order to strengthen the structure.Further structural redesign may be needed.
The welded joint of hot spot 4 is considered to be treated with the post weld improvement technique using weld toe grinding leading to a final fatigue damage of 0.2 and this is the fatigue damage that is used for the reliability assessment.
The statistical descriptors of the fatigue life and reliability of each critical hotspot were estimated. The fatigue reliability of the web-frame joint, modelled as a series system of correlated components, containing several critical hotspots, was evaluated based on the Ditlevsen bounds. The statistical descriptors of the reliability of the series system with non-correlated components were also estimated. Finally,the reliability of the entire welded structure composed of three web-frame joints and modelled as a parallel structural system with non-correlated web-frame joints was analyzed.
Acknowledgements
This work was performed within the project Risk-Based Expert System for Through-Life Ship Structural Inspection and Maintenance and New-Build Ship Structural Design(RISPECT) and was partially funded by the European Union through the contract SCP7-GA-2008-218499.
Ang A, Tang H (1984).Probability concepts in engineering planning and design. John Wiley and Sons, Inc.
Chakarov K, Garbatov Y, Guedes Soares C (2008). Fatigue analysis of ship deck structure accounting for imperfections.
International Journal of Fatigue, 30(10-11), 1881-1897.
Ditlevsen O (1979a). Generalised second moment reliability index.
Journal of Structural Mechanics, 7, 435-451.
Ditlevsen O (1979b). Narrow reliability bounds for structural systems.Journal of Structural Mechanics, 7(4), 453-472.
DNV (2003). Fatigue assessment of ship structures. Classification notes 30.7, Hovik, Norway, Det Norske Veritas.
Folso R, Otto S, Parmentier G (2002). Reliability-based calibration of fatigue design guidelines for ship structures.Marine Structures, 15(6), 627-651.
Fricke W, Bollero A, Chirica I, Garbatov Y, Jancart F, Kahl A,Remes H, Rizzo C, Selle H, Urban A, Wei L (2008). Round robin study on structural hot-spot and effective notch stress analysis.Ships and Offshore Structures, 30(10-11), 335-345.
Garbatov Y, Guedes Soares C (1998). Fatigue reliability of maintained welded joints in the side shell of tankers.Journal of Offshore Mechanics and Arctic Engineering, 120, 2-9.
Garbatov Y. and Guedes Soares C (2004). Influence of steel strength on the fatigue reliability of welded structural components.
International Journal of Fatigue, 26, 753-762.
Garbatov Y, Guedes Soares C (2011). Fatigue reliability assessment of welded joints of very fast ferry subjected to combined load.
International Journal of Maritime Engineering(RINA Transactions Part A), 153(A4), 231-241.
Garbatov Y, Rudan S, Guedes Soares C (2002). Fatigue damage of structural joints accounting for non-linear corrosion.Journal of Ship Research, 46, 289-298.
Garbatov Y, Rudan S, Guedes Soares C (2010). Fatigue assessment of welded trapezoidal joints of a very fast ferry subjected to combined load.Engineering Structures, 32(3), 800-807.
Guedes Soares C (1990). Stochastic modelling of maximum Still-Water load effects in ship structures.Journal of Ship Research, 34, 199-205.
Guedes Soares C, Garbatov Y (1996a). Fatigue reliability of the ship hull girder.Marine Structures, 9, 495-516.
Guedes Soares C, Garbatov Y (1996b). Fatigue reliability of the ship hull girder accounting for inspection and repair.Reliability Engineering >amp; System Safety, 51, 341-351.
Guedes Soares C, Garbatov Y, von Selle H (2003). Fatigue damage assessment of ship structural components based on the long-term distribution of local stresses.International Shipbuilding Progress, 50, 35-56.
Guedes Soares C, Moan T (1991). Model uncertainty in the long-term distribution of wave-induced bending moment for fatigue design of ship structure.Marine Structures, 4, 295-315.
Hobbacher A (2009). Recommendations for fatigue design of welded joints and components.IIW doc.1823-07, Welding Research Council Bulletin 520, New York, International Institute of Welding.
Mansour A, Wirsching P, Luckett M,Plumpton A (1997).Assessment of reliability of ship structures, ship structure committee, SSC-398.
Melchers R (1999).Structural reliability analysis and prediction.John Wiley and Sons Ltd.
Miner MA(1945). Cumulative damage in fatigue.Journal of Applied Mechanics -Transactions of the ASME, 12(3), A159-A164.
Niemi E, Fricke W, Maddox S (2004). Structural stress approach to fatigue analysis of welded components-designer´s guide. IIW Doc. XIII-1819-00/XV-1090-01.
Nolte K, Hansford J (1976). Closed-form expressions for determining the fatigue damage of structures due to ocean waves.Proceedings Offshore Technology Conference, 861-870.
Papoulis A (1984).Probability, Random Variables, and Stochastic Processes. New York, McGraw-Hill.
Radaj D (1990).Design and Analysis of Fatigue-Resistant Welded Structures. Cambridge, Abington Publishing.
杂志排行
Journal of Marine Science and Application的其它文章
- CFD Simulation of the Vertical Motion Characteristics of the Moonpool Fluid for the Truss Spar
- Floating Production Platforms and their Applications in the Development of Oil and Gas Fields in the South China Sea
- Numerical Investigation of Mooring Line Damping and the Drag Coefficients of Studless Chain Links
- Dynamic Coupled Analysis of the Floating Platform Using the Asynchronous Coupling Algorithm
- Bucket Group Effect of the Composite Multi-bucket Structure
- An Approximate Method for the Surge Response of the Tension Leg Platform
