Simulation of a Reverse Flow Reactor for the Catalytic Combustion of Lean Methane Emissions☆
2014-07-12JiajinZhangZhigangLeiJianweiLiBiaohuaChen
Jiajin Zhang,Zhigang Lei,Jianwei Li*,Biaohua Chen
State Key Laboratory of Chemical Resource Engineering,Beijing University of Chemical Technology,Beijing 100029,China
Simulation of a Reverse Flow Reactor for the Catalytic Combustion of Lean Methane Emissions☆
Jiajin Zhang,Zhigang Lei,Jianwei Li*,Biaohua Chen
State Key Laboratory of Chemical Resource Engineering,Beijing University of Chemical Technology,Beijing 100029,China
A R T I C L E I N F o
Article history:
Received 24 December 2013
Received in revised form 27 January 2014 Accepted 17 March 2014
Available online 18 June 2014
Methane
Catalytic combustion
Reverse flow reactor
Modeling
This work is focused on the performance prediction of pilot scale catalytic reverse flow reactors used for combustion of lean methane-air mixtures.An unsteady one-dimensional heterogeneous model for the reactor was established to account for the influence of the reactor wall on the heat transfer.Results of the simulation indicate that feed concentration,switch time and compensatory temperature impose important influence on the performance of the reactor.The amount of the heat extracted from the mid-section of the reactor can be optimized via adjusting the parameters mentioned above.At the optimal operating conditions,i.e.switching time of 400 s, feed concentration of1%(by volume),and insulation layer temperature of 343 K,the axial temperature of the reactor revealed a comparatively symmetrical“saddle”distribution,indicating a favorable operating status of the catalytic reverse flow reactor.
©2014 The Chemical Industry and Engineering Society of China,and Chemical Industry Press.All rights reserved.
1.Introduction
Global warming caused by greenhouse gases(GHG)in the atmosphere is currently a major concern[1].Primary GHG includes carbon dioxide,methane and other hydrocarbons,and oxides of nitrogen[2]. A significant source of methane is fugitive emissions released during the production and transportation of fossil fuels,for example,from underground coal mines[3,4].Methane has a global warming potential 23 times than carbon dioxide on a mass basis,therefore the complete combustion of methane will reduce equivalent carbon dioxide emissions by a factor of about 20,even though carbon dioxide is produced at the meantime[5].
The combustion of fugitive emissions,in particular lean methane emissions,presents some problems[6].Fugitive emissions of relatively high concentration can be burnt in a fl are,however,the methane concentration in many fugitive emission streams is low(0.3%-1.0%,by volume)[4].These emissions are unbeneficial for both safety and climate change reasons,and also represent waste of energy which may be used as fuel in certain applications if captured[7].However, homogeneous combustion reactions are unfavorable at such low concentration.Catalytic combustion is an effective method of burning methane,which offers many advantages over conventional combustion, especially for lean mixtures[8,9].
The main problem for catalytic combustion of lean methane mixtures is the necessity of a high reactor temperature.For the feed at ambient temperature,some pre-heating equipments would be required to achieve ignition temperature.Catalytic reverse flow reactor(RFR)is a very interesting alternative to overcome this problem[10,11].Catalytic RFR consists of a catalyst bed in which the feed flow direction is periodically reversed.Therefore,if the adequate switching time was ensured,the combustion heat would be restrained inside the reactor[11].
In such a case,a quasi-periodic state operation may be achieved in which the reactor temperature pro file has a maximum value near the center of the reactor,which slowly oscillates within the reactor as the feed is switched periodically.Because the temperature in the center of the reactor can greatly exceed the insulation temperature,energy can be withdrawn from the center both as a means of control and as a source of useful energy[11].For example,RFR was used for catalytic decontamination of waste gases,as reported in[12],where a heat exchanger was added in the center of the reactor to remove heat.This ensured that the reactor did not over heat and deactivate the catalyst or damage the reactor.The heat removed from the reactor may be used for utilities such as heating a building or driving a small turbine.
Computer modeling was a valuable tool as an aid in understanding the processes and assisting with design.Models specific to RFR have been reported for a variety of applications,and was used to investigate a variety of operating parameters,either from a theoretical viewpoint or coupled with experiments.Many models are related to one dimensional(1D),and either pseudo-homogeneous or heterogeneous models[13,14].Two-dimensional models have also been developed [15,16].
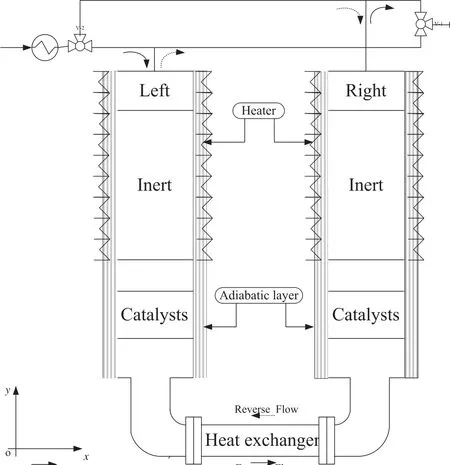
Fig.1.Frame scheme for the reverse flow reactor with a middle heat exchanger[12].
In this work,a scaled-up catalytic reverse flow reactor with heat exchanger added in the center of the reactor to remove heat for the combustion of fugitive emissions of methane were simulated by means of a 1D heterogeneous model,in which the intrinsic kinetics were measured independently in this work.Compared with the simulations of many years of research,the influences of heat extraction and insulation layer temperature which is used as compensation for the loss in the reactor wall were investigated.The aim of this work was to investigate the influence of operational conditions on the steady-state performances with high gaseous hourly space velocity(GHSV)and explore the feasibility of heat extraction from the middle of the reactor. Most of the relevant operating conditions,such as feed concentration, pressure drop,and switch time and insulation layer temperature were considered.Maximum temperature reached in the reactor,critical or maximum switch time allowable for stable operation,and favorable insulation layer temperature were determined for the reactor.
2.Model Descriptions
2.1.Physical model
A RFR concept appropriate for relatively large flow rates was illustrated in Fig.1.The distribution of axial-radial reactor bed for RFR was shown in Fig.2.
The reactor system has two separate stainless steel reactors with insulation layer installed around the external wall and connected by a heat exchanger at the bottom.The physical dimension of the reactor was shown in Table 1.The insulation layers are electrically heated and temperature controlled,so as to adjust the wall heat transfer condition for better RFR performance.Two three-way valves and associated transfer piping allow for either forward or reverse flow operating modes. Each reactor consisted of inert and catalyst sections and empty spaces in between.The inert sections were packed with blank Al2O3particles, whose physical properties were shown in Table 2.Reaction heat was extracted from the heat exchanger.

Table 1 Geometry and physical properties for the RFR
Regarding the solid bed,physical properties changed along the reactor because it was formed by two consecutive sections:upper inert and lower active.The active part was full of particles which was the mixture of catalyst(Pd/Al2O3)and inert spheres.The high activity of the catalyst was so adequate for the RFR operation that the central section was formed by a mixture of catalyst(50%,by volume)and inert particles (i.e.refractory ceramic spheres of the same diameter).The inert part was formed only by spherically shaped refractory ceramic material.
In this work,the non-steady model was established for the combustion of methane in RFR in a heterogeneous and one-dimensional manner.The heterogeneous model can clarify the temperature difference between solid and fluid,which will be large in highly exothermic reactions.The only dimension taken into account in the model is the axial one,because for the reactor operating at the conditions of this work, temperature and velocity radial profiles are almost fl at(except in the vicinity of the reactor wall),and hence the difference in the results between one-dimensional(much easier to solve)and two-dimensional models is very small.
The temperature of the wall insulation layer remained constant,in order to complement heat losses to the wall.So that the temperature radial profiles were almost fl at;and the reactor was assumed to be one-dimensional.Butit was necessary to take into account for the influence of the wall it self in RFR.That is to say,part of heat can be transferred axially along the wall to reach the inert part of bed.This heat transfer has a negative effect on the stability of the reactor,which had been demonstrated by research on a reactor of0.05 m diameter[17]: the reactor stability increases as the reactor diameter increases and the wall thermal conductivity decreases.Furthermore,the behavior of pilot-plant reactors,with relative small diameter and a high thermal conductivity wall(for example,constructed in steel),are strongly affected by this phenomenon,which must be taken into account in the simulation model.
In the case of methane combustion,homogeneous reaction(combustion in gas phase)only occurs at very high temperature(>800°C). In this work,the reactor runs at much lower temperature so that the homogeneous combustion can be neglected.Ideal gas behavior for the gas phase was also assumed.

Fig.2.Axialallocation of-reactor sections and heat exchanger for RFR.

Table 2 Solid physical properties for particle beds[18]
2.2.Basic equations
The mathematical model for RFR was constituted by several partial differential and algebraic equations.The differential equations were obtained from mass and energy conservations,and applied separately to the gas and solid phases.The algebraic equations were the ones used to estimate the physical and transport properties.
Mass balance for the gas phase:

Energy balance for the gas phase:

Mass balance for the solid phase with a 1.5 order reaction:


Energy balance for the solid phase:

Energy balance for the wall:

The right hand side of Eq.(6)contained the axial heat conduction along the reactor wall,heat transfer between solid phase and reactor wall and that to reactor wall from insulation layer.
Energy balance for the heat exchanger:

2.3.Boundary and initial conditions
The initial conditions were given as follows:

Danckwerts boundary conditions were adopted.
At the inlet:


At the outlet:


Fig.3.Diagram of the equipment used for kinetic experiments of lean methane catalytic combustion.1—air compressor;2—pressure maintaining valve;3—three-way valve;4—mass flow meter;5—one-way valve;6—methane bottle;7—pressure reducing valve;8—pressure gage;9—commingler;10—temperature display;11—temperature control instrument;12—reactor;13—condensator;14—gas-liquid separator;15—cut-off valve;16—GC.

The outlet conditions for the reactor conform to Eq.(13)at the first half of the cycle.At the second half of the cycle,Eq.(14)is followed.
2.4.Kinetic expressions
In the development of the model,pseudo-1.5th order kinetics for the catalytic combustion of methane was assumed[18].This assumption had been experimentally checked on the sphere-shaped Pd/Al2O3catalyst which was a sample of catalyst for organic waste gas purification [HPA(KMK)]bought from Zhejiang University.[HPA(KMK)]catalyst is prepared by using palladium and platinum supported onγ-Al2O3. The related properties of the catalysts were shown in Table 2.The equipment used for kinetic experiments was shown as Fig.3.
Before the experiments,the catalyst was ground to 100-250μm in order to neglect internal diffusion resistance.The influence of external diffusion was investigated by means of changing the loading amount of the catalyst particles and gaseous flow while the ratio of gaseous flow to catalyst loading being maintained constant.The constancy of estimated rate constant k versus change of GHSV indicated that the external diffusion influence could be neglected under the condition of GHSV(gas hourly space velocity)≥4600 ml·(g cat)-1·h-1.
The required methane concentration was 1.0%(by volume),and temperature remained below 600°C.Forty-five experimental data for methane conversion were obtained under different space velocities and temperatures as listed in Table 3.
The experimental data of k were correlated with a simple 1.5 order model.In this case the intrinsic model of lean methane catalytic combustion on the Pd/Al2O3catalyst was given as rA=kcA1.5.The rate parameter was expressed as k=k0exp(-E/RT),where k0was prexponential factor,and E is activation energy.
The partialleast-square(PLS)and the Nelder-Mead simplex search methods were employed to estimate the parameters of kinetic model. The Arrhenius plot for experimental data of this model was shown in Fig.4,from which the estimated values of k0and E were obtained.
The resulting apparent activation energy for this 1.5-order model was 82.64 kJ·mol-1and pre-exponential factor was 4.17×10⁶L0.5· mol-0.5·s-1.The reaction heat for methane combustion(ΔHR)was -802.5 kJ·mol-1.Deactivation of the Pd/Al2O3catalyst was observed when the temperature was higher than 600°C.Therefore,the behavior of the catalyst cannot be adequately described by these parameters over 600°C.
2.5.Transport properties
The transport coefficients used to simulate the particle bed reactor were experimentally validated and reported in a previous work[19]. The effective dispersion coefficient(Deff),effective thermal conductivity (kGeff),gas-solid mass transfer coefficient(KG),gas-solid heat transfer coefficients(h),and Ergun equation to calculate the pressure drop (Δp),were listed in Table 4.
It was assumed that the reaction heat was transported from the particle to the insulation layer through the reactor wall with the thickness of1.5 mm and thermal conductivity of19.51 W·m-1·K-1.The thermal conductivity 0.042 W·m-1·K-1of the insulation layer was much lower than the wall of reactor,which could prevent heat diffusion from the reactor wall to the ambient environment.
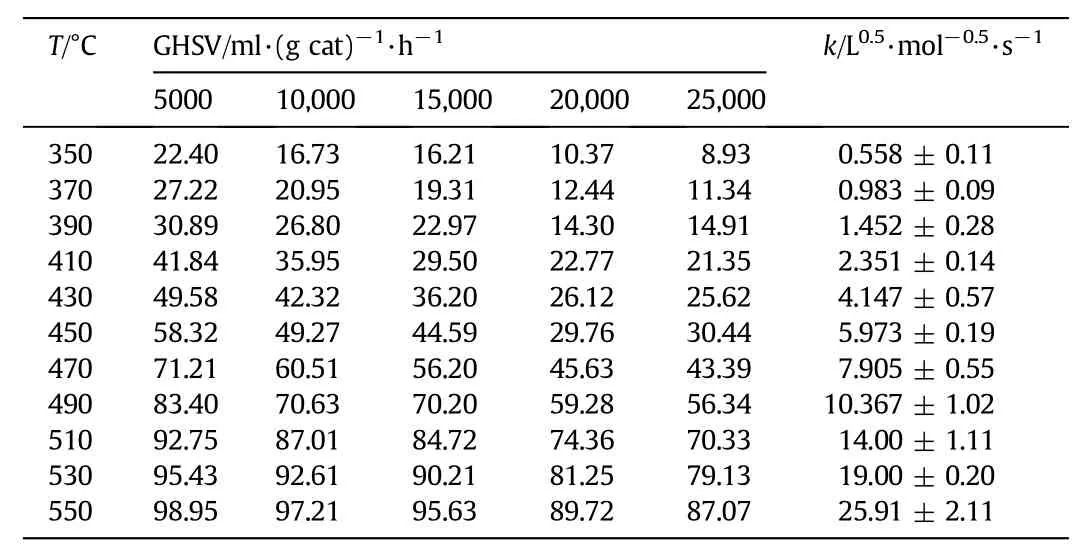
Table 3 Conversion of methane at different temperatures and space velocities

Fig.4.Arrhenius plots of the estimated values of kinetic parameters k for the power law model.
2.6.Solution of mathematical model
The present mathematical model consisted of5 partial differential equations and additional algebraic equations,in which physical,chemical and transport properties were calculated as mentioned above.The discretization of the mathematical model was performed by using the‘upwind scheme’.We modify the criterion of the second derivative control with a criterion based on a combination of the magnitude of second-order derivatives and that of first-order derivatives.With this criterion,the spacing distribution of grid can be well controlled.It may be better to put a little more points in the region of high first-order derivatives besides in the region of high second-order derivatives.The criterion can be described as[19]

whereδ=0.02 and k1=1 and k2=0.5 were two selected nonnegative constant for catalysts and inert bed.The previous studies[20]proved that the simulation grid was independent with the parameterδ≤0.5. In this paper,to insure the simulation accuracy,δwas setas 0.02.

Table 4 Correlations used for estimating internal transfer parameters in the simulation

Table 5 Five primary variables D,F,E,and R used in Eq.(19)
Fully implicit schemes were generally stable since a large time step can be chosen to save computational time.But completely implicit schemes usually required a series of iteration to ensure convergence. The weakly implicit algorithm described in[21]could avoid some unnecessary iteration,and could choose a large time step(0.1 s)if necessary.
In a fully implicit scheme,all spatial derivatives are expressed using discrete variables at the n+1 time step,and only the temporal derivatives are involved variables at step n.The first-order derivatives were discretized by‘upwind scheme’[Eq.(16)]and the second-order derivatives were discretized by central difference method[Eq.(17)]:


Fig.5.Schematic diagram of reverse flow reactor for methane catalytic combustion in experimental scale.1—methane;2—commingler;3—gas-liquid separator;4—mass flow meter; 5—pressure maintaining valve;6—electromagnetic valve;7—reactor;8-heat exchanger.A inert,B catalyst.

Fig.6.Comparison of experimental and simulation results.

Table 6 Operating parameters used in the simulation of base case
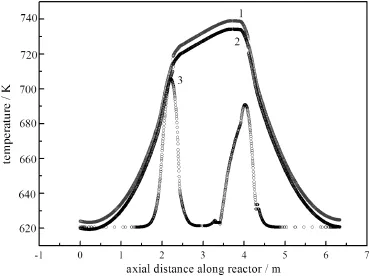
Fig.7.Development of the center line axial temperature profile without heat extraction. 1—after the 25th cycle;2—after the 15th cycle;3—after the 1st cycle.
Generally,a partial differential equation for RFR can be described as [20]

After substitution,it becomes a series of algebraic equations of uin+1for the time instant tn+1,i.e.,

For our 5 primary variables,functions D,F,E,and R are listed in the following Table 5.
Also,the Crank-Nicolson technique and the corresponding predictor corrector method can be used to get higher order accuracy.In this work, MATLAB had been used to solve the ordinary differential equations for a particle bed reactor with feed flow periodically reversed by changing the spatial coordinates.The convergence residual of the simulation results was less than 10-5.
2.7.Model validation
The bench scale experiment was took place in the reactor shown in Fig.5.The internal diameter of the reactor was0.05 m,the total length of each reactor was 2.0 m,with the catalysts filling of 1 l to make a 0.5 m packed section(and the rest3.5 m packed with inert).The solid physical properties for particle beds were shown in Table 2.The operational condition was controlled at 1.0%(by volume)of CH4,20 m3·h-1handling capacity and a switch time of400 s.
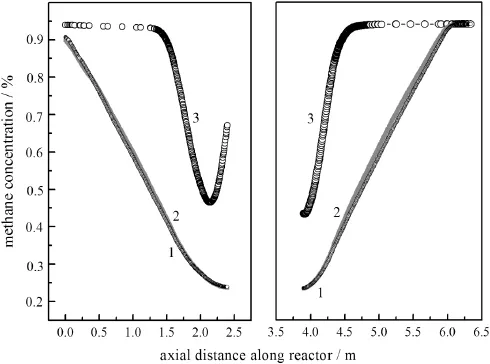
Fig.8.Methane concentration pro files in the reactor without heat extraction.1—after the 25th cycle;2—after the 15th cycle;3—after the 1st cycle.
Fig.6(a)showed the experimental axial temperature pro file after operation of25 cycles with switch time of400 s when the reactor operated at a pseudo-steady state.Fig.6(b)showed the axial temperatureprofile by simulation at the same moment of operation.The comparison of them showed that the trend of temperature profile from the simulator fairly well matched the experimental results over a long period of time.Overall,the comparison results indicated that the model is able to predict the thermal energy trends in the RFR.

Fig.9.Variation of the center line axial temperature profile after 13 cycles with heat extraction.1—before heat extraction;2—after heat extraction.
3.Results and Discussion
Numerical simulation was used to investigate the influence of operating parameters,as a prior step in the development of optimization and control strategies.From our previous experimental and limited modeling work reported in the literature[15-17],a number of variables were found to be important to the operation,such as thermal properties of the system,insulation layer temperature,fluid velocity,switch time,and feed concentrations,which were addressed in this work.By regulating these parameters,the reactor could reach the best performance,such as no catalyst bed‘run-away’,reactor extinction being avoided,high conversion rate of CH4,and more heat extraction.
3.1.The base case
Firstly,a base case without heat extraction was given,with the specific parameters shown in Table 6.
The operation starts from an initial temperature profile without heat extraction from the heat exchanger at the bottom.The progression of the axial temperature profile was shown in Fig.7.The maximum temperature continued to increase every cycle before the 15th cycle. While the periodic flow reversal continues,the maximum temperature slightly decreases,and a stabilized state was obtained at the end of the 25th cycle.During the reaction,the reaction heat was accumulated in the reactor,the maximum temperature of reactor was high to 740 K (after 25th cycle)compared to 705 K(after 1st cycle).Fig.8 presented corresponding methane concentration profiles.It is visible from the concentration profiles that the combustion of methane was nearly completed at the position of reactor bottom while much more cycles were taken.As a result,more reaction heat was released to the system,producing a sharper gas temperature profile and higher maximum temperature at the end of the pseudo-steady state.
With the operating parameters showed in Table 6,when the pseudo-steady state without heat extraction reached,the cooling system situated at the middle of the reactor started to operate.The cooling system that consumes heat requires that the water temperature at the outlet should be above 90°C and at the inlet below 25°C at the flow rate of30 kg·h-1.Figs.9,10 and 11 showed the axial gas temperature profile,methane concentration profile and the solid temperature profile,respectively,after 13 cycles with heat extraction.It appeared that the maximum temperature decreased from 750 K to 690 K,while the maximum solid temperature decreased from 720 K to 690 K after heat extraction,and a comparatively symmetrical“saddle”distribution was found in the axial gas temperature profile.Moreover,in Fig.9,because some released heat was extracted in the heat exchange range(2.4 m-3.9 m),the temperature of reactor was reduced to 610 K;the cooled gas recommenced reaction in the second stage reactor(3.9 m-4.3 m). Due to the lower gas temperature,the reaction rate was decreased, and only a small portion of reactant was combusted.In Fig.10,it can be observed that the outlet concentration of methane was increased slightly with heat extraction.This is explained considering the lower reaction rate by the heat removal.However,the concentration of methane was less than 0.3%(by volume)with some of heat extraction.Therefore, a favorable running status was achieved.In Fig.11,the solidtemperature profile over catalyst and inert sections was shown.At the entrance,because the heat transferred from gas to solid,the solid temperature showed a trend of decreasing firstly,and then increasing.All the simulated results indicate that it is possible to extract some of heat produced from the combustion in the reactor through the middle heat exchanger,with the reactor running properly at the same time.

Fig.10.Variation of methane concentration profiles after 13 cycles with heat extraction.1—before heat extraction;2—after heat extraction.
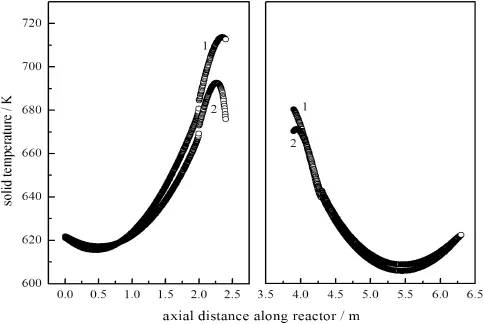
Fig.11.Variation of the solid temperature profile after 13 cycles with heat extraction.1—before heat extraction;2—after heat extraction.
3.2.Effects of switch time
Switch time was an important operating parameter,namely the time for finishing a forward flow and a reverse fl ow.The temperature profiles at a pseudo-steady state with different switch times without heat extraction were shown in Fig.12(a).In the simulation,it was observed that with longer switch time,it would take much more cycles to achieve the pseudo-steady state.For example,for the shortests witch time of200 s,the reactor reached a pseudo-steady state over 5 cycles. While the switch time was as long as 1000 s,a pseudo-steady state was achieved over 47 cycles.
It can be seen from Fig.12(a)that the maximum temperature at the stabilized operation increased as the switch time increased without heat extraction.However,this trend was reversed when the heat was extracted away from the reactor,as shown in Fig.12(b).This effect can be explained by the increased reaction heat loss from the bed carried away by exhaust gas if the switch time is too long.But when the switch time was only 200 s,there was almost no heat to be extracted. Because the residence time of gas was less than the switch time,a larger fraction of the reaction energy was carried away by the effluent gas at the outlet,leading to a lower average gas temperature over the total reactor at the end of pseudo-steady state,as shown in Fig.13.
Therefore,there should exist a critical switch time.In our case,the approximate switch time was within the range of 400 s to 800 s.In this range of switch time,the reactor could run properly without catalysts‘run-away’and‘reactor extinction’,while more combustion heat was able to transfer.
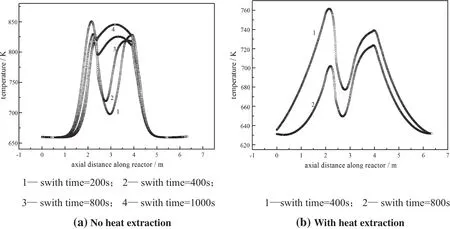
Fig.12.Axial temperature profile at pseudo-steady state with different switch time(at the end of a cycle with flow along the z direction).
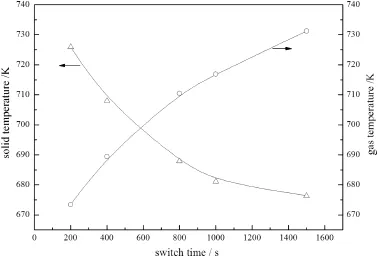
Fig.13.Average temperature of the reactor with different switch time.

Fig.14.Center line axial temperature profiles at different feed concentrations after heat extraction.1—feed concentration is 1%;2—feed concentration is 0.5%.
3.3.Effectoffeed concentration
The effect of feed concentration was illustrated in Fig.14,after25 full cycles when the inlet concentration of methane reduces from 1%to 0.5% by volume.It can be seen that when the feed concentration reduced to 0.5%while other operating condition including heat removal was maintained,the reaction energy was almostre moved,and thus temperature is not high enough to maintain the reaction.It was expected that the combustion would stop finally,if no other measure was taken to maintain the energy balance.
Reducing the heat removal is an effective way to make the reaction proceeding with lower methane concentration.As shown in Fig.15, when the cooling system that the water temperature at the outlet should be below 70°C and at the inlet above 40°C at the flow rate of 25 kg·h-1;the methane concentration at outlet can decrease to 0.35%,closed to the status of inlet concentration of methane 1%.
Above all,when the feed concentration was lower,the most effective way is to minimize the heat extraction as much as possible,in order to prevent the reactor extinction.
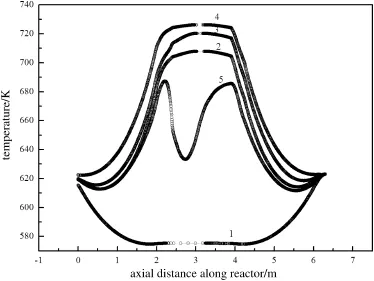
Fig.16.Axial temperature profiles at different insulation layer temperatures.1—before heat extraction,Ta=323 K;2—before heat extraction,Ta=343 K;3—before heat extraction,Ta=373 K;4—before heat extraction,Ta=500;5—after heat extraction, Ta=343 K.
3.4.Effect of insulation layer temperature(Ta)
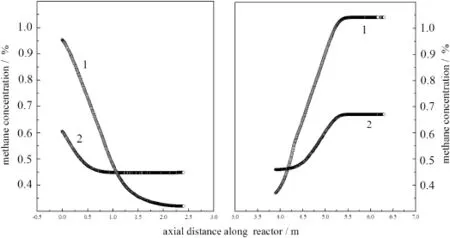
Fig.15.Concentration of methane profiles at different feed concentrations with cooling system changed.1—feed concentration is 1%;2—feed concentration is 0.5%.
It had been reported[15,21-23]that the insulation layer played a significant role in the reactor operation from a scale-up standpoint. The insulation layer supplied energy for the system.As another point of view,Tacan be interpreted as insulation layer temperature.The effectof the insulation layer temperature can be shown independently by adjusting the temperature in the base case.For operation convenience, the insulation layer temperature was adjusted to an appointed value. Fig.16 illustrated the result of man-made increasing the insulation layer temperature(Ta)from 323 K to 500 K with switch time of 600 s, and feed concentration of1.0%.Simultaneously,the temperatures of reactor wall with different insulation layer temperatures were shown in Fig.17.From the graphs,it was found that at a temperature larger than 373 K,there was no significant difference in the gas temperature profile,while the reactor wall temperature increased obviously under the base case operating conditions.This condition leads to high energy loss in the reactor wall.

Fig.17.Reactor wall temperature profiles at different insulation layer temperatures.1—before heat extraction,Ta=323 K;2—before heat extraction,Ta=343 K;3—before heat extraction,Ta=373 K;4—before heat extraction,Ta=500 K.5—after heat extraction,Ta=343 K.
Besides,when the insulation layer temperature was lower than 323 K,the reaction will be extinguished if the insulation layer cannot supply enough energy for the system,as shown in Fig.18.During the operation,much of the reaction energy was transferred to the reactor wall,with the result that the self-heating of the reaction cannot be preserved.
4.Conclusions
In this work,the effect of operating parameters on the performance of a reverse-fl ow reactor had been investigated for the catalytic combustion of lean methane/air mixtures.The simulated calculation results demonstrate that under the suitable operating conditions,the system can achieve a favorable running status,without catalyst bed‘runaway’,reactor extinction,and more heat energy extraction.On the other hand,it was found that the extraction of thermal energy from the mid-section of the reactor was feasible.The temperature profile remained smooth and continuous in the case of desired energy extracting from heat exchanger.
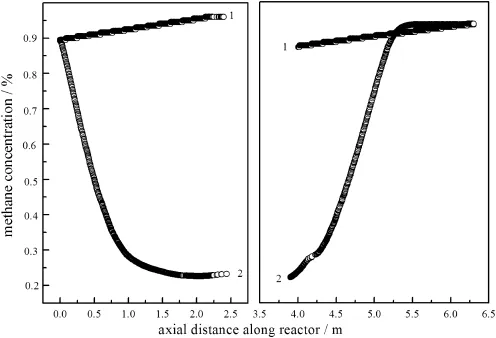
Fig.18.Methane concentrations at different insulation layer temperatures.1—Ta=323 K;2—Ta=343 K.
The proposed simulation was appropriate for the optimization of RFR at a pilot scale,especially for the system with heat extraction. Actually,RFRwas a very intricately complex system.To fully understand allof the processes in the system,more experimental research must be done in the future work.
Nomenclature
Cpheat capacity,J·kg-1K-1
c molar concentration,mol·m-3
Deffaxial dispersion coefficient,m2·s-1
DRinternal diameter of the reactor,m
DR′internal diameter of the heat exchanger
dpparticle bed particle diameter,mm
dWreactor wall thickness,m
E activation energy for heterogeneous reaction,J·mol-1
ΔHRcombustion enthalpy,J·mol-1
h gas-solid heat transfer coefficient,W·m-2.K-1
KGgas-solid mass transfer coefficient,W·m-2.K-1
k thermal conductivity,W·m-1K-1
kShepre-exponential factor of heterogeneous reaction
kGeffaxial effective thermal dispersion coefficient,W·m-1K-1
R ideal gas constant,J·mol-1K-1
LRreactor length,m
rAheterogeneous reaction rate per catalyst surface
Δp pressure drop,Pa
T temperature,K
u superficial velocity,m·s-1
z axial length along the reactor,m
αvsurface-volume ratio,m2·m-3
δpositive number was given to judge the step size
εbbed porosity
ρdensity,kg·m-3
Superscripts
dinertpacking
he heterogeneous reaction
′heat exchanger
Subscripts
A reaction compound(methane)
a insulation layer
d inert stuffing
G gas phase
S solid phase
W reactor wall
0 reactor inlet conditions
[1]J.P.Guo,C.D.Zhou,Greenhouse gas emissions and mitigation measures in Chinese agroecosystems,Agric.For.Meteorol.142(2-4)(2007)270-277.
[2]K.Ito,Y.Uchiyama,T.Takeshita,H.Hayashibe,Study on GHG control scenarios by life cycle analysis—world energy outlook until 2100,Energy Convers.Manag.38 (7)(1997)607-614.
[3]C.Ö.Karacan,F.A.Ruiz,M.Cote,S.Phipps,Coalmine methane:a review of capture and utilization practices with benefits to mining safety and to greenhouse gas reduction,Int.J.CoalGeol.86(2-3)(2011)121-156.
[4]Y.P.Cheng,L.Wang,X.L.Zhang,Environmental impact of coal mine methane emissions and responding strategies in China,Int.J.Greenhouse Gas Control5(1) (2011)157-166.
[5]R.E.Hayes,Catalytic solutions for fugitive methane emissions in the oil and gas sector,Chem.Eng.Sci.59(2)(2004)4073-4080.
[6]S.Andrea,S.B.Paola,L.Gianluca,P.Raffaele,R.Gennaro,Combustion of methane hydrogen mixtures on catalytic tablets,Chem.Eng.J.154(1-3)(2009)315-324.
[7]R.E.Hayes,S.T.Kolaczkowski,Introduction to Catalytic Combustion,Gordon and Breach,UK,1997.323-325.
[8]N.Russo,P.Palmisano,D.Fino,Pd substitution effects on perovskite catalyst activity for methane emission control,Chem.Eng.J.154(1-3)(2009)137-141.
[9]K.Xu,Z.L.Liu,H.He,S.Y.Cheng,C.F.Ma,Experimental study on emission control of premixed catalytic combustion of natural gas using preheated air,Chin.J.Chem.Eng. 15(1)(2007)68-74.
[10]Y.S.Matros,G.A.Bunimovich,Reverse-fl ow operation in fixed bed catalytic reactors, Catal.Rev.38(1)(1996)1-67.
[11]P.Marin,S.Ordonez,F.V.Diez,Procedures for heatrecovery in the catalytic combustion oflean methane-air mixtures in a reverse flow reactor,Chem.Eng.J.147(2-3) (2009)356-365.
[12]K.Gosiewskia,K.Warmuzinski,Effect of the mode of heat withdrawal on the asymmetry of temperature profiles in reverse-fl ow reactors.Catalytic combustion of methane as a test case,Chem.Eng.Sci.62(2)(2007)2679-2689.
[13]B.Liu,R.E.Hayes,M.D.Checkel,M.Zheng,E.Mirosh,Reversing flow catalytic converter for a natural gas/diesel dual fuel engine,Chem.Eng.Sci.56(2)(2001) 2641-2685.
[14]A.G.Miguel,O.Hevia Salvador,V.D.Fernando,Effect of the catalyst properties on the performance of a reverse flow reactor for methane combustion in lean mixtures, Chem.Eng.J.129(1)(2009)1-10.
[15]S.Salomons,R.E.Hayes,M.Poirier,H.Sapoundjiev,Modelling a reverse flow reactor for the catalytic combustion of fugitive methane emissions,Comput.Chem.Eng.28 (1)(2004)1599-1610.
[16]R.Litto,R.E.Hayes,H.Sapoundjiev,A.Fuxman,F.Forbes,B.Liu,F.Bertrand, Optimization of a flow reversal reactor for the catalytic combustion of lean methane mixtures,Catal.Today 117(1)(2006)536-542.
[17]P.Marin,M.A.G.Hevia,S.Ordonez,F.V.Drez,Combustion ofmethane lean mixtures in reverse flow reactors:comparison between packed and structured catalyst beds, Catal.Today 105(3-4)(2005)701-708.
[18]Y.H.Chin,D.E.Resasco,Catalytic oxidation of methane on supported palladium under lean conditions:kinetics,structures and properties,Catalysis 14(1)(1999) 1-39.
[19]X.K.Niu,Modeling of Reverse Flow Catalytic Combustion Process for Air Purification, Ph.D.Thesis Beijing University of Chemical Technology,China,2003.(in Chinese).
[20]J.Y.Huang,C.Y.Li,A robust adaptive algorithm for flow reversal fi xed-bed flow reversal fixed-bed reactor models,Process 2nd Joint China/USA chemical engineering Conference,Chem.Ind.Press,Beijing,1997,pp.266-270.
[21]S.Salomons,R.E.Hayes,M.Poirier,H.Sapoundjiev,Flow reversal reactor for the catalytic combustion of lean methane mixtures,Catal.Today 83(1)(2003)59-69.
[22]A.Kushwaha,R.E.Hayes,M.Poirier,H.Sapoundjiev,Effect of reactor internal properties on the performance of a flow reversal catalytic reactor for methane combustion,Chem.Eng.Sci.59(1)(2004)4081-4093.
[23]A.Kushwaha,M.Poirier,R.E.Hayes,H.Sapoundjiev,Heat extraction from a flow reversal reactor in lean methane combustion,Chem.Eng.Res.Des.83(1)(2005) 205-213.
☆Supported by the National High Technology Research and Development Program of China(2006AA030201).
*Corresponding author.
E-mailaddress:lijw@mail.buct.edu.cn(J.Li).
杂志排行
Chinese Journal of Chemical Engineering的其它文章
- Separation Science and Engineering Performance Prediction of Structured Packing Column for Cryogenic Air Separation with Hybrid Model☆
- Enhanced Photocatalytic Properties of Silver Oxide Loaded Bismuth Vanadate☆
- Recovery and Recycling of Ti Supported Bimodal Mesoporous Catalysts Prepared via Ship-in-a-bottle Method in the Epoxidation of Cyclohexene☆
- Promoting Xylene Production in Benzene Methylation using Hierarchically Porous ZSM-5 Derived from a Modified Dry-gel Route☆
- Energy,Resources and Environmental Technology Experimental and Modeling Study on de-NOxCharacteristics of Selective Non-catalytic Reduction in O2/CO2Atmosphere☆
- Energy,Resources and Environmental Technology CO2Removal from Biogas by Water Washing System☆
