Rapid Non-destructive Detection for Molds Colony of Paddy Rice Based on Near Infrared Spectroscopy
2014-07-02ZhangQiangLiuChenghaiSunJingkunCuiYijuanLiQunJiaFuguoandZhengXianzhe
Zhang Qiang, Liu Cheng-hai, Sun Jing-kun, Cui Yi-juan, Li Qun, Jia Fu-guo, and Zheng Xian-zhe*
1 College of Engineering, Northeast Agricultural University, Harbin 150030, China
2 Food Processing Research Institute, Heilongjiang Academy of Agricultural Sciences, Harbin 150086, China
Introduction
Paddy rice is susceptible to contamination by moulds during storage due to factors affecting storage temperature and moisture. Certain moulds can produce mycotoxins, including the very harmful Aflatoxin B1, which is common in paddy rice (Binder, 2007;Shephard, 2008; Ni et al., 2011). Therefore, it is necessary to establish a rapid, simple and effective method for detection of total number colony of moulds in paddy rice.
A variety of well-established methodologies for analyzing moulds in cereal grains have been tested by American Association of Cereal Chemists (AACC)and the United States Department of Agriculture(USDA)(AACC International, 2000; USDA, 2004).These existing methods include plate culture method.These chemical-based laboratory methods have the advantage of being precise and accurate. However,they are time-consuming, laborious, expensive,and require a well-equipped laboratory and skilled laboratory personnel to perform and interpret these tests. The lengthy process precludes rapid and real-time detection of moulds in grains.
Near infrared spectroscopy (NIRS)is an excellent candidate for measurements of the chemical components in complex materials including cereals, fruits and vegetables (Millar et al., 1996). It has been used to measure the content of water, oil, fi ber, starch, and protein in cereals and grains (McClure, 2003). More recently, NIRS has also been successfully applied to predict fumonisin B1in maize, deoxynivalenol in wheat and Aflatoxin B1in paddy rice (Beardo et al.,2005; Abramovic et al., 2007; Zhang et al., 2014).Tripathi and Mishra (2009)observed that Fourier transform near infrared spectroscopy could be used for rapid, non-destructive quantification of AFB1in red chili powder. Sirisomboon et al. (2013)found that NIRS could accurately detect the incidence of rice infected by aflatoxigenic fungi. Hu et al. (2014)observed that near infrared spectroscopy could be used for rapid and non-destructive quantif i cation of yeast in fresh jujube.
However, very few studies have applied NIRS technology to detect and quantify total number colony of mould contamination in paddy rice. Therefore, the objectives of the present research were to assess the feasibility of using NIRS to detect total number colony of mould concentration in artificially contaminated paddy rice samples and to explore the potential of the method for the prediction of contamination in unknown paddy rice.
Materials and Methods
Paddy rice samples
In this study, paddy rice samples were collected at the experiment station of the Northeast Agricultural University, Harbin, China. The paddy rice samples were harvested in October in 2013. The collected paddy rice was stored for 3 months at temperature of(20±3)℃ and in relative humidity of 55%-65%. The initial moisture content was 10.0% (w.b.). Moisture content of paddy rice samples was measured based on AOAC (1995b)off i cial method (oven dry method,135℃, 3 h).
Equipments
Humidity chamber (CTHI-150(A)B type, temperature fluctuation ±0.2℃, Shi Dukai Equipment Co., Ltd.,Shanghai, China); super clean bench (SE-CJ-10 type,Suzhou Jinghua Equipment Co., Ltd., Suzhou, China);Near infrared spectrometer (ZX-888 type, Osbert International Co., Ltd., San Francisco, USA).
Artificially induced infection in paddy rice samples
Storage experimentations were carried out to obtain moulds contaminated samples. Artificially contaminated paddy rice samples containing different moisture levels (10%-22%)(w.b.)were obtained by adding water to induce the growth of moulds for 3 months in a room at a controlled temperature of 5℃, 15℃, and 25℃. All the tests were performed in triplicate. Data were expressed as mean of triplicate determinations.
Near infrared scanning
A total of 121 samples were selected. The set of samples was divided into two subsets. The larger set(90 samples)was used to calibrate NIRS analysis and to cross-validate the derived equation. The smaller set (31 samples)was used to test the goodness of fit of the calibration model. All paddy rice samples were measured in duplicate. The paddy rice samples were fi rst used for NIR analysis. Then these samples were used in the reference method. Each scan consisted of a sample of 45 g being placed in a quartz cup and the samples were then scanned using a near infrared spectrometer (ZX-888 type, Osbert International Co.,Ltd., San Francisco, USA)in diffuse ref l ection mode.NIR was in a range of wavelengths of 918-1 045 nm.Spectra of each sample were automatically recorded as Absorbance (A)corresponding to log (1/R). The scanning time of each sample was approximately 30 s. Each sample was scanned three times and the average spectrum of the sample was employed for data analysis.
Reference method
The detection of total number colony of moulds was based on the national standard method. 25 g of paddy rice samples were weighed and put into the conical fl ask with 225 mL of sterilized distilled water. It was fully shaken up to dilution of 1 : 10; then 1 mL dilution of 1/10 was poured into the test tube with 9 mL of sterilized distilled water. Another sterilized distilled pipette of 1 mL was taken for suction and blowing for 3-5 times. It was dilution of 1 : 100; fi ve gradient levels were made, including 1 : 10, 1 : 100, 1 : 1 000,1 : 10 000 and 1 : 100 000; with 10 times of increasing dilution, every gradient drew 1 mL of samples antigrading liquid and was put in two sterilized distilled plate; 15-20 mL of the potato dextrose agar was cooled to 46℃ and poured into the plate. The petri dish was turned for even mixing, after the agar solidified, the petri dish was inverted. It was incubated for 5 days at(28±1)℃, observed and recorded.
NIRS data analysis
All spectral analyses were conducted using the Unscrambler 10.3 (Camo Technologies, Woodbridge,NJ, USA)and SPSS software (Ver. 8.2, SPSS Institute,INC., Cary, NC). The spectral data were analyzed using Unscrambler 10.3 software and principal component regression (PCR)method to remove spectral outliers. Then, the reference data were combined with NIR reflection spectra. The total spectra data were divided into calibration and prediction sets in a 3 : 1 ratio. The calibration sets were used to develop PCR and multiple linear regression (MLR)models. In this study, a chemometric model for the total number colony of the moulds in paddy rice was constructed.
The optimal discriminant model for paddy rice was selected by using the highest coeff i cient of determination (R2), the lowest standard error of calibration (SEC),and the lowest standard error of prediction (SEP).
Results and Discussion
Characteristics of reference data sets
The reference data obtained from natural infection and artificial infection are presented in Table 1. The paddy rice samples (n=121)were distributed in the total number colony of moulds range of 450-690 000 cfu · g-1with a mean value of 37 410 cfu · g-1and a standard deviation of 99 331 cfu · g-1. Table 1 showed the statistical values of total number colony of moulds(cfu · g-1)within the calibration and prediction sets. The distribution of the total number colony of moulds in samples had a mean of 38 568 cfu · g-1for the calibration set and 34 051 cfu · g-1for the prediction set.

Table 1 Total number colony of moulds in samples of paddy rice
Furthermore, few samples with extremely high total number colony of mould were observed, due to the low moisture content of paddy rice sampled during artificial infection with moisture level below 16%.The uneven distribution of the data was helpful in improving the prediction performance of the model.The moisture content of paddy rice is one of the most important factors governing the fungal growth and their mycotoxin production (AL-warshan and ALHadethy). Abdullah et al. (2000)also noted that the critical moisture content for rice grains maintained at 25℃ without fungal growth was 13%. Therefore, the low-moisture-content storage can be recognized as a safe storage system (Genkawa et al., 2008).
Spectral characteristics
Fig. 1 showed the average NIRS (raw absorption spectra)of the paddy rice samples obtained over a wavelength between 918-1 045 nm. From Fig. 1,it could be observed that the overlapping peaks of the spectra were distinctly shown and showed more detail in the spectral characteristics of the paddy rice samples.
The spectra of mould infection were measured and analyzed to demonstrate correlation to some of the bands observed in the infected samples (Fig. 1).This experiment collected the absorbance value at 12 wavelengths. The wavelengths were 918, 928, 940,950, 968, 975, 985, 998, 1 010, 1 023, 1 037 and 1 045 nm. The wavelength interval was 10 nm. From Fig. 1, it could be seen that most maps of the 121 samples were similar. That's because the chemical constituent species of each sample were basically the same. In the spectroscopy map of the fi gure, the absorbance of the samples at 12 wavelengths was different.It showed that near infrared spectroscopy could ref l ect the differences of the chemical constituents between the samples. The spectral information that modeling needed was easily identif i ed. The absorbance value of every wavelength could be the interaction results of the absorption of multi-class moulds. Several bands in Fig. 1 were suitable for the determination of colony of mould in the paddy rice samples distinguished from the uninfected one. Based on Fig. 1, the peak at 740-1 080 nm could be assigned to the 2nd overtone, the 3rd overtone, and the 4th overtone from C-H groups and O-H groups. The peak at 960 and 967 nm could be assigned to the 2nd overtone from O-H stretching mode groups. The peak at wavelength of 972, 996 and 1 009 nm corresponded to a 2nd overtone of 3vO-H stretching modes of carbohydrate. The peak at 1 040 nm can be attributed to the 2nd overtone from N-H stretching mode groups of protein. From Fig. 1,this particular absorbance region correlated most strongly with the colony of mould infection. This appeared to confirm that the moisture, carbohydrate,starch content and protein in paddy rice affected the overall extent of mould infection.

Fig. 1 NIR raw spectra of samples of paddy rice based on colony of mould infection in samples
Spectral preprocessing and model development
Table 2 expressed absorbance of near infrared diffuse transmission spectrometer and total number colony of moulds in calibration set. The absorbance of near infrared diffuse transmission spectrometer and the total number colony of moulds in prediction set are shown in Table 3. x1, x2, x3, x4, x5, x6, x7, x8, x9,x10, x11and x12were the spectrometer absorbance of the samples at 918, 928, 940, 950, 968, 975, 985, 998,1 010, 1 023, 1 037 and 1 045 nm. y1represented the total number colony of moulds. MLR and PCR for mould infection are presented in Table 4. The best preprocessing method and calibration model were selected on the basis of the highest value of correlation coefficient of determination (R2)and the lowest SEC and SEP values. Table 4 showed that prepro-cessing greatly improved the quality of a model. The best model obtained used MLR method processing.The values obtained for R2and SEC were 0.943 and 26 327, respectively. R2and SEP found on the independent prediction set were 0.897 and 33 393,respectively.

Table 2 Spectrometer data in calibration set for contaminated with colony of moulds

Table 3 Spectrometer data in prediction set for contaminated with colony of moulds

Table 4 Regression results using MLR and PCR discriminant models for paddy rice contaminated with colony of moulds
Results of multiple linear regressions
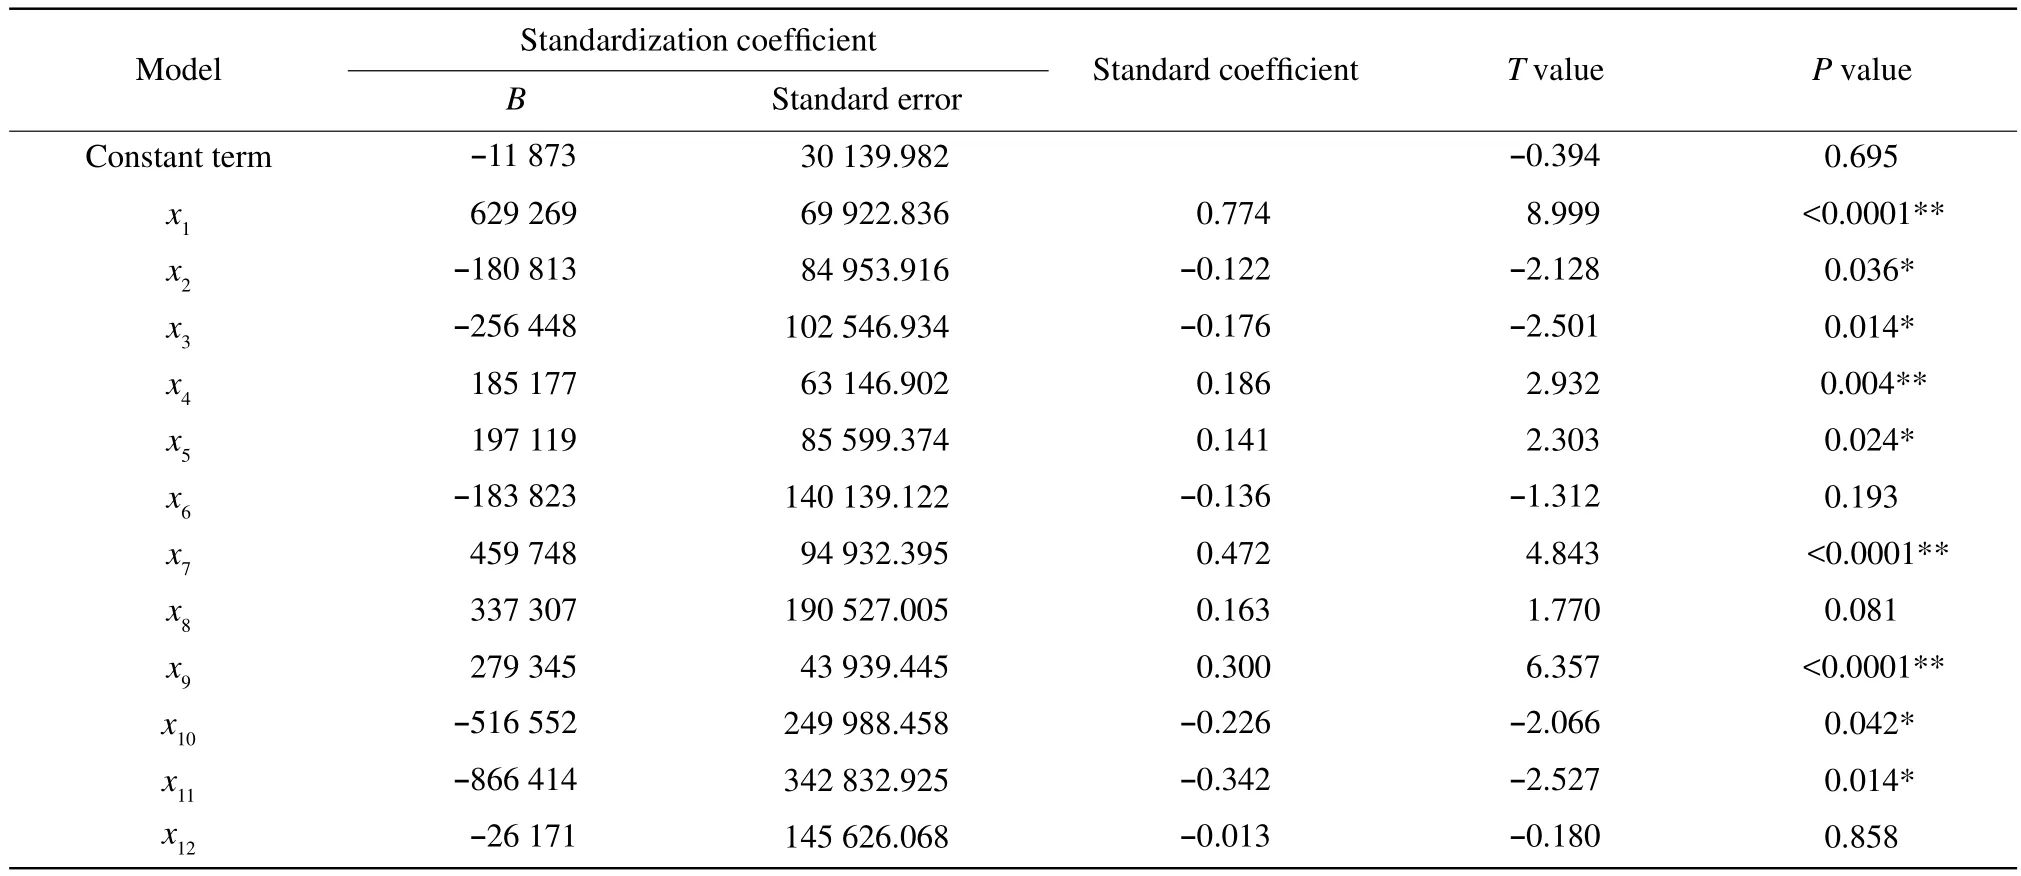
After the treatment of the spectral data, the analysis data results of the total number colony of moulds and the absorbance of the 12 wavelengths are shown in Table 5. Variance analysis of multiple element linear regression is shown in Tables 6 and 7.
Therefore, the behaviors of the input variables on the total number colony of moulds were reasonably described by equation (1).

The signif i cance test of each parameter item in the equation is shown in Table 5. Except the constant term, term x6, term x8, and term x12, the regression coefficient test of each term was significant in different degrees. The regression equation (2)was obtained by rejecting the non-signif i cant term.

Table 6 showed that the freedom degree of the re
gression equation was 12. F value was 108.063,which was greater than its critical value at P<0.0001.Therefore, this model was signif i cant. Table 7 showed that R2value of the regression equation was 0.943 according to the multiple element linear regression.This indicated that the value of absorbance of the 12 wavelengths determined the total number of the colony of the moulds.
Therefore, the calibration model built by using the multiple element linear regression had a good effect,which could be used for rapid detection of the total number of the moulds colony on the grain surface.

Table 5 Results of multiple element linear regression analysis

Table 6 Variance analysis of effects of process variables on total number colony of moulds

Table 7 Variance analysis of effects of process variables on total number colony of moulds
Verif i cation of accuracy of prediction model
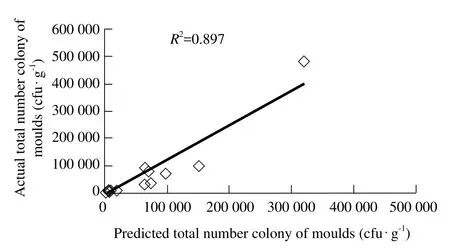
The calibration model was established by using the multiple element linear regression for optimization.The total number of the moulds colony of the 31 paddy rice samples in the prediction set was predicted. The prediction accuracy and robustness of the calibration model were investigated. The relevance of the actual data and the prediction data is shown in Fig. 2.

Fig. 2 Measured versus predicted total number colony of moulds at prediction
The equation of the straight line for the correlation plots of the prediction data sets was as equation (3).
Y=1.2717X-9030.2 (3)
Where, the coeff i cient of the determination (R2)was 0.897. The residual average was 173. The prediction accuracy could meet the demands of the detection precision of the agricultural products. The established near infrared prediction model was robust.
Conclusions
A feasible method applied for the detection of total number colony of mould in paddy rice by NIRS was studied in this research. Compared with traditional techniques, NIRS method might predicate the quantifi cation of total number colony of mould in paddy rice with rapid, simple and non-destructive advantages.NIRS technique might have practical applications for monitoring fungal contamination in postharvest paddy rice during storage.
AACC International. 2000. Approved methods of the American Association of Cereal Chemists (10th ed.). Methods 39-70 A, 44-15 A,and 46-10. The Association, St. Paul, MN.
Abramovic B, Jajic I, Abramovic B, et al. 2007. Detection of deoxynivalenol in wheat by fourier transform infrared spectroscopy. Acta Chim Slov, 54: 859-867.
AL-warshan S H S, AL-Hadethy O N. 2012. Effect of container,medium weight, and moisture content on af l atoxin B1production on rice. Al-Anbar J Agr Sci, 10(1): 11-17.
Abdullah N, Nawawi A, Othman I. 2000. Fungal spoilage of starchbased foods in relation to its water activity (aw). J Stored Prod Res,36: 47-54.
Binder E M. 2007. Managing the risk of mycotoxins in modern feed production. Anim Feed Sci Tech, 133: 149-166.
Berardo N, Pisacane V, Battilani P, et al. 2005. Rapid detection of kernel rots and mycotoxins in maize by near-infrared reflectance spectroscopy. J Agr Food Chem, 53: 8128-8134.
Genkawa T, Uchino T, Inoue A, et al. 2008. Development of a lowmoisture-content storage system for brown rice: storability at decreased moisture contents. Biosyst Eng, 99: 515-522.
Hu Y, Liu C, He Y. 2014. Kinetic models for determination of yeast in fresh jujube using near infrared spectroscopy. Spectrosc Spect Anal,34(4): 922-926.
Millar S, Robert P, Devaux M F, et al. 1996. Near-infrared spectroscopic measurements of structural changes in starch-containing extruded products. Appl Spectrosc, 50: 1134-1139.
McClure W F. 2003. Review: 204 years of near infrared technology:1800-2003. J Near Infrared Spec, 11: 487-518.
Ni X Z, Wilson J P, Buntin G D, et al. 2011. Spatial patterns of af l atoxin levels in relation to ear-feeding insect damage in pre-harvest corn.Toxins, 3: 920-931.
Shephard G S. 2008. Impact of mycotoxins on human health in developing countries. Food Addit Comtam, 25: 146-151.
Sirisomboon C D, Putthang R, Sirisomboon P. 2013. Application of near infrared spectroscopy to detect af l atoxigenic fungal contamination in rice. Food Control, 33: 207-214.
Tripathi S, Mishra H N. 2009. A rapid FT-NIR method for estimation of af l atoxin B1in red chili powder. Food Control, 20: 840-846.
USDA. 2004. Grain inspection handbook. Grainbook II. Grain Inspection, Packers and Stockyard Administration, Washington DC.
Zhang Q, Jia F G, Liu C H, et al. 2014. Rapid detection of aflatoxin B1in paddy rice as analytical quality assessment by near infrared spectroscopy. Int J Agric Biol, 7(4): 127-133.
杂志排行
Journal of Northeast Agricultural University(English Edition)的其它文章
- Recent Progress of Commercially Available Biosensors in China and Their Applications in Fermentation Processes
- Wheat Generation Adding in Xundian County of Yunnan Province in Summer
- Screening of Optimal Differentiation Medium to Lonicera edulis
- High-solid Anaerobic Co-digestion of Food Waste and Rice Straw for Biogas Production
- A Corpus-based Study on Collocation and Colligation of "Soil" in Agricultural English
- Microsatellite Analysis of Genetic Diversity Between Loach with Different Levels of Ploidy
