Numerical research on the mechanism of contaminant release through the porous sediment-overlying water interface*
2014-06-01GUOJiahong郭加宏CAOYang曹洋ZHENGShujun郑淑君
GUO Jia-hong (郭加宏), CAO Yang (曹洋), ZHENG Shu-jun (郑淑君)
Shanghai Key Laboratory of Mechanics in Energy Engineering, Shanghai Institute of Applied Mathematics and Mechanics, Shanghai University, Shanghai 200072, China, E-mail: jhguo@staff.shu.edu.cn
Numerical research on the mechanism of contaminant release through the porous sediment-overlying water interface*
GUO Jia-hong (郭加宏), CAO Yang (曹洋), ZHENG Shu-jun (郑淑君)
Shanghai Key Laboratory of Mechanics in Energy Engineering, Shanghai Institute of Applied Mathematics and Mechanics, Shanghai University, Shanghai 200072, China, E-mail: jhguo@staff.shu.edu.cn
(Received August 6, 2014, Revised October 13, 2014)
After the pollutant discharged into the river or lake has been reduced, the release of the contaminant from the sediment to the overlying water may cause the river and lake be contaminated again. On the condition that the overlying water flow does not lead to sediment suspension, numerical researches are carried out for the mechanism of contaminant release through the sedimentoverlying water interface. The overlying water flow is calculated as turbulence. The sediment is regarded as isotropic homogeneous porous medium, therefore the seepage field in the porous sediment layer is obtained by solving Darcyʼs equations. Coupled two dimensional steady flows of the overlying water and the pore water in the sediment are calculated. Based on the flow fields obtained, the unsteady contaminant solute transportation process in the pore water in the sediment and the overlying water is numerically simulated, as the shapes of the sediment-overlying water interface are flat or periodic triangular respectively. Numerical results show that the exchange of the pore water and the overlying water is an important factor which decides the release flux of the contaminant from the sediment to the overlying water. The pressure distribution produced by the overlying water flow along the sedimentoverlying water interface, as it is not flat, may induce the seepage of the pore water in the sediment and through the sedimentoverlying water interface, which may increase the release flux of the contaminant from the sediment to the overlying water.
numerical research, sediment-water interface, contaminant release, pore water
Introduction
Sediment in river, lake and sea is an important part of the natural water system, and may be considered as a sink or a source of contaminants under certain conditions. The contaminants in the overlying water may enter into the sediment under the effect of various factors, reducing the pollution of the overlying water. Likewise, after external pollutant discharge has been reduced, the release of contaminant from sediment to the overlying water may cause the river and lake be contaminated[1-3]. Therefore, the contaminant transport process between the sediment and the overlying water plays an important role in the water environment.
The release of contaminant from the sediment, as an example of phosphorous, is a complex phenomenon which involves a number of physical, chemical, and biological processes such as adsorption and desorption, ligand exchange mechanisms, dissolution of precipitates, mineralization processes, release from living cells, and autolysis of cells[4,5]. Related environmental factors controlling the release of the phosphorous from sediments include temperature, pH, redox potential, nitrate and sulfate concentration, bioturbation and mixing, and biological activity[6,7].
In the literature before, diffusion as the main transport process is prevalently regarded as the release mechanism of the contaminant transport from the sediment. By measuring the contaminants concentration in the pore water and the overlying water, the concentration gradient estimation method, which calculates the contaminants exchange rate and flux through the sediment-water interface using the Fickʼs first law, has been a kind of common research method for secondary contamination in the water body. The nutrient exchange rate through the sediment-water interface was also regarded as controlled by its concentrationgradient at the sediment-water interface. Choosing the Yangtze River estuary and coastal shore as the object of study, Liu et al.[8]preliminarily estimated the nutrient diffusion flux between the sediment and the overlying water using the Fickʼs first law.
Earlier theoretical research method for contaminant release flux from sediments to overlying water is called the “input and output” method, which estimates the contaminant releasing flux by determining the contaminant transport balance in the sediment and the overlying water. Based on the diffusion theory, Portielje and Lijklema[9]proposed a method for determining the exchange flux of contaminants between the overlying water and the sediment, considering the contaminants transport with the fluid flow. The exchange rate of the contaminant between the overlying water and the sediment can be expressed as below
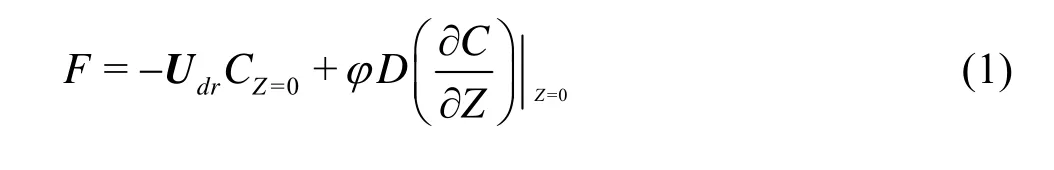
whereUdris the seepage velocity,Dis the effective diffusion coefficient at the sediment-water interface corrected for tortuosity,φis the porosity,Cis the concentration of the substance, andZis the depth into the sediment. The key point of the above method is to determine the seepage velocity and the concentration gradient at the sediment-water interface. It is obvious that a rough shape of the sediment-water interface can make the pressure distribution on the sediment-water interface uneven, inducing seepage flow of pore water in the sediment[10,11].
Numerical research has been conducted to quantify the exchange of the overlying water and the pore water in the sediment and the associated contaminant transport. Shum12]numerically simulated the oscillatory flow in the river with sine form bed. Although the numerical simulation only showed interest in the oscillatory flow, for the first time, an investigation for the exchange of the overlying water and the pore water in the sediment was involved. Assuming that the pressure distribution on the bed is of sine form, Jin et al.[13]gave numerical analysis and experimental research on the mechanism for how the solute is transported into the sediment. Feng and Michaelides[14]obtained the total contaminant transfer rate from a point source in the sediment by solving Darcy equation and the mass transfer equation numerically. It is revealed that mechanical dispersion can speed up the contaminant releasing from a point source. The effects of the bedform on the coupled flow above and below a sediment-water interface were studied by experiment[15]and numerical simulation[16,17]. However, until now few studies have been focused on contaminant release process from the sediment to the overlying water through the sediment-water interface.
In this paper, on the condition that the overlying water flow does not lead to sediment suspension, numerical researches are carried out for the contaminants release mechanism through the sediment-overlying water interface. The overlying water flow is calculated using thek-εturbulence model. The seepage field in the porous sediment layer is obtained by solving Darcy equation regarding that the sediment is isotropic and homogeneous porous medium. Two-dimensional coupled steady flow fields of the overlying water and the pore water in the sediment are calculated. Based on the flow fields obtained, the unsteady contaminant solute transport process in the sediment and the overlying water is numerically simulated, as the shapes of the sediment-overlying water interface are flat or periodic triangular, respectively. According to the numerical results the mechanism of contaminant release from the sediment to the overlying water through the sediment-overlying water interface is analyzed.
1. Governing equations
The overlying water flow can be considered as steady incompressible turbulent flow. The two equations below are the continuity equation and the momentum equation:
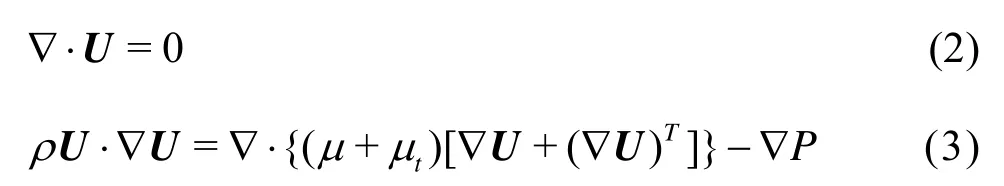
The turbulent flow of the overlying water is simulated by numerically solving the standardk-εturbulence model , whereρis the water density,μandtμare the dynamic viscosity and turbulent eddy viscosity, respectively,Pis the pressure; andUis the time averaged velocity.
Based on the calculation result of the steady flow field, the unsteady contaminant solute transport process in the overlying water is calculated by following unsteady solute transport equation
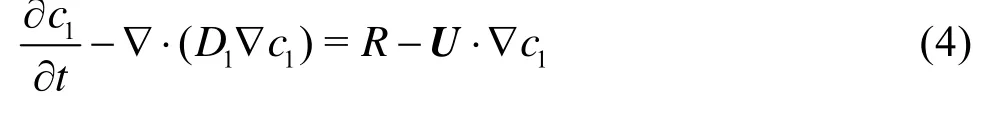
wherec1is the solute concentration in the overlying water,DIis the total diffusion coefficient,Ris the source item. The total diffusion coefficient isDI=μt/ρ+De, whereμt/ρis the turbulent diffusion coefficient, andDeis the molecular diffusion coefficient. As the turbulent diffusion coefficient is larger than the molecular diffusion coefficient for several orders of magnitude, we can ignore the molecular diffusion effect, thusDI=μt/ρ.
In the seepage field, sediment is regarded as isotropic and homogeneous porous medium. The pore flow in steady state is calculated by the Darcyʼs law and the continuity equation.Due to the fact that the seepage area is very thin, the gravitational potential is ignored. The governing equations are shown as below:
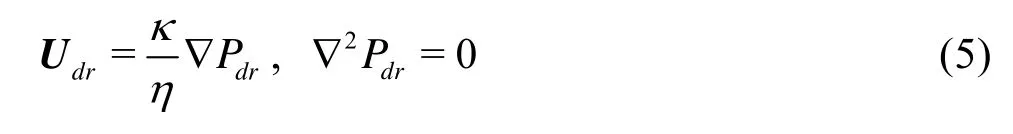
wherePdris the pressure of the pore water in the sediment, andUdris the Darcian velocity vector.
The quantity of adsorption and desorption of contaminant by the sediment is small considering the sediment to be non-sticky[18]. Therefore, neglecting the adsorption and desorption of contaminant by the sediment, the unsteady contaminant solute transport equation for pore water is
wherec2is the solute concentration in the pore water,κis the permeability of the porous medium,ηis the viscosity of the pore water, andDLis the diffusion tensor including
whereDLjiis the main component of the diffusion tensor,DLijis the cross component,LαandTαare the longitudinal and transversal dispersivity, respectively,τis the tortuosity factor, andDeis the molecular diffusion coefficient.
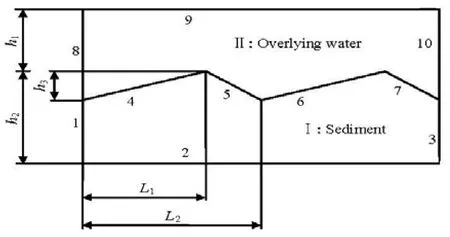
Fig.1 The schematic diagram of calculation area
2. Boundary and initial conditions
The sediment bed is the most important site for accumulation, storage and biogeochemical transformation of organic matter and contaminants in shallow aquatic environments. The triangular bed form is the typical bed form in shallow aquatic environments. Figure 1 is the schematic diagram of the calculation area when the form of the sediment-water interface is periodic triangle. The Fluid flow mainly includes the flow of the overlying water and the seepage of the pore water in the permeable sediment. Calculation area I is the pore water seepage area, and calculation area II is the overlying water area. The main geometric parameters are: the average depth of the overlying waterh2+h3/2 , the average depth of the sedimenth-h. As a special case,h3equals zero when the sediment-water interface is flat.
(1) Boundary conditions
By applying the rigid lid hypothesis, the boundary conditions for the free surface of the overlying water (Boundary 9) are given at a fixed elevation as
23/2
At boundarys 4, 5, 6 and 7, the interface of the sediment and overlying water, the upper side pressurePupperobtained from the overlying water flow field is given for simulation of the seepage in the sediment, while the lower side seepage velocityUlowerobtained in the sediment is given for simulation of the overlying water flow. The concentration is regarded as continuous across the interface of the sediment and the overlying water.
In order to approximate infinite conditions in the horizontal direction, periodic speed and pressure boundary conditions are used for the inlet (1,8) and outlet (3,10):
Zero flux is imposed at the Boundary 2.
(2) Initial conditions
The initial contaminant solute concentration in the overlying water is set to zero. The initial solute concentration in the pore water is the same everywhere and is set to a constantcs.
3. Numerical results and analysis
The governing equations for the flow of the over-lying water and the pore water, and the contaminant solute transportation in the overlying water and the pore water are solved by the finite element algorithm. Based on the coupled steady flows of the overlying water and the pore water in the sediment obtained, the unsteady contaminant solute transportation processes in the sediment and the overlying water are numerically simulated.
3.1Influence of the shape of the sediment-overlying water interface on the release of the contaminantsNumerical simulations are carried out for the contaminants release from the sediment to the overlying water on the condition of two different shapes of sediment-water interface. The first case is the contaminant release process when the sediment-water interface is flat. The field parameters are:h3=0 m,h2= 0.1 m,h1=0.05 m ,L1=0.11m andL2=0.14 m. The average flow velocity of the overlying water is 0.05 m/s. The initial contaminant solute concentration in the pore water is 10 mg/L.
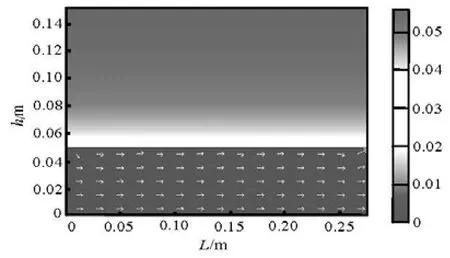
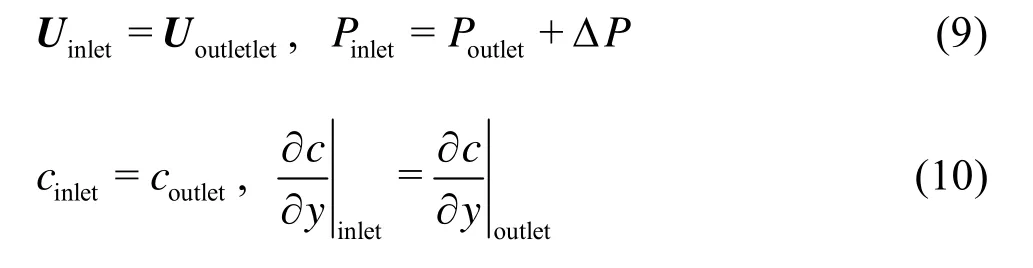
Fig.2 Velocity distribution (shade) and flow direction (arrows) of the seepage in the sediment
Figure 2 shows the velocity distribution in the whole flow field when the sediment-water interface is flat. The arrows show flow directions of the seepage in the sediment. It can be seen that in Fig.2 the seepage velocity of the pore water is far less than the velocity of the overlying water flow.
Figure 3 shows the contaminant concentration distribution in the overlying water and the pore water in the sediment at different times based on the simulated flow field. Figure 2 shows that there is almost no vertical seepage of the pore water through the sediment-overlying water interface. As a result, the main factor for contaminant release is diffusion and the contaminant release flux is small. As time increases, the contaminant concentration in the overlying water concentration in the overlying water increases slowly. After 30 h small amount of the contaminant in the sediment has been released and the concentration in the overlying water reaches only about 0.6 mg/L. The contaminant concentration in the overlying water is almost equivalent, because the turbulent transport mixing makes the concentration in the overlying water achieve consistent quickly.
Fig.3 Contaminant concentration distribution at different time
The second case is the contaminants release process when the sediment-water interface is periodictriangle. In the simulation the solution domain includes six crests and six troughs. The field parameters are:h3=0.02 m ,h2=0.09 m ,h1=0.04 m ,L1=0.11m andL2=0.14 m. The average flow velocity of the overlying water is also 0.05 m/s. The initial contaminant solute concentration in the pore water is 10 mg/L.
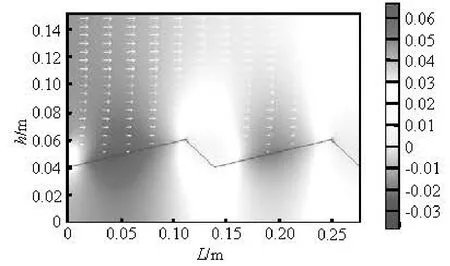
Fig.4 Pressure distribution and velocity vector (arrows) of the overlying water
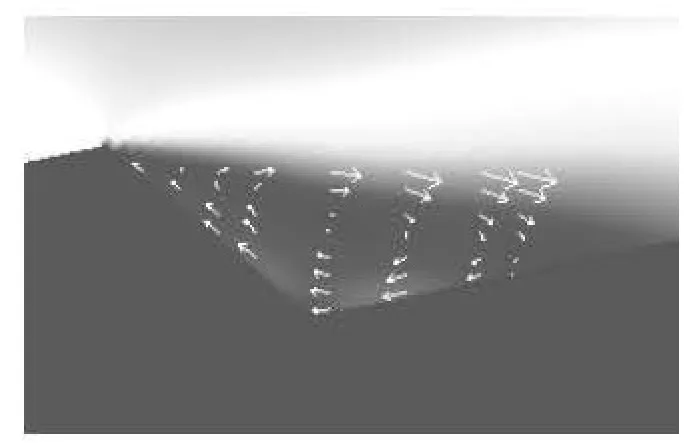
Fig.5 Local velocity vector behind the leeward side
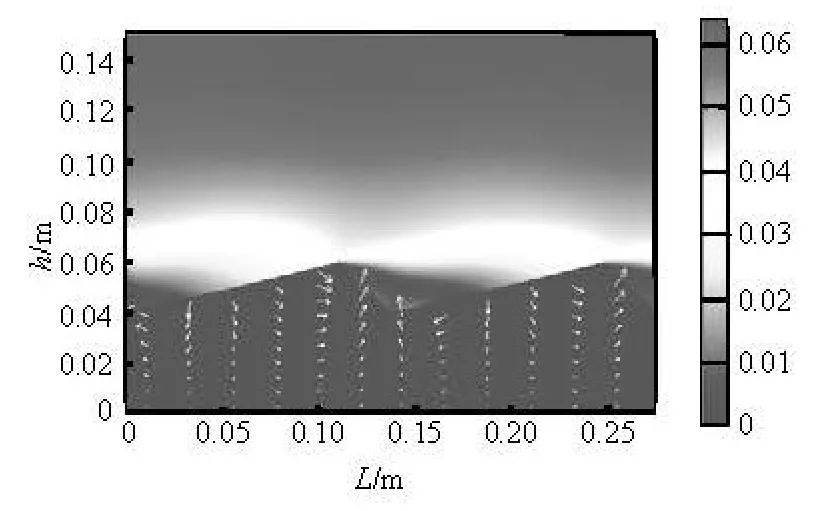
Fig.6 Velocity distribution (shade) and velocity vector (arrows) of pore water
The computational results in the central region of the solution domain including two crests and two troughs are chosen as representation. Figure 4 gives the calculation results of the pressure distribution in the overlying water and the pore water. The arrows show the velocity vectors in the overlying water area. Figure 5 shows the velocity vector in the leeward of the triangle bed partially. Figure 6 displays the distribution of velocity in the overlying water and the pore water. At the same time, the arrows show the velocity vector of the seepage in the sediment.
Figure 4 shows that the pressure is higher on the windward side of the triangular sediment-overlying water interface than that on the leeward side. The seepage of the pore water in the sediment is induced by above pressure distribution as shown in Fig.6. Figure 6 shows that the seepage velocity of the pore water is far less than that of the overlying water flow. On the windward side of the triangular sediment-overlying water interface, the overlying water seeps into the sediment. The pore water seeps from the windward side towards the leeward side. On the leeward side, the pore water seeps out of the sediment into the overlying water. The seepage of the pore water in the sediment and the exchange of overlying water and the pore water through the the sediment-overlying water interface, which greatly promotes the contaminant transport, makes the contaminant release flux be raised obviously.
An eddy is visible behind the leeward side as indicated in Fig.5. The overlying water flow detaches at the point of minimum pressure, which is near the triangular bedform crest, and reattaches near the point of maximum pressure, on the windward side as shown in Fig.5.
Figure 7 shows contaminant concentration distribution in the whole computational region at different times. As can be seen, the contaminant is transported into the overlying water along with the pore water which seeps into the overlying water on the leeward side of the triangular sediment-overlying water interface. As the overlying water seeps into the sediment on the windwar side, the contaminant concentration in the sediment under the sediment-overlying water interface falls quickly. After 30 h most of the contaminant has been released into the overlying water, and the contaminant concentration in the overlying water reaches about 1.81 mg/L.
Figure 8 shows the calculation results of the variation of the contaminant concentration with time in the overlying water as the sediment-overlying water interface is triangle and flat, respectively. Comparison of the contaminant concentration in the overlying water shows that at 2 h after beginning, when the sediment-overlying water interface is triangular, the contaminant concentration has reached 0.52 mg/L, which would be reached after 15 h when the sediment-overlying water interface is flat. After 30 h since the beginning, most of the contaminant in the pore water has been released into the overlying water reaching a state of release balance when the sediment-overlying water interface is triangular, while, only a small part of the total amount of contaminant has been released at the same time as the interface is flat. The main reason is that the irregular pressure distribution on the sediment-overlying water interface resulted in by theuneven shape of the interface makes the pore water seep across the sediment-overlying water interface which may boost the transportation of the contaminant from the sediment to the overlying water. Hence, the release flux of the contaminant from the sediment to the overlying water is increased. Since the seepage velocity of the pore water normal to the sediment-overlying water interface almost equals zero as the interface is flat, diffusion dominates the contaminant release. Therefore, the release flux of the contaminant from the sediment to the overlying water is small.
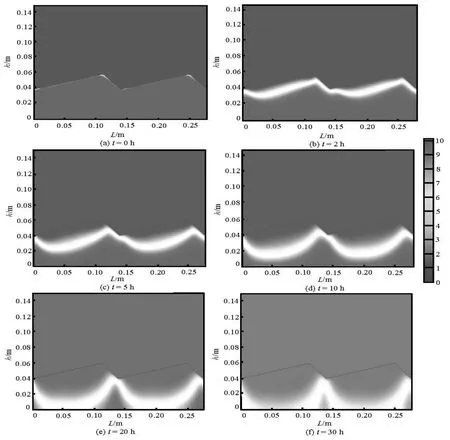
Fig.7 Contaminant concentration distribution at different time
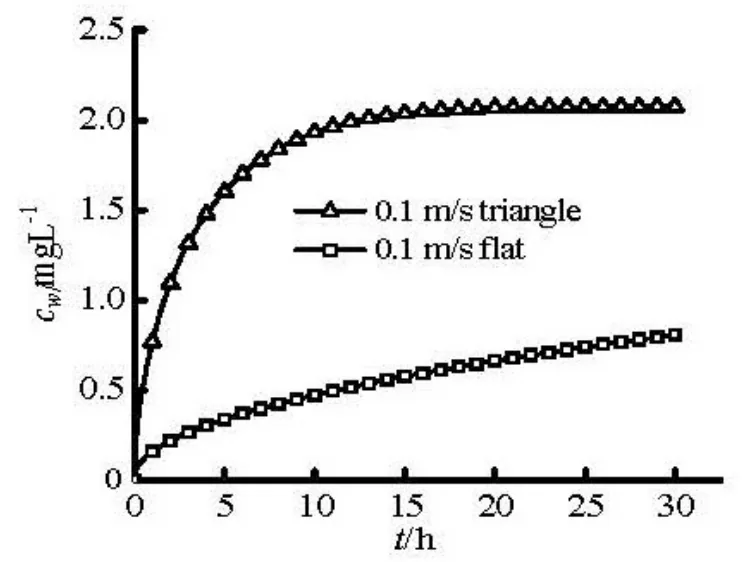
Fig.8 Contaminant concentration variation with time in the overlying water as the sediment-overlying water interface is triangle and flat respectively
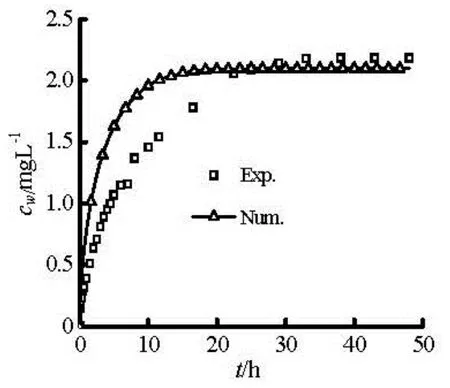
Fig.9 Comparison of the numerical and experimental[18]contaminant concentration variation with time in the overlying water
The numerical result of the variation of the contaminant concentration in the overlying water with the time when the sediment-water interface is periodic triangle is compared with the experimental result[18]in Fig.9. We can see that the balance time of the two results for contaminant release and adsorption by the sediment has the same conclusion, and concentration in the overlying water will not increase after 30 h. The roughness and the degree of irregularity of the sediment-water interface in the experiment is less than that in the numerical calculation, so that the balance time in this article is less than that in the experiment. But, if the sediment-water interface is regarded as smooth the balance time needed may reach more that 100 h as shown in Fig.8.

Fig.10 Contaminant concentration variation with time in the overlying water as the height of the triangle of the sediment-overlying water interface is different
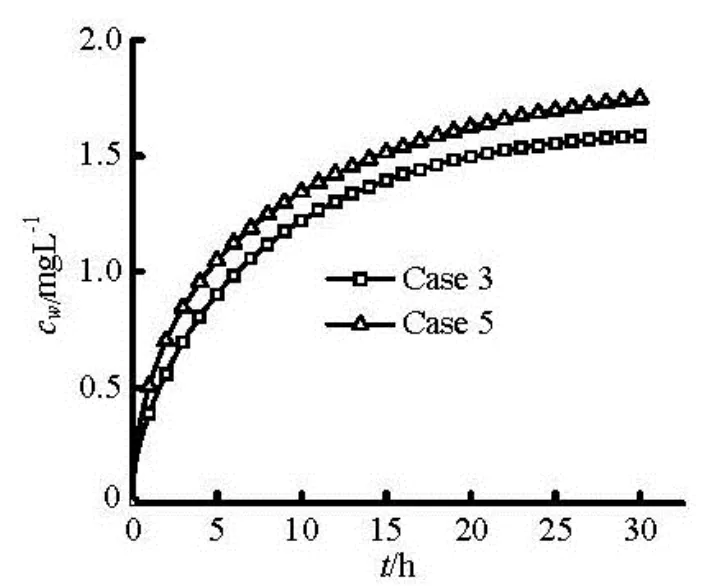
Fig.11 Contaminant concentration variation with time in the overlying water as the area of the sediment-overlying water interface is different
We also examined the influence of the shape of the sediment-water interface on the release of the contaminants as indicated by the height of the triangle of the sedimen-water interface,h3(see Fig.1 for illustration). Figure 10 shows the calculation results of the variation of the contaminant concentration with time in the overlying water as the height of the triangle of the sediment-overlying water interface is 0.02 m (Case 2), 0.01 m (Case 3) and 0.002 m (Case 4) respectively. The results indicate that as the height of the triangle increases, the release of the contaminants increases obviously, although the areas of the sedimentwater interface of each case are almost the same. In some literatures, the influence of the area of the sediment-water interface on the release of the contaminants is considered. We calculated the case (Case 5) whenh3=0.01m (the same as Case 3),h2=0.09 m ,h1=0.04 m ,L1=0.055 mandL2=0.1375/2, in which the area of the sediment-water interface is the same as that in Case 2 and 1.04 times of that in Case 3. Figure 11 shows the variation of the contaminant concentration with time in the overlying water in Cases 3 and 5. From the results we can see that as the height of the triangle of the sediment-water interface is the same, the release of the contaminants increases with the increase of the area of the sedimen-water interface nearly linerly. It can be concluded that the height of the triangle namely the roughness of the sedimentwater interface takes the major affection on the release of the contaminants.
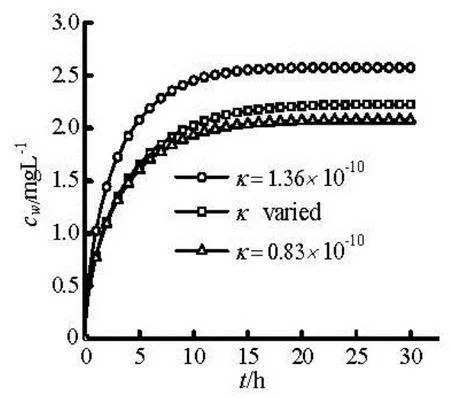
Fig.12 The influence of the sediment permeability on contaminant concentration in the overlying water
3.2Influence of the sediment characteristics on the release of the contaminants
The influence of the sediment permeability on the contaminant release flux is further analyzed. Figure 12 shows the effect of the permeability on the contaminant concentration in the overlying water. From the results ofκequals to 0.83×10⁻¹⁰and 1.36× 10⁻¹⁰, it can be seen that the release flux of the contaminant increases as the permeability increases. The larger the permeability of the sediment is, the fasterthe contaminant is released from the sediment to the overlying water. When the permeabilityκis varied from 0.83×10⁻¹⁰at the interface of the sediment and the overlying water to 1.36×10⁻¹⁰at the bottom of the sediment linearly, the contaminant release flux is near to which whenκequals to 0.83×10⁻¹⁰. It can be obtained that the contaminant release flux is determined mainly by the characteristics of the sediment near the interface of the sediment and the overlying water. Figure 13 shows the comparison of the contaminant release flux whenκof the sediment equals to 0.83× 10⁻¹⁰and 0.5×10⁻¹²respectively but their sedimentwater interfaces are the same periodic triangular as that of Case 2. However, if theκis much tiny, the contaminant release flux is tiny due to the tiny seepage of the pore water in the sediment even though the sediment-water interface is periodic triangular, and then the release of the contaminant from the sediment to the overlying water is dominated by diffusion.
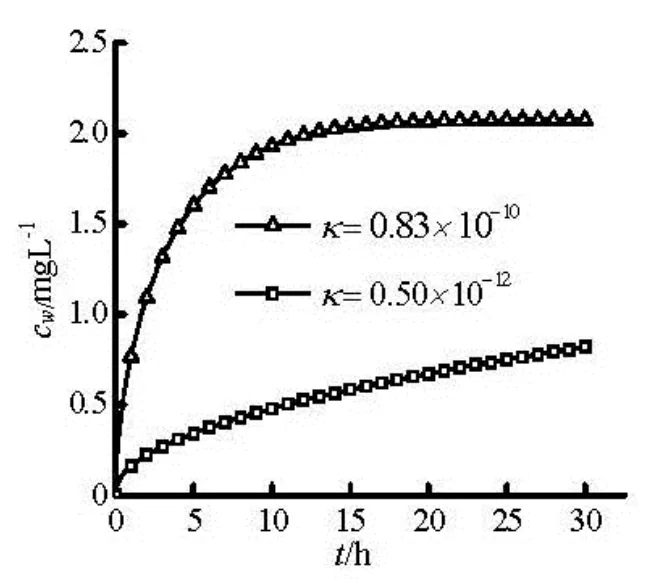
Fig.13 The contaminant concentration in the overlying water whenκof the sediment equals to 0.83×10⁻¹⁰and 0.5×10⁻¹²respectively
4. Conclusions
On the condition that the overlying water flow does not lead to sediment suspension, numerical research is carried out for the contaminants release mechanism cross the sediment-overlying water interface. The overlying water flow is calculated using thek-εturbulence model. The seepage field in the porous sediment layer is obtained by solving the Darcy equation regarding that the sediment is a isotropic and homogeneous porous medium. Numerical research is carried out for the mechanism of contaminant release from the sediment to the overlying water, as the shapes of the sediment-overlying water interface are either flat or periodic triangular. Interesting results are obtained by the numerical simulation.
The numerical results show that the contaminant release from the sediment to the overlying water is related to the exchange of the overlying water and the pore water through the interface. When the form of the sediment-overlying water interface is triangular, there exists contaminant exchange between the overlying water and the pore water through the interface obviously. The irregular pressure distribution on the sediment-overlying water interface makes the pore water seep in the sediment and across the sedimentoverlying water interface actively, which may boost the transport of the dissolvable contaminant from the sediment to the overlying water. As a result, the release flux of the contaminant from the sediment to the overlying water, as the form of the sediment-overlying water interface is triangular, is much larger than that when the interface is flat.
Only when the seepage velocity of the pore water normal to the sediment-overlying water interface almost equals to zero, diffusion dominates the contaminant release. Therefore, when there exists irregular pressure distribution on the sediment-overlying water interface resulted by various factors, for example the irregular shape of the bed of the river and the lake or the turbulence, if the release flux of the contaminant is calculated only by the Fickʼs law, it does not conform to the inner mechanism of contaminant release from the sediment to the overlying water.
For the periodic triangular sedimen-water interface, the height of the triangle, namely the roughness of the sediment-water interface, takes the major effects on the release of the contaminants. The sediment permeability takes an important effect on the release of the contaminants. If the permeabilityκof the sediment is tiny, the release of the contaminant from the sediment to the overlying water is dominated by diffusion even though the sediment-water interface is periodic triangular.
[1] HE Bao-gen, ZHOU Nai-sheng and YUAN Xuan-min. On contribution of sediment to secondary pollution of river[J]. Environmental Pollution and Control, 1999, 21(3): 41-43(in Chinese).
[2] CHENG Peng-da, ZHU Hong-wei and ZHONG Baochang et al. Sediment rarefaction resuspension and contaminant release under tidal currents[J]. Journal of Hydrodynamics, 2014, 26(5): 827-834.
[3] HU Xue-feng, GAO Xiao-jiang and CHEN Zhen-lou. Preliminary study on nitrogen and phosphorus release from the creek sediments, outskirts of Shanghai[J]. Shanghai Envitonmental Science, 2001, 20(2): 66-70(in Chinese).
[4] FANG Hong-wei, CHEN Ming-hong and CHEN Zhi-he. The characteristics of environmental sediment surface and numerical model[M]. Beijing, China: Science Press, 2009(in Chinese).
[5] CHRISTOPHORIDIS C., FYTIANOS K. Conditions affecting the release of phosphorus from surface lake sediments[J]. Journal of Environmental Quality, 2006, 35(4): 1181-1192.
[6] WANG S., JIN X. and BU Q. et al. Effects of dissolved oxygen supply level on phosphorus release from lakesediments[J]. Colloids and Surfaces A: Physicochemical and Engineering Aspects, 2008, 316(1-3): 245-252.
[7] JIANG Xia, JIN Xiang-can and YAO Yang et al. Effects of biological activity, light, temperature and oxygen on phosphorus release processes at the sediment and water interface of Taihu Lake, China[J]. Water Research, 2008, 42(8-9): 2251-2259.
[8] LIU Min, HOU Li-jun and XU Shi-yuan. Nitrogen and phosphorus diffusion fluxes across sediment-water interface in estuarine and coastal tidal flats[J]. Marine Environmental Science, 2001, 20(3): 19-23(in Chinese).
[9] PORTIELJE R., LIJKLEMA L. Estimation of sediment-water exchange of solutes in Lake Veluwe, The Netherlands[J]. Water Research. 1999, 33(1): 279-285. [10] JONSSON K., JOHANSSON H. and WÖRMAN A. Hyporheic exchange of reactive and conservative solutes in streams-tracer methodology and model interpretation[J]. Journal of Hydrology, 2003, 278(1-4): 153-171.
[11] PACKMAN A. I., SALEHIN M. Relative roles of stream flow and sedimentary conditions in controlling hyporheic exchange[J]. Hydrobiologia, 2003, 494(1-3): 291-297.
[12] SHUM K. Wave-induced advective transport below a rippled water-sediment interface[J]. Journal of Geophysical Research, 1992, 97(C1): 789-808.
[13] JIN G., TANG H. and GIBBES B. et al. Transport of nonsorbing solutes in a streambed with periodic bedforms[J]. Advances in Water Resources, 2010, 33(11): 1402-1416.
[14] FENG Z. G., MICHAELIDES E. E. Secondary flow within a river bed and contaminant transport[J]. Envi- ronmental Fluid Mechanics, 2009, 9(6): 617-634.
[15] HUETTEL M., RØY H. and PRECHT E. et al. Hydrodynamical impact on biogeochemical processes in aquatic sediments[J]. Hydrobiologia, 2003, 494(1-3): 231- 236.
[16] CARDENAS M. B., WILSON J. L. Hydrodynamics of coupled flow above and below a sediment-water interface with triangular bedforms[J]. Advances in Water Resources, 2007, 30(3): 301-313.
[17] CARDENAS M. B., WILSON J. L. and HAGGERTY R. Residence time of bedform-driven hyporheic exchange[J]. Advances in Water Resources, 2008, 31(10): 1382-1386.
[18] ZHANG Kun. Research of contaminated sediments effect on overlying water quality[D]. Doctoral Thesis, Shanghai, China: Shanghai University, 2011(in Chinese).
10.1016/S1001-6058(14)60107-4
* Project supported by the National Natural Science Foundation of China (Grant No. 11032007), the Shanghai Program for Innovative Research Team in Universities.
Biography: GUO Jia-hong (1966-), Male, Ph. D.,
Associate Professor
杂志排行

水动力学研究与进展 B辑的其它文章
- Pressure transient behavior of a slanted well with an impermeable fault*
- Experimental investigation on diffusive contaminant release from permeable sediment layer under unidirectional unsteady flow*
- A drifting trajectory prediction model based on object shape and stochastic motion features*
- Run-up of non-breaking double solitary waves with equal wave heights on a plane beach*
- The mechanical response of piles with consideration of pile-soil interactions under a periodic wave pressure*
- Performance of the bio-inspired leading edge protuberances on a static wing and a pitching wing*