The mechanical response of piles with consideration of pile-soil interactions under a periodic wave pressure*
2014-06-01WANGHuanling王环玲
WANG Huan-ling (王环玲)
Key Laboratory of Coastal Disaster and Defence, Ministry of Education, Hohai University, Nanjing 210098, China
Department of Civil Engineering, University of Toronto, Toronto, Ontario M5S 1A4, Canada,
E-mail: whl_hm@163.com
XU Wei-ya (徐卫亚)
Institute of Geotechnical Engineering, Hohai University, Nanjing 210098, China
ZHU Feng (朱峰)
Key Laboratory of Coastal Disaster and Defence, Ministry of Education, Hohai University, Nanjing 210098, China
The mechanical response of piles with consideration of pile-soil interactions under a periodic wave pressure*
WANG Huan-ling (王环玲)
Key Laboratory of Coastal Disaster and Defence, Ministry of Education, Hohai University, Nanjing 210098, China
Department of Civil Engineering, University of Toronto, Toronto, Ontario M5S 1A4, Canada,
E-mail: whl_hm@163.com
XU Wei-ya (徐卫亚)
Institute of Geotechnical Engineering, Hohai University, Nanjing 210098, China
ZHU Feng (朱峰)
Key Laboratory of Coastal Disaster and Defence, Ministry of Education, Hohai University, Nanjing 210098, China
(Received December 7, 2013, Revised April 20, 2014)
The pile-soil interaction under wave loads is an extremely complex and difficult issue in engineering. In this study, a physical model test is designed based on the principle of the gravity similarity to obtain time histories of wave forces of unsteady regular waves, and to measure the magnitude and the distribution of wave forces acting on the piles. A numerical model and relevant numerical methods for the pile-soil contact surface are adopted based on the principles of elastic dynamics. For a practical project, the time histories of wave forces on the piles are obtained through physical model tests. The deformations of the piles in the pile-soil interactions and the distribution of the bending moment on the piles are studied. It is shown that, with the increase of the period of wave pressures, the absolute value of the horizontal displacement of the piles increases, the embedment depth of the piles increases, and the scope of influence of soils increases. The change of the bending moment on the piles is consistent with that of its theoretical results, and the proposed numerical method can very well simulate the properties of the piles.
periodic wave pressure, pile-soil interaction, non-linear contact, numerical calculation
Introduction
The pile-soil interaction under wave loads is extremely complex, due to the nonlinearities of the flowsolid interaction, the material behaviors and the different medium contacts. The process and the mechanism of the pile-soil interaction under wave loads are important factors in the evaluation of the stability of actual projects.
Under the natural conditions of the underwater topography and the near-shore structures, the nearshore waves exhibit various deformations, such as wave shoaling and refraction, wave reflection on breakwaters or side walls of harbors, wave diffraction around the backs of islands and isolated buildings, and even wave breaking owing to the decrease of water depth. The wave-structure interaction, especially in a relatively shallow coastal water, and its mechanism concerning the waves and allowable overtopping buildings (submerged sheet-pile diaphragm walls and dikes at high tidal level) are extremely complex, and the wave forces acting on the buildings are difficult to be expressed analytically, especially, the time history of unsteady irregular wave forces. Accurate forecast of the wave deformation and the effect of wave forces on structures are vital to the planning and design of coastal engineering[1-3].
Under the actions of wave forces, the piles and the soils are in an interactive state. The importance of modeling the soil-pile interaction was discussed[4-7]. A simple method was proposed to analyze the vertically loaded pile groups under dynamic conditions[8]. A 3-D finite element subsystem methodology with an advanced plasticity-based constitutive model was developed[9], the proposed methodology can be used to analyze the seismic responses of structures under different support excitations such as the rigid ground motion and the interactive pile-foundation motion. A realistic soil-pile interaction model for laterally loaded piles in clay based on the existing p-y method was presented by Kim and Jeong[10]. Fan and Long[11]found that the ultimate soil resistance shows a non-linear relationship with the pile diameter and the soil dilatancy has a significant influence on the ultimate soil resistance. Yasser and Ahmed[12]developed finite element models of pile-soil interaction using Abaqus to study the effect of lateral loading on pile embedded in clay. These models include comparatively simple approaches in which the soils surrounding the piles are represented as a set of discrete springs, to sophisticated 3-D finite element models[7], such as elastic continuum models, solid (2-D or 3-D) finite element models[13,14]and linear (1-D) beam-column elements based on the beam theories. These analytical models have their advantages and disadvantages and respective application scopes.
Due to the large difference of properties between the piles and the surrounding soils, under the actions of wave forces, the deformations of the piles and soils are inconsistent, resulting in large contact stresses and relative displacements on the pile-soil interface with dislocations, slips or cracks on the interface. Thus, the pile-soil interface condition has a great influence on the numerical results. Jeong et al.[15]Used a series of 2-D and 3-D finite element analyses (FEA) to investigate the effects of soil slips at the pile-oil interface on the dragload development for single piles and their reductions in pile groups. The main feature of these analyses is to permit soil slips at the pile-soil interface. Mccabe and Lehane[16]presented a case history describing measurements made during the installation and load testing of groups of five closely spaced precast concrete piles in a soft clay-silt, and proposed a simple expression to evaluate the pile group stiffness efficiency. Ghazavi[17]presented an analysis for the kinematic seismic response of a tapered pile, and parametric studies show that the tapered piles tend to be more flexible than uniform piles of the same volume and length under earthquake loading, which is very interesting. Chik et al.[18]and Taha et al.[19]presented a 3-D FE analysis to simulate lateral load tests using PLAXIS where the soils are modeled by means of the Mohr-Coulomb elasto-plastic model. The numerical modeling techniques based on the FE provide versatile tools for modeling soil continuity, soil nonlinearity, soil-pile interface behaviors and 3-D boundary conditions[10].
In the siltation and reclamation project in the east beach of Nanhui District of Shanghai, a new dam structure-sheet-pile dam is used, with the pre-tensioning U-shaped prestressed concrete sheet piles as the retaining piles for the dam. Under the long-term and periodic wave loads, the interaction, the deformation and the force conditions of the retaining piles and the foundation need to be scientifically studied.
In this study, the time histories of unsteady regular wave forces are obtained by means of the physical model tests, and a numerical contact model for the pile-soil interaction is established. The relative deformation of the piles and the distribution of the bending moment on the piles are analyzed.
1. Project description
The siltation and reclamation project is in the east beach of Nanhui District of Shanghai, near the south bank of the south groove of Yangtze River estuary, from East China Sea in the east to Shanghai Pudong New District in the west. The project has a siltation area of 149 km2, with a total length of dike line of 50 km and a construction period of 10 years. The pre-tensioning U-shaped prestressed concrete sheet piles are used as the retaining piles for the dam in the project. For the U-shaped sheet pile, a unique structural design with variable cross-sections is adopted, which increases both the height, the moment resisting capacity and the width of the section, with good flexural behaviors. This kind of sheet piles are widely used in inland waters, but not in sea areas before due to the complex environment. Thus the deformation and the stability of the U-shaped sheet piles under the effect of waves in sea areas become an important engineering issue.
The dike bank is built with a single row of U-shaped prestressed concrete sheet piles 15 m in length, 3.7 m in top elevation and -11.3 m in bottom elevation (with Shanghai Wusong Zero elevation for the reference). The section of the U-shaped sheet pile is shown in Fig.1, and its technical parameters are given in Table 1.
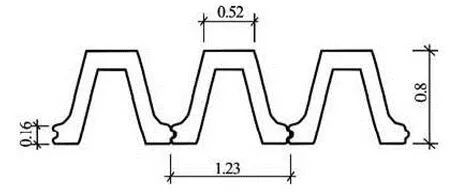
Fig.1 Section of U-shaped sheet pile (m)

Table 1 Main parameters of U-shaped sheet piles
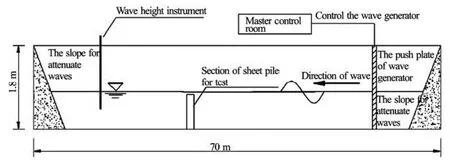
Fig.2 Cross-section of wave flume
The soil layers of the foundation from top to down are as follows: (1) the sandy silt layer containing shells and local humus, with medium permeability and a thickness of about 8 m, (2) the muddy and silty clay layer, with humus, large natural water content and high compression capability, in a state of plastic flow, which is the main weak layer of the natural foundation, with low permeability and a thickness of about 2.5 m, (3) the silty clay layer, in the fluid-plastic state, with high compression capability and low permeability and a thickness of about 9.2 m.
2. Physical model tests on wave forces
The magnitude and the distribution of wave forces acting on the piles can be obtained by means of physical model tests. In this study, an irregular wave flume of 70.0 m long, 1.0 m wide and 1.8 m high is employed, and the effective test section is 0.5 m wide. An irregular wave generator with a push-type plate is installed at one end of the flume. The motion route and the frequency of the wave-pushing plate are controlled by a motor system, and the wave height is measured by a capacitive wave height instrument. All the signals are acquired, recorded and analyzed through the computer. The distance between the test model and the wave generator is about 45 m. The model is in a scale of 1:17.5, and is designed based on the principles of the gravity similarity. The sizes and positions of the bottom blocks and the sheet piles are controlled within 5% and the geometric deviation is less 1%. The cross-section of the wave flume is shown in Fig.2.
In the tests, regular waves (similar to sine waves) are generated. The wave pressures on the sheet piles are measured by using the multi-functional monitoring system of DJ800, which can measure the distribution of wave pressures on multiple sites at the same time, and the sampling interval is 0.012 s.
In order to measure the wave pressures acting on the free end of the U-shaped sheet pile and the resultant force acting on the entire sheet pile, 42 pressure meters are arranged on the sheet pile from top to bottom. According to the wave elements, the physical model tests under different water levels can be carried out so as to obtain the time histories and the distribution of wave pressures.
The water level conditions during the tests are:
(1) The high water level (5.50 m) with the return period of 20 years.
(2) The mean high water level (3.49 m) with the return period of many years.
(3) The mean water level (1.86 m) with the return period of many years.
The test results are as follows:
(1) Under the condition of the high water level (5.50 m) and the mean high water level (3.49 m), the wave pressures acting on the sheet pile are more evenly distributed, with values of 20 kPa-22 kPa and 10 kPa-13 kPa, respectively, under the mean water level (1.86 m), the wave pressures along the sheet pile from top to bottom show an obvious gradient change, with values from 0.35 kPa to 13 kPa.
(2) The resultant force and the time history at each observation point can be obtained by the integration method, as shown in Figs.3-5. It is shown that under the effect of regular waves, the resultant force acting on the sheet pile presents a regular fluctuationof periodic variation, but its peak and valley values are obviously asymmetric, indicating that the positive wave pressures are greater than the negative ones.
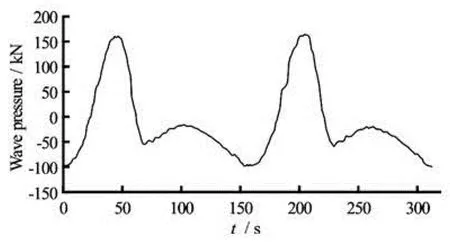
Fig.3 Time-history curve of wave pressures under high water level (5.50 m) with return period of 20 years
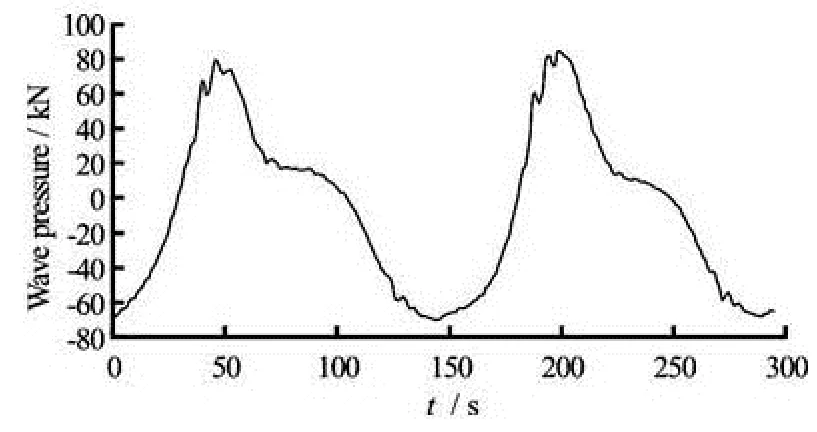
Fig.4 Time-history curve of wave pressures under mean high water level (3.49 m) with the return period of many years
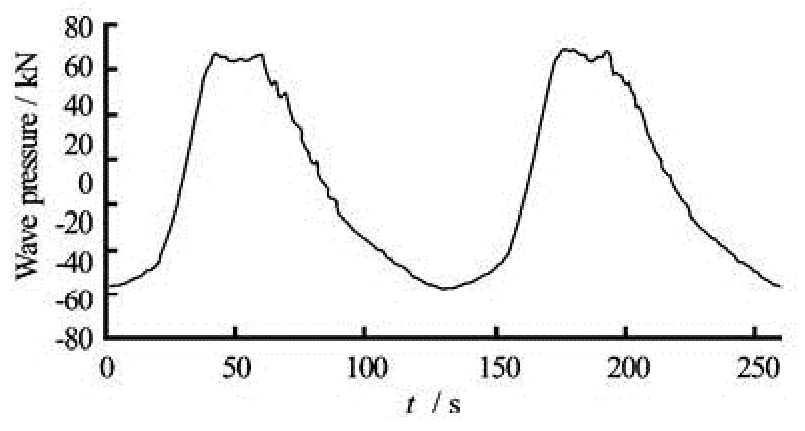
Fig.5 Time-history curve of wave pressures under mean water level (1.86 m) with the return period of many years
In Figs.3-5, for the case of high water level (5.50 m), the positive wave pressures acting on the pile take values of 160 kN and for the negative ones, it is -100 kN, and the absolute values of wave pressures are all greater than those for the case of the mean high water level (3.49 m) and the mean water level (1.86 m). Therefore, the condition of high water level (5.50 m) is adopted to analyze the deformation and bending moment for the pile.
3. Numerical simulation of deformation of piles based on pile-soil interaction
In order to obtain the deformation and the bending moment for piles in the process of pile-soil interaction under the known wave pressures, the three-dimensional dynamics finite element method based on infinitesimal-time increment is adopted in this study.
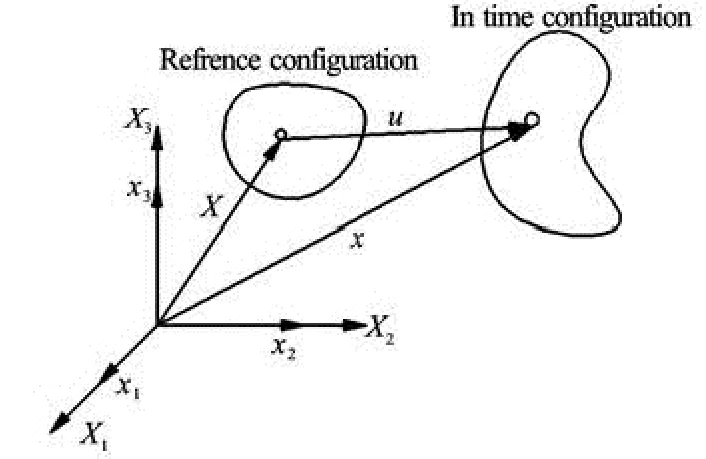
Fig.6 Description in material reference system
3.1Description of large deformation
Based on the basic principles of elastic dynamics, the large deformation motion of objects can be defined by referring to different configurations, and accordingly, their stresses and strains are differently described. If the spatial area occupied by an object att=0 is regarded as the reference configuration (the initial configuration) and that att=tas the current configuration (see Fig.6), the particle vector within the object in the initial configuration can be expressed as

whereeiis the base vector in the Cartesian coordinate system,Xiis the component of the particle radial vectorXin the reference configuration, and clearly,Xdoes not change with time.Xiis the material coordinates or Lagrange coordinates. The moved position of this particle with time is represented byx, andx=xiei,xibeing the spatial coordinates or Euler coordinates.
The Lagrange system is used to describe the motion and the deformation of an object: the material coordinatesXiand timetare taken as the independent variables, that is, the motion and the deformation of the object are examined by means of the moving particles, and the motion equation can be expressed as

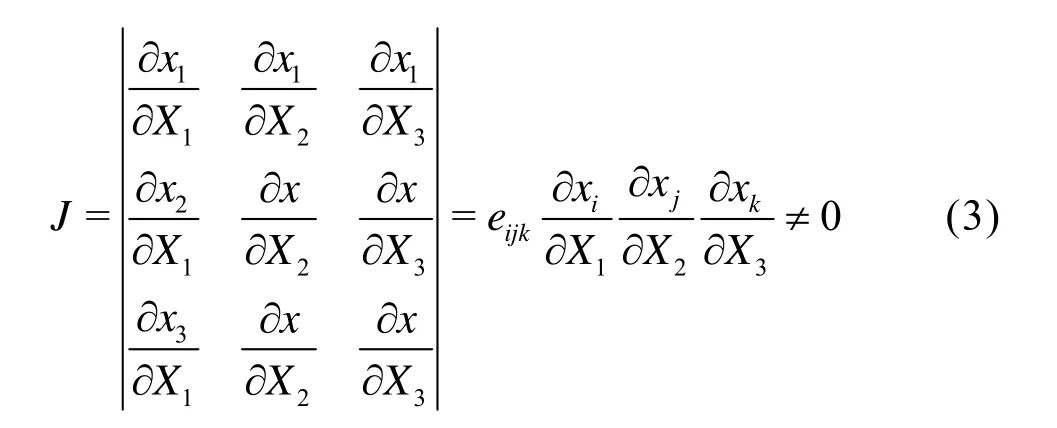
Equation (2) also shows a single-value continuous mapping from the initial configurationV0to the current configurationV, thuswhereJis the Jacobin determinant, ∂xi/∂Xiis the deformation gradient and is the asymmetric secondorder tensor. By checking the change dV0of the structural infinitesimal-hexahedra in the initial configuration, it can be shown thatJ=dV/dV0=ρ0/ρ, withρ0andρrepresenting the medium densities of the initial and current configurations, respectively.
3.2Numerical methods for dynamic large deformationAs the large deformation depends on the deformation history, the incremental calculation method is adopted. The time variable is discretized into a time series:t=0,t1,t2…tm,tm+1,…, and then the numerical solutions at these discrete time points are carried out. The solving methods might be the modified Lagrange scheme and the complete Lagrange scheme according to the selection of different reference configurations. In this study, the former is used.
The deformation of an object can be determined based on the principles of virtual work. For the large deformation, the nodal displacement is generally large and it may be difficult to achieve the numerical accuracy, thus, the first-order derivative of the displacement is regarded as the basic variable, and the equation for the virtual work is rewritten as

The numerical solution of Eq.(4) is first to discretize the spatial equation, and then, the spatial coordinatesxi(X,t) of the particleXat any time can be expressed as

whereNIis the shape function of nodeI, and the repeated subscript indicates the summation over its variable range.

Equation (6) is rewritten in matrix form, and then Eq.(6) is substituted into Eq.(4), which yields

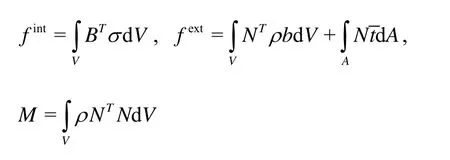
whereBTis the stress transformation matrix,bis the intensity of the force in unit mass,tis the intensity of the surface force,ρis the material density, andNis the shape function.
Solving Eq.(7) can yield the nodal displacementsuIunder the current time and further the structural stress and strain under the current time.
3.3Numerical methods for pile-soil contact
How to deal with the contact between the pile and soil interfaces is the key with regard to the pilesoil interaction problem. In this study, the penalty function method is used to simulate the contact between the piles and the soils.
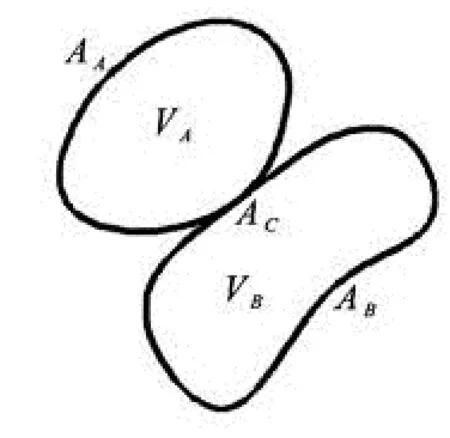
Fig.7 Schematic diagram of contact of two objects
3.4Non-contact condition of contact interface
For the contact of two objectsAandB, their current configurations areVAandVB, the boundary faces are denoted byAAandAB, and the contact surfaces are marked asAC=AA∩AB, as shown in Fig.7, whereAis the master body, and the contact surface is the master surface,Bis the slave body, and the contact surface is the slave surface. The non-contact condition can be expressed as

The nodal coordinates of objectsAandBon the surfaceACat each time step are compared in the computer program so as to satisfy the displacement compatibility conditions

wherexrepresents the nodal coordinates,Ndenotes the normal direction of the contact, andnis the normal unit vector.
3.5Surface force conditions of contact interface
According to the Newtonʼs third law, the surface forces at contact interface should satisfy:

wheretrepresents the contact forces,NandTdenote the normal and tangential directions of the contact forces, respectively.
where n is refractive index, which is related with λ. Therefore, the absorption coefficient, α, can be calculated from Eq. (4)[19],
The computational steps of the penalty function method for the contact forces are as follows:
(1) For any slave node ofns, search its nearest master nodems(see Fig.8).
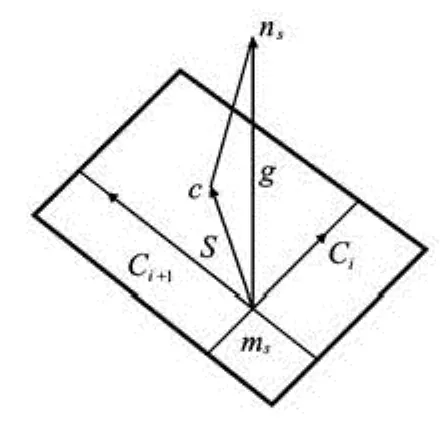
Fig.8 Schematic diagram of contact between slave node and master surface
In Fig.8,CiandCi+1are the vectors of two edges at pointmsin the master surface, the vectorSis the projection of the vectorgin the master surface,gis the vector of the master nodemsto the slave nodens.
(2) Check all the elements in the master surface connected to the master node, and determine the master element surface which may be contacted when the slave node penetrates the master surface.
If the master node does not coincide with the slave node and Eq.(11) does not hold true, the slave node is considered to be contacted with the master surface.

(3) Determine the location of the contact point of the slave node in the master surface. The vector at any position in the master surface can be expressed as
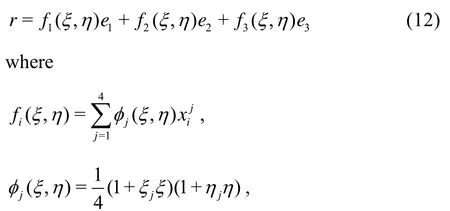
andxijis the xicoordinate at nodej,e1,e2,e3are the unit vectors of axes ofx1,x2,x3,ξ,ηare the parent element coordinate axes of the isoparametric elements.
The position of the contact pointc(ξc,ηc) can be expressed as:

(4) Check whether or not the slave node has penetrated the master surface (see Fig.9).
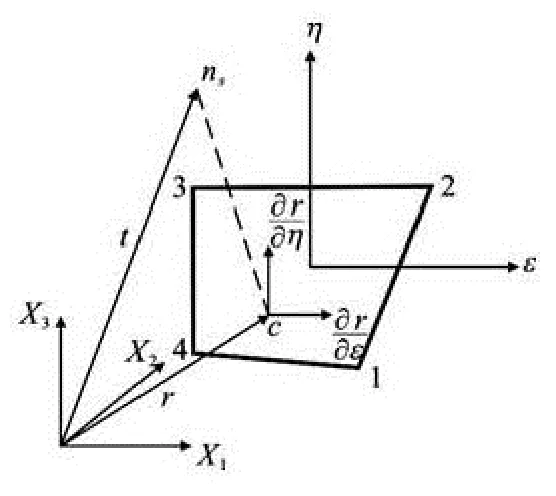
Fig.9 Relationship between slave node and master surface
Ifl=ni[t-r(ξc,ηc)]< 0, it indicates that the slave nodenspenetrates the master surface containing the contact pointc. Ifl≥0, it indicates that the slave nodensdoes not penetrate the master surface and no treatment is needed, and the computer program continues to search for the next point.
(5) If the slave node penetrates the master surface, the normal contact force should be applied at the slave nodens

wherekiis the normal stiffness factor of the master surface,niis the unit normal vector.
According to the Newtonʼs third law, there is a reaction force -fsapplied at the contact pointcin the master surface, and based on Eq.(15) the contact force is equivalently assigned to the node in the master surface.

(6) Calculation of tangential contact force.
If the normal contact force at the slave nodensisfs, then, the largest frictional force isFY=μfs. Whent=tn, set the friction force at the slave nodensto beFn, whent=tn+1, the possible friction force can be

wherekis the normal stiffness of the interface element, and

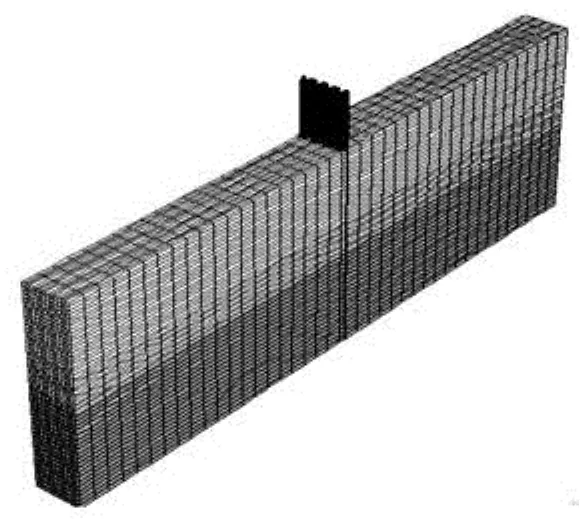
Fig.10 Geomechanical model
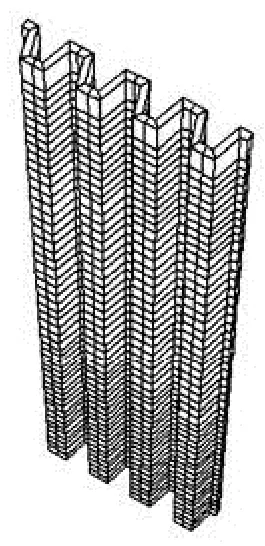
Fig.11 Model of U-shaped row piles
4. Numerical results
4.1Geomechanical model
According to the geological data, a geomechanical model is established. In the modeling, the foundation is divided into three levels (the sandy silt, the muddy and silty clay, and the silty clay). The model range is as follows: in theXdirection, the length is 64 m (greater than 2 times the pile length), in theYdirection, the width is 4.75 m and equal to the width of 4 U-shaped piles, and in theZdirection, the height is 23.3 m. The model has 39 428 nodes and 35 160 hexahedral elements, as shown in Fig.10, and the model for a single row of piles is shown in Fig.11. In order to simulate the bending moment on U-shaped piles and the contact between the U-shaped piles and the soils, the lining elements are used in the model.
According to the results of physical model tests, the extreme condition of high water level (5.50 m) is adopted to carry out the numerical calculation.
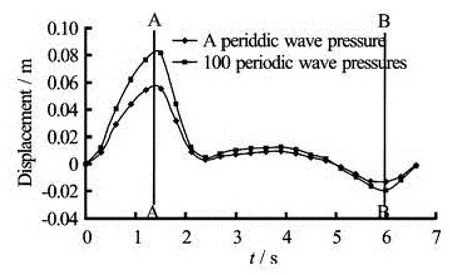
Fig.12 Change of displacements of piles at pile top
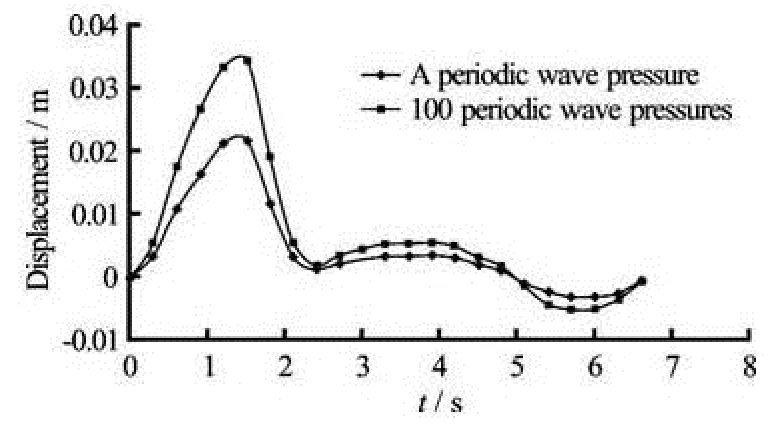
Fig.13 Change of displacements of piles at contact area between piles and soils
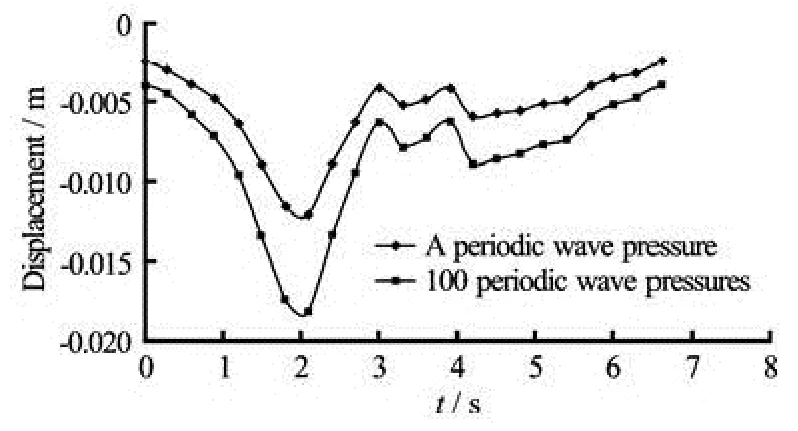
Fig.14 Change of displacements of piles at pile bottom
4.2Displacement and bending moment and stress for piles
The periodic wave pressures are applied on the piles until the calculation converges (100 periodic wave pressures). In order to investigate the displacement change for piles, three special points (pile top, pile bottom and contact area between the piles and soils) are considered, and the change of displacements at the three points with the time can be obtained. The displacement change for piles is in a state of dynamic process under the periodic wave pressures. To compare the change of displacements at the three points, the results under 1 and 100 periodic wave pressures are shown in Figs.12-14. The peak displacements at the three points under the periodic wave pressures aregiven in Table 2.

Table 2 Peak displacements at three special points under periodic wave pressures
It is shown that a periodic wave pressure produces a periodic displacement, and the displacement is different. When 100 periodic wave pressures are applied, the final displacement of piles under the condition of high water level (5.5 m) is obtained. Under the condition of high water level (5.5 m), the maximum displacement appears at the pile top, and its positive peak is 0.0812 m and the negative peak is 0.0197 m, an increase of 54.96% and 74.34% than that under the condition of 1 periodic wave pressure, respectively, indicating that the period of wave pressures has a significant impact on the deformation of piles.
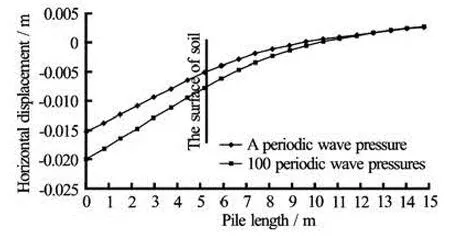
Fig.16 Horizontal displacements of piles at Point B
In order to show the change of the horizontal displacement of the pile within a response period, two extreme points (the maximum and the minimum) at the pile top is considered to analyze its horizontal displacement. Figure 12 shows the position of extreme Points A and B. The horizontal displacements at the extreme points within 1 and 100 periodic wave pressures are shown in Figs.15-16.
It can be seen that the horizontal displacements of piles at the extreme Points A and B have the same change trend. With the increase of the periodic wave pressures, the absolute value of the horizontal displacement of piles increases, the embedment depth (the intersection of the curve and thex-axis) of piles increases and the scope of influence of soils continues to increase. Under 1 and 100 periodic wave pressures, at the extreme Point A, the embedment depth of piles apart from the surface of soils is 4 m and 5.2 m, respectively, the embedment depth of piles is increased by 30%, at the extreme point B, the embedment depth of piles apart from the surface of soils is 3.6 m and 4.4 m, respectively, the embedment depth of piles is increased by 22.2%.
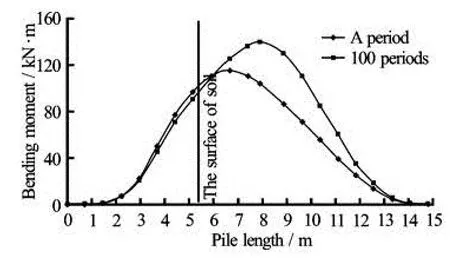
Fig.17 Distribution of bending moment of piles
The above analysis shows that the horizontal displacement of piles at Point A is the maximum, that is, it can produce the greatest bending moment. The change of the bending moment on piles is shown in Fig.17 and the values of the bending moment are given in Table 3.
It is shown that the largest bending moment increases with the increase of the period of the wave pressures, under 1 and 100 periodic wave pressures, the largest bending moment does not occur in the contact area between piles and soils, but in the places 1.4 m and 2.4 m apart from the surface of soils, and the largest bending moment is 114.9 kN·m and140.2 kN·m, respectively. When it is at the bottom of piles, the bending moment decreases to zero. The change of the bending moment on piles is consistent with that of its theoretical value.
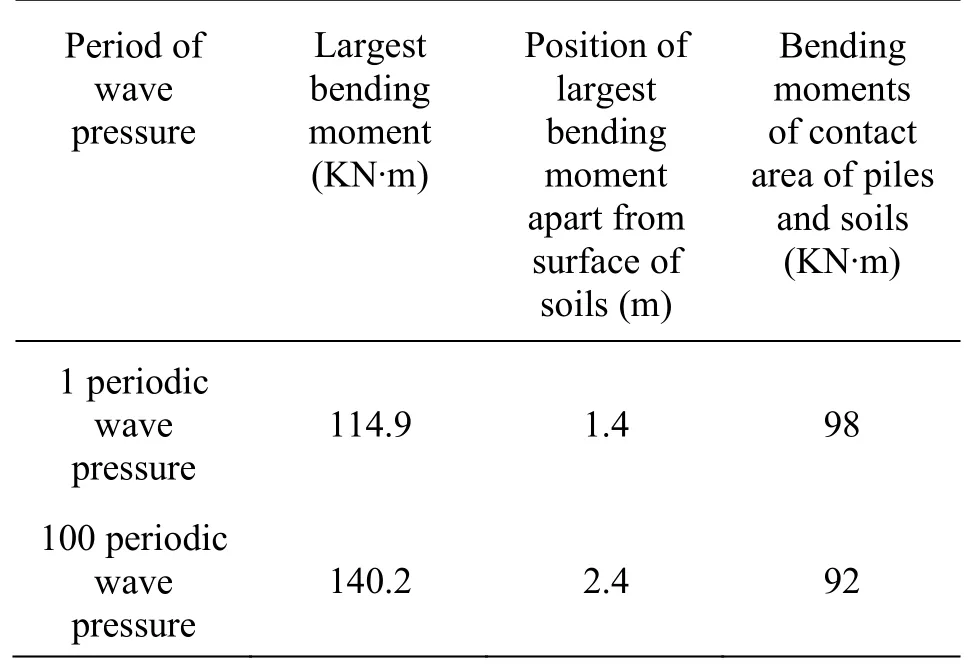
Table 3 Bending moments of piles under periodic wave pressures
5. Conclusion
Under the actions of wave forces, the piles and the soils are in an interactive state. Due to the nonlinearities of the flow-solid interaction, the material behaviors and the different medium contacts, the pilesoil interaction under wave loads is extremely complex. In this study, the three-dimensional dynamical finite element method based on infinitesimal-time increment is adopted to study the deformation and the bending moment of piles in the process of pile-soil interaction. The penalty function method is used to simulate the contact between the piles and the soils. The calculated results show that with the increase of the period of wave pressures, the absolute value of the horizontal displacement of pile increases, the embedment depth of piles increases and the scope of influence of soils continues to increase. Under the periodic wave pressures, the largest bending moment does not occur in the contact area between piles and soils. The change of the bending moment on piles is consistent with that of its theoretical value and the established numerical method can very well simulate the properties of piles.
[1] HUR D. S. Deformation of multi-directional random waves passing over an impermeable submerged breakwater installed on a sloping bed[J]. Ocean Engineering, 2004, 31(10): 1295-1311.
[2] OLIVEIRA F. S. B. F. Numerical modelling of deformation of multi-directional random waves over a varying topography[J]. Ocean Engineering, 2007, 34(2): 337-342
[3] HE Guanghua. An iterative Rankine BEM for wavemaking analysis of submerged and surface-piercing bodies in finite water depth[J]. Journal of Hydrodynamics, 2013, 25(6): 839-847.
[4] KÜCÜKARSLAN S., BANERJEE P. K. and BILDIK N. Inelastic analysis of pile soil structure interaction[J]. Engineering Structures, 2003, 25(9): 1231-1239.
[5] LEE C. J., BOLTON M. D. and Al-TABBAA A. Numerical modelling of group effects on the distribution of dragloads in pile foundations[J]. Geotechnique, 2002, 52(5): 325-335
[6] ROLLINS K., GERBER T. and LANE J. et al. Lateral resistance of a full-scale pile group in liquefied sand[J]. Journal of Geotechnical and Geoenvironmental Engineering, 2005, 131(1): 115-125.
[7] LIMKATANYU S., KUNTIYAWICHAI K. and SPACONE E. Response of reinforced concrete piles including soil-pile interaction effects[J]. Engineering Structures, 2009, 31(9): 1976-1986.
[8] CAIRO R., CONTE E. and DENTE G. Analysis of pile groups under vertical harmonic vibration[J]. Computers and Geotechnics, 2005, 32(7): 545-554.
[9] CAI Y. X., GOULD P. L. and DESAI C. S. Nonlinear analysis of 3D seismic interaction of soil-pile-structure systems and application[J]. Engineering Structures, 2000, 22(2):191-199.
[10] KIM Y., JEONG S. Analysis of soil resistance on laterally loaded piles based on 3D soil-pile interaction[J]. Computers and Geotechnics, 2011, 38(2): 248-257.
[11] FAN C. C., LONG J. H. Assessment of existing methods for predicting soil response of laterally loaded piles in sand[J]. Computers and Geotechnics, 2005, 32(7): 274-289.
[12] YASSER K., AHMED A. M. Numerical analysis of pile-soil interaction under axial and lateral loads[J]. International Journal of Concrete Structure and Materials, 2014, 8(3): 239-249.
[13] YANG Z., JEREMIC B. Numerical analysis of pile behavior under lateral loads in layered elastic-plastic soils[J]. International Journal for Numerical and Analytical Methods in Geomechanics, 2002,26(14): 1385-1406.
[14] TAKESHI M., KOICHI M. and HIROSHI M. RC pilesoil interaction analysis using a 3D-finite element method with fibre theory-based beam elements[J]. Earthquake Engineering and Structural Dynamics, 2006, 35(13): 1587-1607.
[15] JEONG S., LEE J. and LEE C. J. Slip effect at the pilesoil interface on dragload[J]. Computers and Geotechnics, 2004, 31(2): 115-126.
[16] MCCABE B. A., LEHANE B. M. Behavior of axially loaded pile groups driven in clayey silt[J]. Journal of Geotechnical and Geoenvironmental Engineering, 2006, 132(3): 401-410.
[17] GHAZAVI M. Analysis of kinematic seismic response of tapered piles[J]. Geotechnical and Geological Engineering, 2007, 25(6): 37-44.
[18] CHIK Z. H., ABBAS J. M. and TAHA M. R. et al. Lateral behavior of single pile in cohesionless soil subjected to both vertical and horizontal loads[J]. European Journal of Scientific Research, 2009, 29(2): 194-205.
[19] TAHA M. R., ABBAS J. M. and SHAFIQU Q. S. M. et al. The performance of laterally loaded single pile embedded in cohesionless soil with different water level elevation[J]. Journal of Applied Sciences, 2009, 9(5): 909-916.
10.1016/S1001-6058(14)60101-3
* Project supported by the China Scholarship (Grant No. 201406715005), Qing Lan Project, the Natural National Science Foundation of China (Grant Nos. 11172090, 11272113) and the Natural Science Foundation of Jiangsu Province (Grant No. BK2012809).
Biography: WANG Huan-ling (1976- ), Female, Ph. D.,
Associate professor
杂志排行
水动力学研究与进展 B辑的其它文章
- Pressure transient behavior of a slanted well with an impermeable fault*
- Numerical research on the mechanism of contaminant release through the porous sediment-overlying water interface*
- Experimental investigation on diffusive contaminant release from permeable sediment layer under unidirectional unsteady flow*
- A drifting trajectory prediction model based on object shape and stochastic motion features*
- Run-up of non-breaking double solitary waves with equal wave heights on a plane beach*
- Performance of the bio-inspired leading edge protuberances on a static wing and a pitching wing*
