Preparation, Characterization and Pharmacokinetics of Fluorescence Labeled Propylene Glycol Alginate Sodium Sulfate
2014-05-05LIPengliLIChunxiaXUEYitingZHANGYangLIUHongbingZHAOXiaYUGuangliandGUANHuashi
LI Pengli, LI Chunxia, XUE Yiting, ZHANG Yang, LIU Hongbing, ZHAO Xia, YU Guangli, and GUAN Huashi
Key Laboratory of Marine Drugs of Ministry of Education, Provincial Key Laboratory of Glycoscience and Glycotechnology of Shandong, School of Medicine and Pharmacy, Ocean University of China, Qingdao 266003, P. R. China
Preparation, Characterization and Pharmacokinetics of Fluorescence Labeled Propylene Glycol Alginate Sodium Sulfate
LI Pengli, LI Chunxia*, XUE Yiting, ZHANG Yang, LIU Hongbing, ZHAO Xia, YU Guangli, and GUAN Huashi
Key Laboratory of Marine Drugs of Ministry of Education, Provincial Key Laboratory of Glycoscience and Glycotechnology of Shandong, School of Medicine and Pharmacy, Ocean University of China, Qingdao 266003, P. R. China
A rapid and sensitive fluorescence labeling method was developed and validated for the microanalysis of a sulfated polysaccharide drug,namely propylene glycol alginate sodium sulfate (PSS), in rat plasma. Fluorescein isothiocyanate (FITC) was selected to label PSS, and 1, 6-diaminohexane was used to link PSS and FITC in order to prepare FITC-labeled PSS (F-PSS) through a reductive amination reaction. F-PSS was identified by UV-Vis, FT-IR and1H-NMR spectrum. The cell stability and cytotoxicity of F-PSS were tested in Madin-Darby canine kidney (MDCK) cells. The results indicated that the labeling efficiency of F-PSS was 0.522% ± 0.0248% and the absolute bioavailability was 8.39%. F-PSS was stable in MDCK cells without obvious cytotoxicity. The method was sensitive and reliable; it showed a good linearity, precision, recovery and stability. The FITC labeling method can be applied to investigating the absorption and metabolism of PSS and other polysaccharides in biological samples.
propylene glycol alginate sodium sulfate; fluorescence labeling; fluorescein isothiocyanate; pharmacokinetics
1 Introduction
Propylene glycol alginate sodium sulfate (PSS) is a sulfated polysaccharide that is derived from seaweed extract sodium alginate through hydrolysis and esterification. PSS is a heparinoid drug and has a strong anionic nature due to its sulphate and carboxyl group. Early studies have shown that PSS is active in anticoagulation, lowering blood pressure and reducing blood viscosity (Guan, 1999). It is mainly used for the prophylaxis and treatment of ischemic cardiovascular and cerebrovascular disease in China.
Although PSS was invented in 1980s, its pharmacokinetics has not been studied appropriately. This is due to the disadvantages, more or less, of traditional analysis methods (Stephan and Richard, 1997; Bikova and Treimanis, 2004; Houleet al., 1997; Piron and Domard, 1998; D’Ambraet al., 1997; Nicola, 2000; Hackleret al., 1995). Early pharmacokinetic studies using tritium (3H) labeled PSS (Liuet al., 1990) had many side effects because3H is radioactive (Bennettet al., 1996; Ambler and Hudson, 1984). In addition,3H-labeled PSS is not stable enough, which may cause some defects and certain blindness of pharmacokinetic parameters in clinical application. In order to utilize PSS better, establishing a new fluorescence labeling method of studying the pharmacokinetics of PSS is highly appreciated.
Being similar to other polysaccharides, PSS does not possess chromophoric or fluorophoric group, thus being detected by refractive and scattering indexing or colorimetric assaying (Hanet al., 2007). These methods are simple; however, they are relatively low in sensitivity. Fluorescein isothiocyanate (FITC) is a fluorescence labeling regent used usually to label proteins and peptides (Heet al., 2013; de Hasset al., 2000; Takaiet al., 2011; Renet al., 2012; Taoet al., 2013); however, it is rarely applied to label polysaccharides in plasma (Trubetskoyet al., 1990; Van der Sluijset al., 1985; Ariraet al., 1982). Usually polysaccharides and oligosaccharides have reducing ends and can conduct the reductive amination reaction of semi-acetal to introduce amine group (Paltauf and Hermetter, 1994; Ishizuka, 1997; Kristofferet al., 2001). Taking the advantage of this reaction, the primary amine can be easily linked to glycosyl residue of the reducing end and then react with FITC to label the polysaccharides and oligosaccharides selectively.
In this study, a selective and sensitive fluorescence labeling method was developed to quantify PSS in rat plasma. It was completely validated for linearity, accuracy and precision, recovery and stability.
2 Materials and Methods
2.1 Materials
PSS (MW11965Da) was provided by Qingdao Lantai Pharmaceutical Co., Ltd. FITC, 1,6-diaminohexane, cyanoborohydride sodium hydride (NaBH3CN) and MTT (3-(4,5-dimethylthiazol-2-yl)-2,5-diphenyl-2H-tetrazolium bromide) were purchased from Sigma (St. Louis, MO, USA). All chemicals were at analytical grade.
2.2 Animals
Healthy Wistar rats (male and female, 1:1), 180–220 g in body weight, were provided by Qingdao Institute for Drug Control (Qingdao, Shandong Province, P. R. China). The animals were acclimatized for at least 6 d ahead of use. All studies were carried out following the Guidelines for the Care and Use of Laboratory Animals and approved by Institutional Animal Care and Use Committee in XBLChina.
2.3 Preparation of Fluorescence Labeled PSS
To 20 mL of 0.5 mol L-11,6-diaminohexane in 10% acetic acid, 400 mg of PSS was added and dissolved. NaBH3CN (300 mg) dissolved in 2 mL distilled water was slowly added to PSS solution, and then magnetically stirred at 37℃ for 20 h. The supernatant was dialyzed after being centrifuged at 9000 r min-1for 10 min, and purified further through Sephadex G10 column. The outflow fraction (D-PSS) was detected with sulfuric acidphenol method and freeze-dried in a freeze dryer (Alpha 1-2/LD Plus, Martin Christ, Germany).
Two hundred milligrams of D-PSS was dissolved in 10 mL distilled water with the acidity adjusted to pH 8.5 with 0.5 mol L-1NaHCO3. Twenty milligrams of FITC dissolved in 2 mL methanol was added to D-PSS solution. The mixture was kept in 37℃ water bath in dark for 12 h. The labeling product was re-dissolved and dialyzed after alcohol precipitation. After being concentrated and purified through Sephadex G10 column, the outflow fraction was detected with sulfuric acid-phenol method and the corresponding components marked as F-PSS were collected after being freeze-dried, and stored at -50℃freezer for further use.
2.4 Fluorescence Labeling Efficiency
The stock solution of FITC (250 μg mL-1) was prepared with phosphate buffer (pH 7.4, hereafter PB), and kept at 4℃ in dark. A working standard solutions series with concentrations ranging from 0.250 to 2.50 μg mL-1were prepared by diluting the stock solution. With PB as control, the absorbance (Abs) of the working standard solutions was read at 480 nm (excitation) and 515 nm (emission) at a multi-function continuous spectrum microplate reader (Spectra Max M5, Molecular Devices, USA). The calibration curve of FITC was constructed by plotting Abs versus concentration.
F-PSS was dissolved in PB at 1, 2 and 4 mg mL-1respectively with their absorbance read three times as was done for FITC solutions. The fluorescence labeling efficiency of F-PSS was calculated by referring to the calibration curve.
2.5 Spectroscopic Characteristics of F-PSS
2.5.1 UV-Vis spectroscopy analysis
PSS, D-PSS and F-PSS were separately dissolved in PB at 1 mg mL-1, and 1 mg mL-1physical mixture of PSS and 1,6-diaminohexane was prepared in a similar manner. All solutions were scanned from 190 to 600 nm with UV-Vis spectrometer (TU-1810, Persee, China).
2.5.2 FT-IR spectroscopy analysis
Fourier transform infrared (FT-IR) spectrum of samples was measured on a Nicolet Nexus 470 spectrometer. Usually, one milligram of PSS, D-PSS and F-PSS were separately mixed with 200 mg of dried KBr powder, ground and then pressed into 1 mm pellets for FT-IR measurement in a frequency range of 4000–400 cm-1.
2.5.31H-NMR spectroscopy analysis
1H-NMR spectrum was recorded at 23℃ using a JEOL JNM-ECP 600 MHz spectrometer. Twenty five milligrams of PSS, D-PSS and F-PSS were separately deuterium exchanged by three successive freeze-drying steps in 99.90% D2O and then dissolved in 0.5 mL D2O (99.96%). Chemical shifts were expressed in ×10-6using acetone-d6 as internal standard at 2.225×10⁻⁶.
2.6 Cell Stability and Cytotoxicity Test
Madin-Darby canine kidney (MDCK) cells were grown in RPM1640 medium supplemented with 10% FBS (foetal bovine serum), 100 U mL of penicillin and 100 μg mL-1of streptomycin, and maintained at 37℃ in 5% CO2. For confocal imaging, MDCK cells were incubated with F-PSS at 250 μg mL-1and 4℃ for 12 h. The green fluorescence of F-PSS was measured at 520 nm ± 20 nm with Laser Scanning Confocal Microscope (Zeiss LSM510, GER). The cytotoxicity of F-PSS was assessed using MTT method. MDCK cells cultured in 96-well plates were exposed to different concentrations of F-PSS and PSS. In total, 10 μL of phosphate buffer saline (PBS) containing 0.5 mg mL-1MTT (final concentration) was added to each well. After incubation at 37℃ for 4 h, the supernatant was removed and 200 μL of DMSO was added to each well to solubilize the formazan crystal. After vigorous shaking, absorbance was read in a microplate reader (Bio-Rad, USA) at 570 nm.
2.7 Preparation of Plasma Calibration Standards and Quality Control (QC) Samples
F-PSS was dissolved in PB (11000 μg mL-1) as stock solution, which was then diluted with PB to make a concentration series (6600, 4400, 2200, 1100, 660, 110, 55 and 22 μg mL-1). Calibration working solutions (600, 400,200, 100, 60, 10, 5 and 2 μg mL-1) were prepared by adding the diluted stock solutions into blank plasmas (10:100). The quality controls (QC) (6 μg mL-1, low; 150 μg mL-1, middle; and 500 μg mL-1, high) were prepared as was done for calibration standards. All solutions were stored at -50℃ in dark until use.
2.8 Method Validation
2.8.1 Linearity and lower detection limit in plasma
The linearity of the method was detected from 2 to 600 μg mL-1in plasma and the samples were prepared as described above. The calibration curve was obtained by plotting concentration against fluorescence intensity. Leastsquares linear regression was used to estimate the linearity of the calibration standards with 1/x2as the weighting factor. The lower limit of quantification (LLOQ) was determined with the calibration standards (1, 0.8, 0.6, 0.4, 0.3, 0.2 and 0.1 μg mL-1, respectively). LLOQ was defined as the lowest concentration yielding a precision with coefficient of variation (CV) less than 20% and accuracy within 20% of the nominal value (between 80% and 120%) for each analysis.
2.8.2 Accuracy and precision
For plasma, the precision of the method was assessed by analyzing the intra- and inter-day variability of QC samples on the same day (n= 5) and on five consecutive days using freshly prepared calibration curves. The precision of the method was expressed as coefficient of variation (CV) and the accuracy of the method was determined by calculating the percentage bias from the nominal concentration. The intra-day and inter-day precisions were required to be below 15%, and the accuracy to be within ± 15%.
2.8.3 Recovery
The absolute recovery of F-PSS in plasma was determined by comparing the concentration of the QC samples at three different concentration levels with their actual concentrations. Recoveries at three QC levels were examined for five times.
2.8.4 Stability
To evaluate the long-term stability of F-PSS in plasma, the middle concentration QC sample (150 μg mL-1) was stored at -50℃ in dark for different times (2, 4, 12 weeks respectively). Thereafter, the samples were analyzed using freshly prepared calibration standards. The concentrations obtained were compared with the theoretical concentration of QC sample to determine the long-term stability of F-PSS in plasma.
2.9 Application in Pharmacokinetics
The rats were kept in a suitable animal room under controlled environmental conditions (room temperature 23℃ ± 2℃, humidity 55% ± 10%, 12 h light and 12 h dark-cycle with commercial food and free water). The rats were fasted overnight prior to dosing. Fourteen rats were divided into oral administration and intravenous injection group. F-PSS was dissolved in sterile saline water and administered to the rats by single oral gavage (50 mg kg-1) and single injectionviathe tail vein (25 mg kg-1). The blood samples (about 0.3 mL) were collected from the tip of the tail at predetermined time intervals up to 48 h after oral administration and 24 h after intravenous injection. The blood samples were transferred into Eppendoff tubes with EDTA as the anticoagulant, mixed gently, and then centrifuged (4000 r min-1, 10 min) to obtain plasma, which were kept at -20℃ until analysis.
Pharmacokinetic analysis of F-PSS in plasma was performed using the Practical pharmacokinetic program (3p87)) (Chinese Society of Mathematical Pharmacology).
3 Results and Discussion
3.1 Preparation of F-PSS
PSS does not react with FITC directly through reductive amination; it does not contain amino group. To make the reaction possible, 1,6-diaminohexane was used as a suitable linker. The aldehyde of the reducing end of PSS reacts with 1,6-diaminohexane, producing PSS derivative (DPSS). The purified D-PSS then reacts with FITC under weak alkaline conditions, yielding FITC-labeled D-PSS (FPSS). The synthesis process and chemical structures are illustrated in Fig.1.
Tyramine was used as the linker to label polysaccharide and the fluorescence labeling efficiency was very low (Tanget al., 2010). Based on our experiments, 1,6-diaminohexane was found to be a linker better than tyramine. To obtain higher fluorescence labeling efficiency, several experiment factors were studied, including the concentration of 1,6-diaminohexane, NaBH3CN and acetic acid, the quantity of FITC, and reaction time and temperature. According to the results, the optimal reaction condition was defined and the linear calibration curve was obtained in the range of 0.25–2.50 μg mL-1(r2> 0.99). The fluorescence labeling efficiency of F-PSS was 0.522% ± 0.0248%.
3.2 Spectroscopic Characteristics of F-PSS
3.2.1 UV-Vis spectroscopy analysis
As shown in Fig.2, the UV absorption peak of PSS was at 220 nm (a) and the UV absorption peak of D-PSS was at 275 nm (b). There was a significant difference between D-PSS and the physical mixture of PSS and 1,6-diaminohexane (b and d). It can be inferred that 1,6-diaminohexane had been connected to PSS successfully. In addition, there was UV absorption of F-PSS at 495 nm, which was the characteristic absorption of FITC (c).
3.2.2 FT-IR spectroscopy analysis

Fig.1 The fluorescence labeling process of F-PSS and its chemical structure.
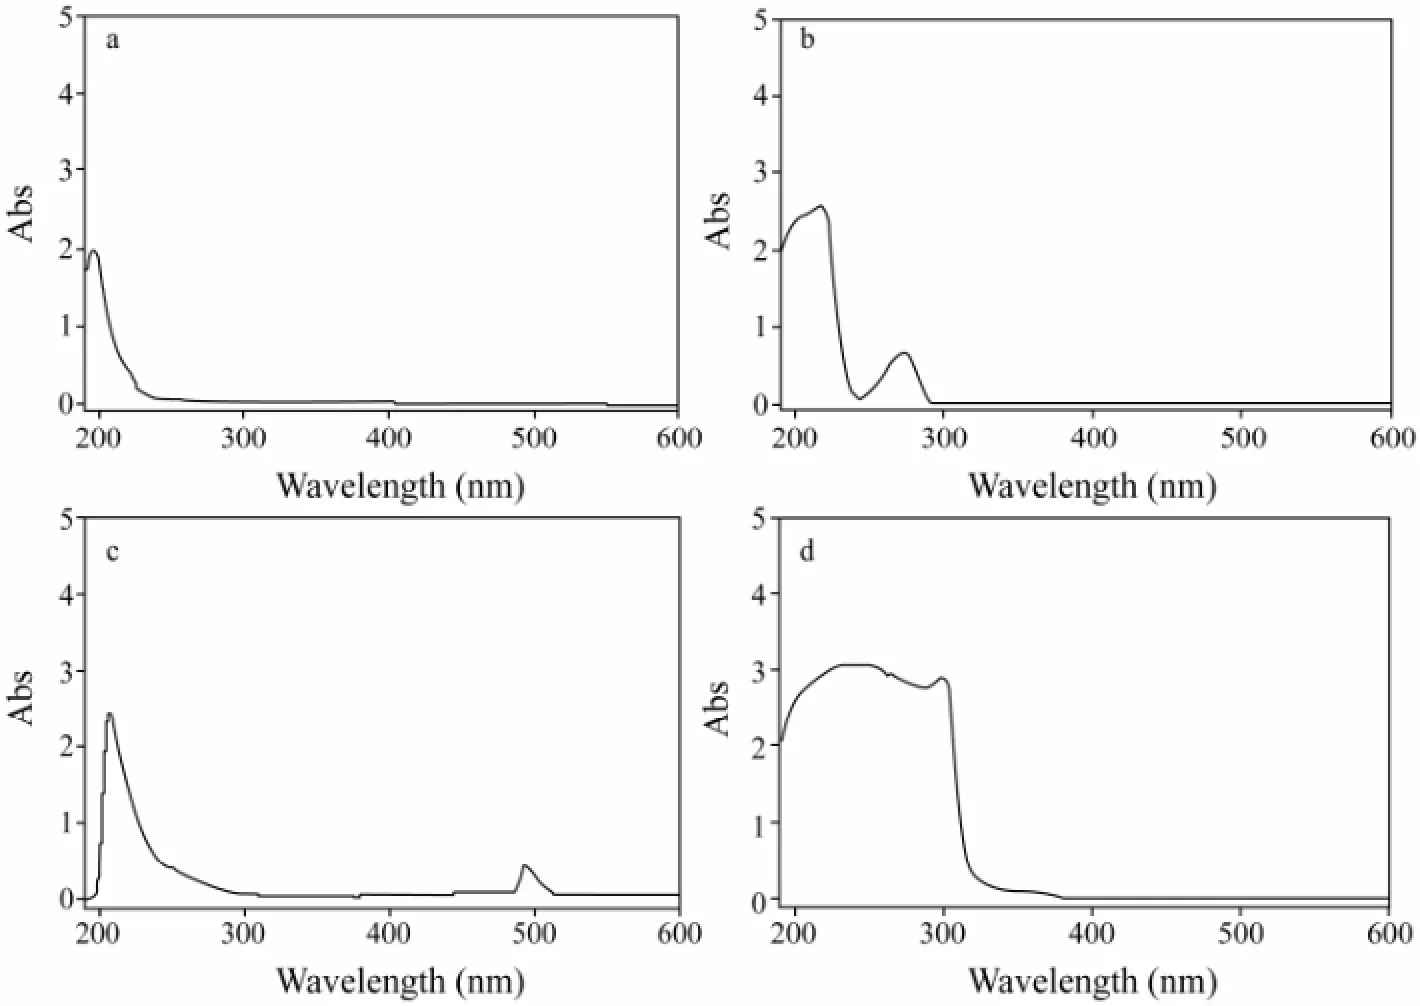
Fig.2 The UV-Vis spectrum of PSS (a), D-PSS (b), F-PSS (c) and the mixture of PSS and 1,6-diaminohexane (d).
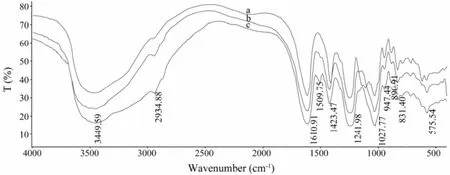
Fig.3 The FT-IR spectrum of PSS (a), F-PSS (b) and D-PSS (c).
Because the fluorescence labeling efficiency of F-PSS was only 0.522% ± 0.0248%, the labeling reagent linked to the reducing end of PSS will not affect its backbonestructure. Therefore, the related 1,6-diaminohexane and FITC signals were weak in the FT-IR spectrum. As shown in Fig.3, the peak of νN-Hof D-PSS and F-PSS was covered by the broad, strong peak of νO-H(3449 cm-1) of PSS, and the strong carboxylate ion band (1610 cm-1) also covered the week absorbance of δνN-Hin 1,6-diaminohexane and the skeletal vibrations of aromatic ring in FITC. These findings indicated that the main skeleton of PSS, D-PSS and F-PSS was almost the same.
3.2.3 1H-NMR spectroscopy analysis
As shown in Fig.4, 1,6-diaminohexane had been successfully connected to PSS; there were peak signals at 1.47×10⁻⁶, 1.73×10⁻⁶and 3.05×10⁻⁶(Figs.4b and c). In addition, there was a peak signal at 6.69×10⁻⁶of FITC (Fig.4c). It was inferred that PSS had been fluorescence labeled successfully by FITC through 1,6-diaminohexane.
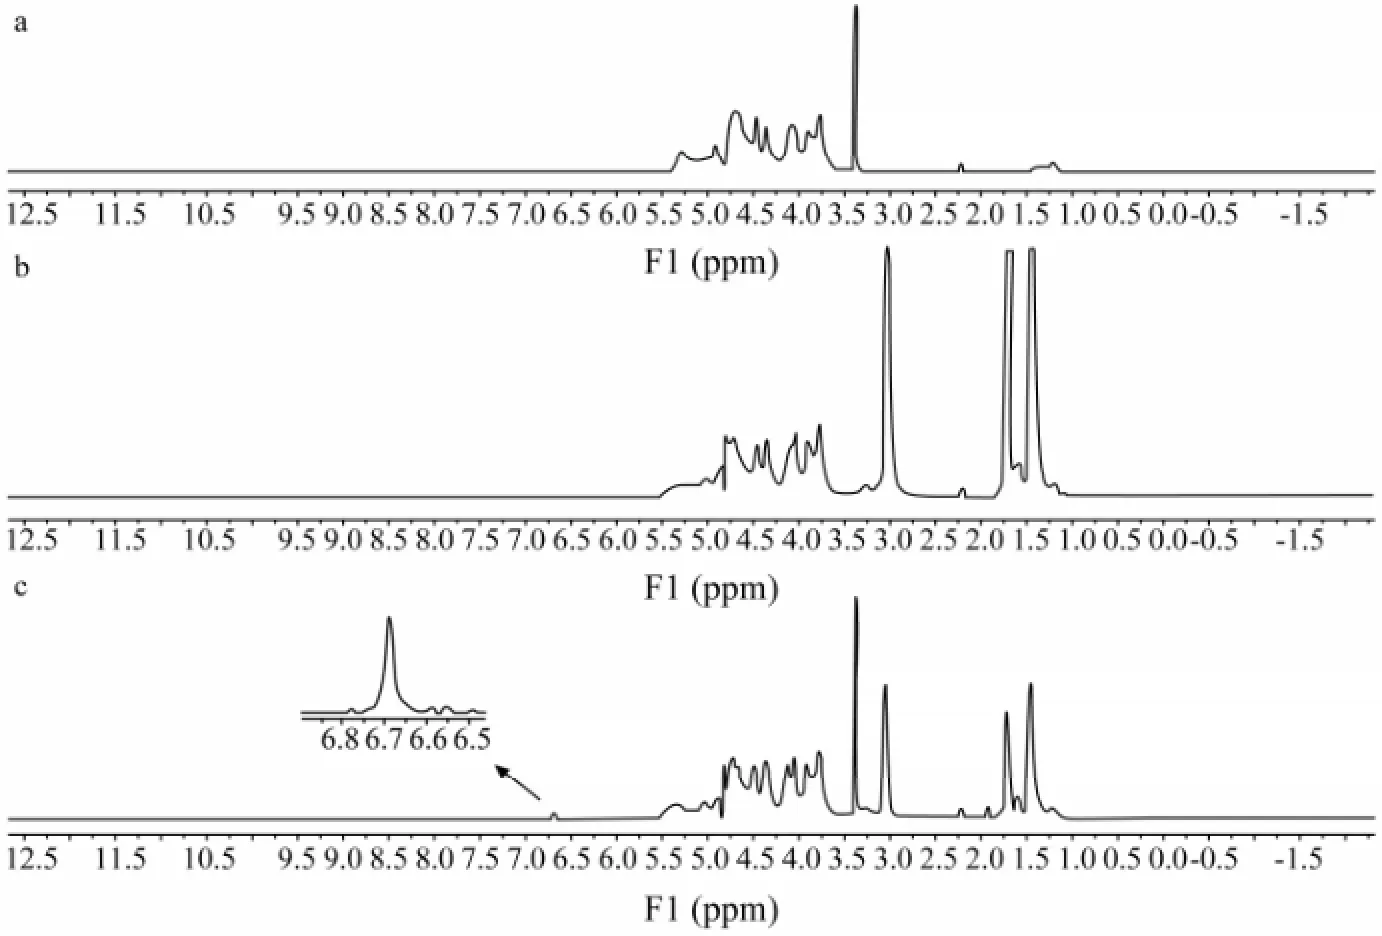
Fig.4 The1H-NMR spectrum of PSS (a), D-PSS (b) and F-PSS (c).
3.3 Cell Stability and Cytotoxicity Test
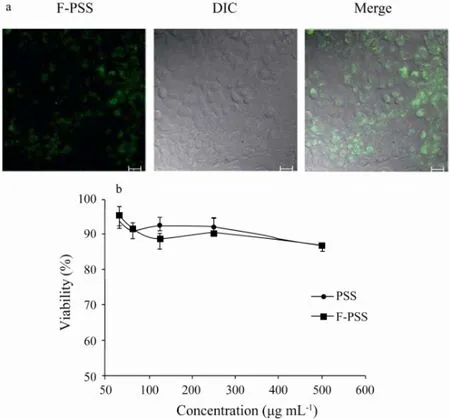
Fig.5 Cell stability (a) and cytotoxicity (b) test of F-PSS. a, F-PSS (250 μg mL-1) was added to MDCK cells. The cells were washed three times before confocal imaging after incubation at 37℃ for 12 h. Scale bar, 20 μm. b, the cytotoxicity test profile of PSS and F-PSS with MTT method (n = 3).
The cell stability and cytotoxicity of F-PSS were evaluated by performing living cell imaging of MDCK cells. As shown in Fig.5a, F-PSS could enter into the MDCK cells after 12 h incubation and the fluorescencecould be found in cell cytoplasm. In addition, it could be deduced that F-PSS was stable in MDCK cells because there was no obvious miscellaneous fluorescent spots after 12 h incubation. Moreover, the cells morphology did not change too much, which suggested that F-PSS had little toxicity to MDCK cells. Besides that, the cytotoxicity of F-PSS was tested with MTT method. As shown in Fig.5b, the cell viability of F-PSS was all higher than 85% at different concentrations, which showed similar effects to PSS at the highest concentration of 500 μg mL-1. So it can be concluded that F-PSS almost had no cytotoxicity to mammalian cells just the same as the other marine sulfated polysaccharides (Liet al., 2002). Therefore, this fluorescence labeling method and labeled product can be used to study the metabolism rule of the marine polysaccharide drug PSSin vivo.
3.4 Method Validation
3.4.1 Linearity and lower detection limit in plasma
The linear calibration curve was obtained in the range of 2–600 μg mL-1in rat plasma with correlation coefficient of 0.9999. The lower limit of quantification (LLOQ) of F-PSS was 0.10 μg mL-1. The sensitivity of the fluorescence labeling method is good.
3.4.2 Accuracy and precision
Assaying precision and accuracy were determined by using QC samples at three concentrations in replicate (n= 5) by performing complete analytical runs on the same day and on five consecutive days. The intra- and interday variability of the assay for plasma was listed in Table 1. The intra-day CV% at 6, 150 and 500 μg mL-1of PSS were 1.17%, 0.55% and 0.27% (n= 5), respectively. The inter-day CV% at the above concentrations were 3.12%, 1.00% and 0.26% (n= 5), respectively. All the data obtained were within the acceptable limit, which indicated the method was precise and accurate.
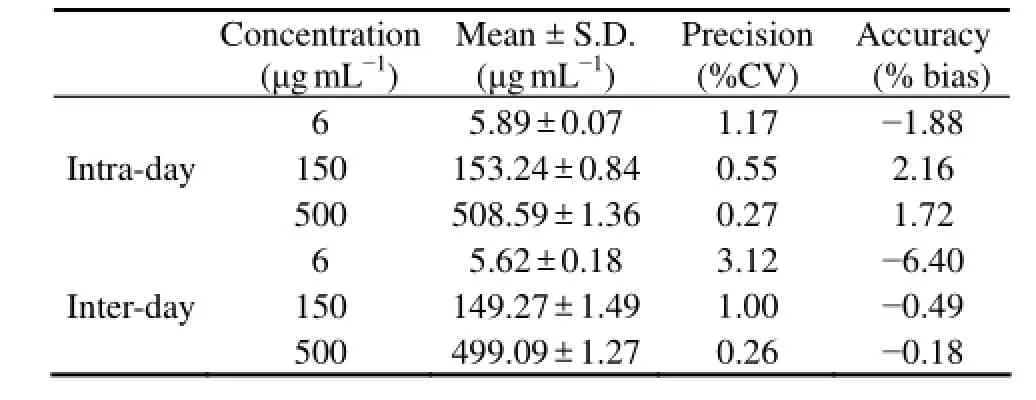
Table 1 Intra- and inter-day precision and accuracy of F-PSS in rat plasma (n = 5)
3.4.3 Recovery
The mean absolute recoveries of F-PSS from rat plasma were summarized in Table 2. The mean absolute recoveries of F-PSS were 95.08% ± 2.67%, 99.20% ± 0.66% and 99.63% ± 0.53% at the concentrations of 6, 150 and 500 μg mL-1, respectively. The results could assure the accuracy and precision of the quantitative analysis of F-PSS in plasma because the recoveries were consistent and reproducible.
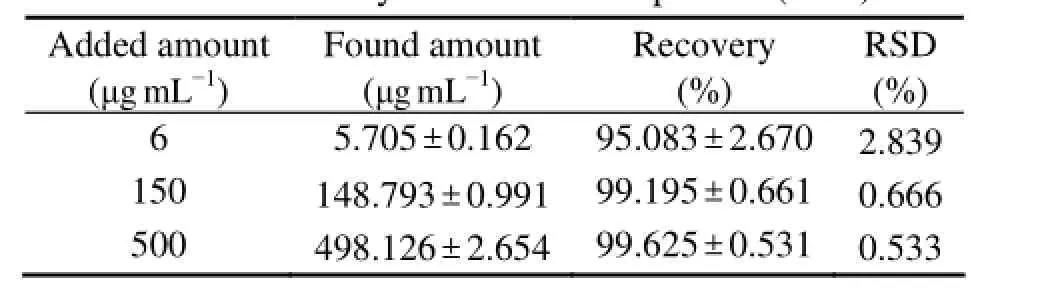
Table 2 Recovery of F-PSS in rat plasma (n = 5)
3.4.4 Stability
Long-term stability studies showed that there was no significant degradation of F-PSS in rat plasma after being stored at -50℃ in dark for different times (Table 3). F-PSS was stable in rat plasma because all the %CV and %Bias were below ± 2%.
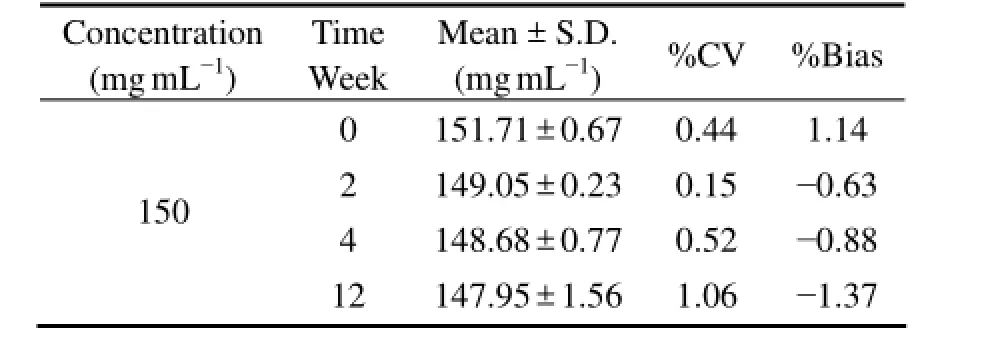
Table 3 Long-term stability of F-PSS in rat plasma at different days (n = 3)
3.5 Pharmacokinetics of F-PSS
The method was applied to the pharmacokinetic study after oral (50 mg kg-1) and intravenous (25 mg kg-1) administration of F-PSS. The pharmacokinetic parameters were listed in Table 4 and the pharmacokinetic profiles of F-PSS were shown in Fig.6. According to the results, the time to peak concentration (Tmax) of F-PSS in present study was 1.00 ± 1.32 h and the half-life time (T1/2) was 11.31 ± 7.91 h after single oral administration. The halflife time (T1/2) was 1.39 ± 0.27 h after single intravenous administration, which was faster than that after single oral administration. In addition, the areas under the plasma concentration-time curve (AUC) of PSS were calculated to be 89.41 ± 17.43 (h μg mL-1) and 532.63 ±326.28 (h μg mL-1) after oral and intravenous administration. The absolute bioavailability of F-PSS calculated by area under concentration-time curve (AUC0–∞) was 8.39%, whichshowed that the oral absorption of PSS was poor. Moreover, according to the preliminary metabolic experimental results, the mean cumulative amounts of F-PSS excreted in urine were 0.605% and 8.297% up to 72 h after oral and intravenous administration, respectively, while the mean cumulative amounts of F-PSS excreted in feces were 36.931% and 5.035% up to 72 h after oral and intravenous administration, respectively. These results indicated that the major metabolic pathways of F-PSS were biliary excretion after oral administration and renal excretion after intravenous injection. The above results showed that the fluorescence labeling method is sensitive, rapid and applicable to the pharmacokinetic study of polysaccharides.
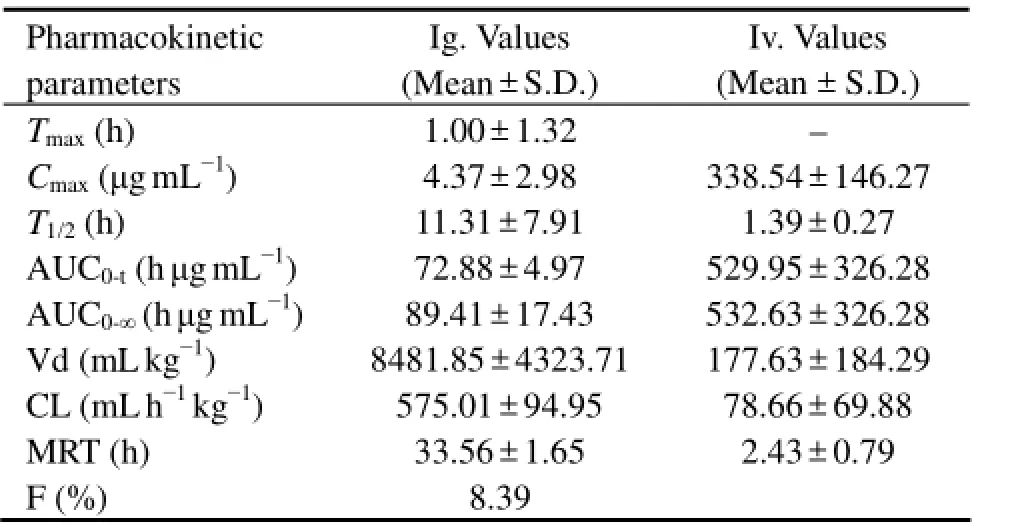
Table 4 Mean pharmacokinetic parameters of F-PSS in rats plasma after single oral and intravenous administration (n = 7)
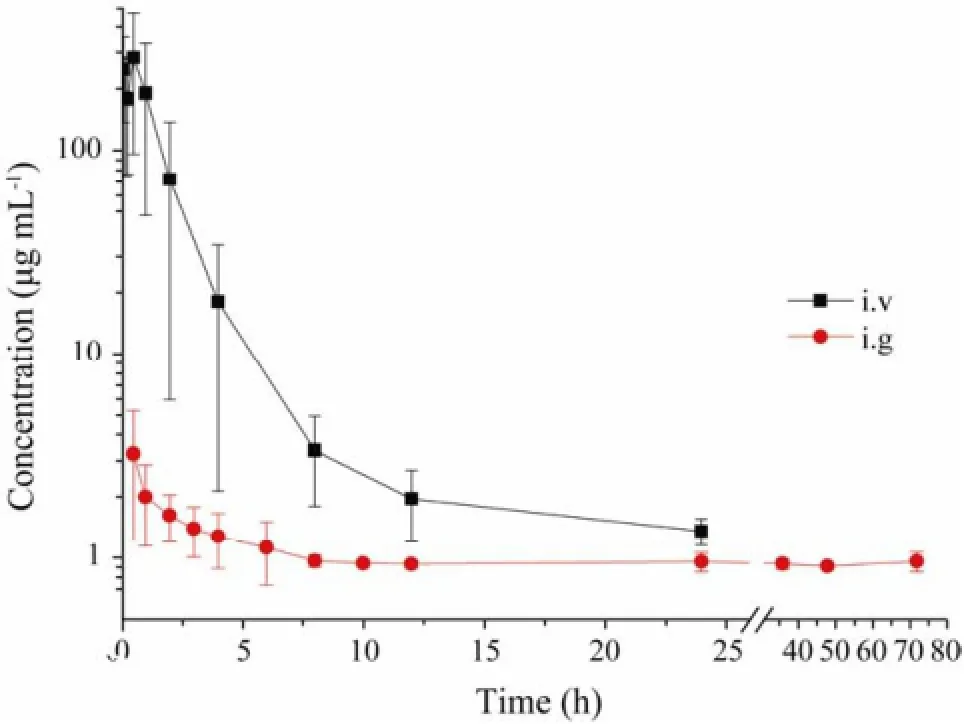
Fig.6 Mean plasma concentration-time profile of F-PSS after oral and intravenous administration. Data were expressed as mean ± sd (n = 7).
4 Conclusions
In this study, 1,6-diaminohexane was proved to be a good linker between PSS and FITC, and the FITC-labeled PSS was prepared successfully. This fluorescence labeling method was successfully applied to quantifying PSS in plasma after oral and intravenous administration to rats. This method can be used in the pharmacokinetic studies of PSS. This validated method can also be applied to studying the absorption and bioavailability of PSS and other polysaccharides during their pre-clinical studies.
Acknowledgements
This research was supported in part by programs of Qingdao Science and Technology Project (11-2-3-73-jh), Shandong Science and Technology Project (2011GSF 11815) and Special Fund for Marine Scientific Research in the Public Interest (201005024). The authors are grateful to Wei Wang and Shixin Wang of OUC for their supports of cell stability and cytotoxicity tests.
Ambler, L., and Hudson, A. M., 1984. Pharmacokinetics and metabolism of muramyl dipeptide and nor-muramyl dipeptide [3H-labelled] in the mouse. International Journal of Immunopharmacology, 6: 133-139.
Arira, O., Kimiyo, M., Hideki, U., and Kinzo, N., 1982. Preparation and properties of fluorescent glycosamino-glycuronans labeled with 5-aminofluorescein. Carbohydrate Research, 105 (1): 69-85.
Bikova, T., and Treimanis, A., 2004. UV-absorbance of oxidized xylan and monocarboxyl cellulose in alkaline solutions. Carbohydrate Polymer, 55: 315-322.
Bennett, C. F., Zuckerman, J. E., Kornbrust, D., Sasmor, H., Leeds, J. M., and Crooke, S. T., 1996. Pharmacokinetics in mice of a [3H]-labeled phosphorothioate oligonucleotide formulated in the presence and absence of a cationic lipid. Journal of Controlled Release, 41: 21-27.
D’Ambra, A. J., Baugher, J. E., Concannon, P. E., Robert, A. P., and Francis, M., 1997. Direct and indirect methods for Molar-Mass analysis of fragments of the capsular polysaccharide of Haemophilus inf l uenzae Type b. Analytical Biochemistry, 250: 228-236.
De Haas, C. J. C., van Leeuwen, H. J., Verhoef, J., van Kessel, K. P. M., and van Strijp, J. A. G., 2000. Analysis of lipopolysaccharide (LPS)-binding characteristics of serum components using gel filtration of FITC-labeled LPS. Journal of Immunology Methods, 79: 242-246.
Guan, H. S., 1999. Study on the new drug Polysaccharide sulfate sodium. Medical Research, 28: 8-9.
Houle, W., Kheng, B. L., Ross, F. L., William, N. H., Alex, T. J., Lowell, H. E., Kenneth, A. W., and Murray, H., 1997. Stability enhancement for peptide analysis by electrospray using the Triple Quadrupole Mass spectrometer. Analytical Biochemistry, 250: 162-168.
Hackler, R., Arndt, T., Tilmann, O. K., and Axel, M. G., 1995. Effect of separation conditions on automated isoelectric focusing of carbohydrate-deficient transferrin and other human isotransferrins using the phast system. Anaytical Biochemistry, 230: 281-289.
Han, Y. H., Lv, Z. H., Jiang, T. F., and Wang, Y. H., 2007. Bioanalysis and pharmacokinetics of chitosan ester in rabbit serum by HPLC with postcolumn fluorescence derivatization. Journal of Chromatography B, 138: 845-849.
He, X. X., Hu, C., Guo, Q., Wang, K. M., Li, Y. H., Shangguan, J. F., 2013. Rapid and ultrasensitive Salmonella Typhimurium quantif i cation using positive dielectrophoresis driven on-line enrichment and fl uorescent nanoparticles label. Biosensors and Bioelectronics, 42: 460-466.
Ishizuka, I., 1997. Chemistry and functional distribution of sulfoglycolipids. Progress in Lipid Research, 36: 245-252.
Kristoffer, T., Sabina, P. S., Tian, W., Lennart, K., and Kjell, M. V., 2001. Preparation and characterisation of fluorescent chitosans using 9-anthraldehyde as fluorophore. Carbohydrate Research, 336 (4): 291-296.
Liu, Z., Jiang, G., Yi, M., and Che, L., 1990. Pharmacokinetics study on alginic sodium diester. Journal of Beijing Normal University (Natural Science), 27: 231-233.
Li, F. C., Geng, M. Y., and Li, Y. X., 2002. Fluorescent labeling study of marine sulfated polysaccharide 911. Chemistry Journal of Chinese Universities, 23: 1704-1708.
Volpi, N., 2000. Hyaluronic acid and chondroitin sulfate unsaturated disaccharides analysis by high-performance liquid chromatography and fluorimetric detection with dansylhydrazine. Analytical Biochemistry, 277: 19-24.
Paltauf, F., and Hermetter, A., 1994. Strategies for the synthesis of glycerophospholipids. Progress in Lipid Research, 33:239-245.
Piron, E., and Domard, A., 1998. Interaction between chitosan and uranyl ions. Part 2. Mechanism of interaction. International Journal of Biological Macromolecules, 22: 33-40.
Ren, J. T., Wang, J. H., Wang, J., Luedtked, N. W., and Wang, E. K., 2012. Enantioselective and label-free detection of oligopep- tide via fl uorescent indicator displacement. Biosensors and Bioelectronics, 35: 401-406.
Stephan, B., and Richard, W. C., 1997. Long-term effects of UV and visible irradiance on natural populations of a scytonemincontaining cyanobacterium (Calothrix sp.). Fems Microbiology Ecology, 24: 343-352.
Takai, H., Kato, A., Nakamura, T., Tachibana, T., Sakurai, T., Nanami, M., and Suzuki, M., 2011. The importance of characterization of FITC-labeled antibodies used in tissue cross-reactivity studies. Acta Histochemistry, 113: 472-479.
Trubetskoy, V. S., Koshkina, N. V., Omel’Yanenko, V. G., L’Vov, V. L., Dmitriev, B. A., Petrov, A. B., and Torchilin, V. P., 1990. FITC-labeled lipopolysaccharide: Use as a probe for liposomal membrane incorporation studies. FEBS Letters, 79: 269-276.
Tao, L., Song, C. J., Sun, Y. J., Li, X. H., Li, Y. Y., Jin, B. Q., Zhang, Z. J., and Yang, K., 2013. A fl uorescent and chemiluminescent difunctional mesoporous silica nanoparticle as a label for the ultrasensitive detection of cancer cells. Analytica Chimica Acta, 761: 194-200.
Tang, H. L., Chen, T., Wang, Y., Ying, H. P., and Wang, M., 2010. Fluorescent substance labeling of cordyceps polysaccharide. Pharmaceutical and Clinical Research, 18 (3): 279-281.
Van der Sluijs, P., Oosting, R., Weitering, J. G., Hardonk, M. J., and Meijer, D. K. F., 1985. Biliary excretion of FITC metabolites after administration of FITC labeled asialo orosomucoid as a measure of lysosomal proteolysis. Biochemistry Pharmacology, 34: 1399-1407.
(Edited by Qiu Yantao)
(Received January 10, 2013; revised April 24, 2013; accepted April 3, 2014)
© Ocean University of China, Science Press and Spring-Verlag Berlin Heidelberg 2014
∗ Corresponding author. Tel: 0086-532-82032030
E-mail: lchunxia@ouc.edu.cn
杂志排行

Journal of Ocean University of China的其它文章
- Construction of Inorganic Elemental Fingerprint and Multivariate Statistical Analysis of Marine Traditional Chinese Medicine Meretricis concha from Rushan Bay
- A Comparative Study of Intensive Litopenaeus vannamei Culture on Four Bottom Substrates Without Water Change
- Characterization, Expression and Function Analysis of DAX1 Gene of Scallop (Chlamys farreri Jones and Preston 1904) During Its Gametogenesis
- Secondary Metabolites of a Deep Sea Derived Fungus Aspergillus versicolor CXCTD-06-6a and Their Bioactivity
- Early Development of Silvetia babingtonii (Fucales, Phaeophyceae)
- A Comparison of Different Gracilariopsis lemaneiformis (Rhodophyta) Parts in Biochemical Characteristics, Protoplast Formation and Regeneration