A measurement system for YTO
2013-12-20YANZhenLIUWei
YAN Zhen (颜 振), LIU Wei (刘 伟)
(Science and Technology on Electronic Test & Measurement Laboratory, Qingdao 266555, China)
A measurement system for YTO
YAN Zhen (颜 振), LIU Wei (刘 伟)
(Science and Technology on Electronic Test & Measurement Laboratory, Qingdao 266555, China)
Yttrium iron garnet(YIG) tuned oscillator (YTO), which is widely used in signal source, is difficult to be measured manually for its numerous parameters. In order to accomplish the measurement of YTO quickly and automatically, this paper gives the design of an auto-measurement system based on genernal purpose interface bus (GPIB).
measurement system; YIG-tuned oscillator(YTO)
CLD number: TM934 Document code: A
Yttrium iron garnet (YIG) tuned oscillator (YTO) consists of a YIG sphere mounted on a rob that is positioned inside of a magnetic field. It has been widely used to produce microwave signal from direct current and play an important part in microwave field. Based on YIG sphere's characteristics[1], YTO has the advantages of broad bandwidth, low noise, high linearity and so on[2]. As the key module of signal source, the measuring precision of YTO will affect the precision of signal source directly.
YTO is a module with simple function and many parameters. For this reason, manual measurement for YTO needs many kinds of equipments that are connected to YTO at least one time, which leads to higher error and more waste of time. In this situation, YTO auto-measurement system should be designed.
To meet the requirements of measuring parameters which are power, power smooth, harmonic, phase noise, frequency drift performance with temperature, 3 dB bandwidth, hysteresis, main sensitive and tuning sensitive, tuning linearity, the system should be designed to achiveve the following functions.
1) It can measure three kinds of YTOs with different sensitivities of 20, 40 and 60 MHz/mA.
2) The modes of the system can be set as sweep mode and point mode, and start frequency and stop frequency can be set in sweep mode.
3) To measure the phase noise of YTO, the system should have phase-locked loop, and phase noise of phase-locked loop should be better than that of normal equipment for 5-10 dB.
4) YTO can be connected to power meter, oscilloscope and frequency spectrometer at the same time.
5) The measurement system can be controlled by a computer.
1 System design
1.1 Facility description
The YTO measurement system is shown in Fig.1. The main equipment contains spectrometer, power meter, function generator, oscilloscope, YTO platform and computer.

Fig.1 YTO measurement system photograph
The YTO platform controlls the DC electricity and phase-locked loop. The microwave that YTO sends out is controlled by the input current from YTO platform. YTO parameters could be calculated according to the current that is read out from general purpose interface bus (GPIB) and the data that is got from power meter, oscilloscope and frequency spectrometer.
The facility description of the system is shown in Fig.2. In this system, the frequency spectrometer (AgilentE4448A) whose frequency ranges from 3 Hz to 51 GHz is used to measure parameters which are hysteresis, phase noise, frequency drift performance with temperature, 3 dB bandwidth, hysteresis, main sensitive, tuning sensitive, tuning linearity. Power meter AV2436 is used to measure parameters which are power, power smooth. Function generator AFG3021 is used to measure parameter which is 3 dB bandwidth. Oscilloscope TDS1012C is used to test parameters if there are unworking points or power fluctuation points. YIG platform AV1335 is remanufactured from signal source AV1461. It is used to control the DC electricity and phase-locked loop. Computer is used to control the measurement system. Directional coupler and mixer are used for the connection when testing 3 dB bandwidth.

Fig.2 Facility description of YTO measurement system
1.2 System software design
The measuring steps are as follows. After connecting all the equipments with YTO, opening all the equipments and the software on the computer, system automatically begins to test if there is any error in the system. On the screen, there will be a list showing all the parameters need to be measured, which are power, power smooth, hysteresis, phase noise, frequency drift performance with temperature, 3 dB bandwidth, hysteresis, main sensitive, tuning sensitive and tuning linearity. The user can choose which parameter should be measured. After choosing the type of YTO, there will be a self-test on YTO to match the electricity and frequency, then the system will measure the parameters that the user chooses automatically and save the results. The software flow chart is shown in Fig.3.

Fig.3 Software flow chart of YTO measurement system
The system software is shown in Fig.4, consisting of two parts: the setting part and the measuring part. The software is compiled with C# in Windows XP operating system.

Fig.4 System software
2 Measurement method of YTO parameters
The YTO measurement system measures the parameters, including power, power smooth, hysteresis, phase noise[3], frequency drift performance with temperature, 3 dB bandwidth, hysteresis, main sensitive, tuning sensitive, tuning linearity. The measurement progress and results of some main parameters are as follows.
1) Harmonic
Harmonic measurement contains the measurement of harmonic level and spurious level. The harmonic level is the electrical level between the fundamental harmonic and the second harmonic, and measurement unit is -dBc. The measurement method is as follows. Set span on frequency spectrometer as full span, and put marker on the maximum value point and sub-maximum value point on frequency spectrometer. The harmonic level is the difference between them. The spurious level is the electrical level between the unwanted signal and useful signal, and measurement unit is -dBc or -dBm. The measurement method is as follows. Set center frequency on frequency spectrometer at signal frequency, set a fit span, for example, 500 kHz and put marker on the sub-maximum value point. The spurious level is its value.
2) Frequency drift performance with temperature
Frequency drift performance with temperature is the frequency drift resulting from change of temperature. The temperature will affect the situation of resonance circuit, component and load, which are related to the frequency. Set center frequency on frequency spectrometer at the middle working frequency, set span on frequency spectrometer at 200 MHz, turn on HTR heater to run for 20 s and record the frequency shift.
3) 3 dB bandwidth
The low pass tuning bandwidth of oscillator is 3 dB bandwidth. It is equal to the difference between the frequencies of which power is half of the maximum power. Set YTO platform as follows. Set point frequency mode, frequency at 5 GHz, power at 0 dBm; Set frequency modulation mode, frequency modulation input at 15 MHz, frequency offset at 1 MHz, bandwidth as alternating current; Open frequency modulating switch, modulating switch and radio frequency switch; Trim frequency until voltmeter showing DC volt at 0±10 mV; Switch the output of mixer to frequency spectrometer. Set function generator as follows: Set waveform as sine wave, frequency at 1 kHz, volt at 2 V peak to peak, DC offset at 0 V, start frequency at 100 kHz, stop frequency at 15 MHz; Set weep mode, sweep time at 20 s; Open output switch; Set appropriate span and reference power level for frequency spectrometer, then measure and record 3 dB bandwidth of input signal.
4) YIG sphere
YIG sphere is set in a magnetic field, which refers to the electricity. There is hysteresis between the frequency and electricity[4]. It is shown as frequency-electricity hysteresis curve. The hysteresis curve of a YTO is shown in Fig.5. The left figure shows the relationship between electricity and frequency, and the right figure which shows the hysteresis curve more clearly is the calculated result that equals the result of the hysteresis curve subtracting the best-fitting straight line. The measurement method is as follows. Turn up the electricity of YTO from start frequency slowly until stop frequency. Record the electricity at middle frequency. Then turn down the electricity slowly to the recorded electricity, record the frequency. The hysteresis is the difference between the recorded frequency and middle frequency.
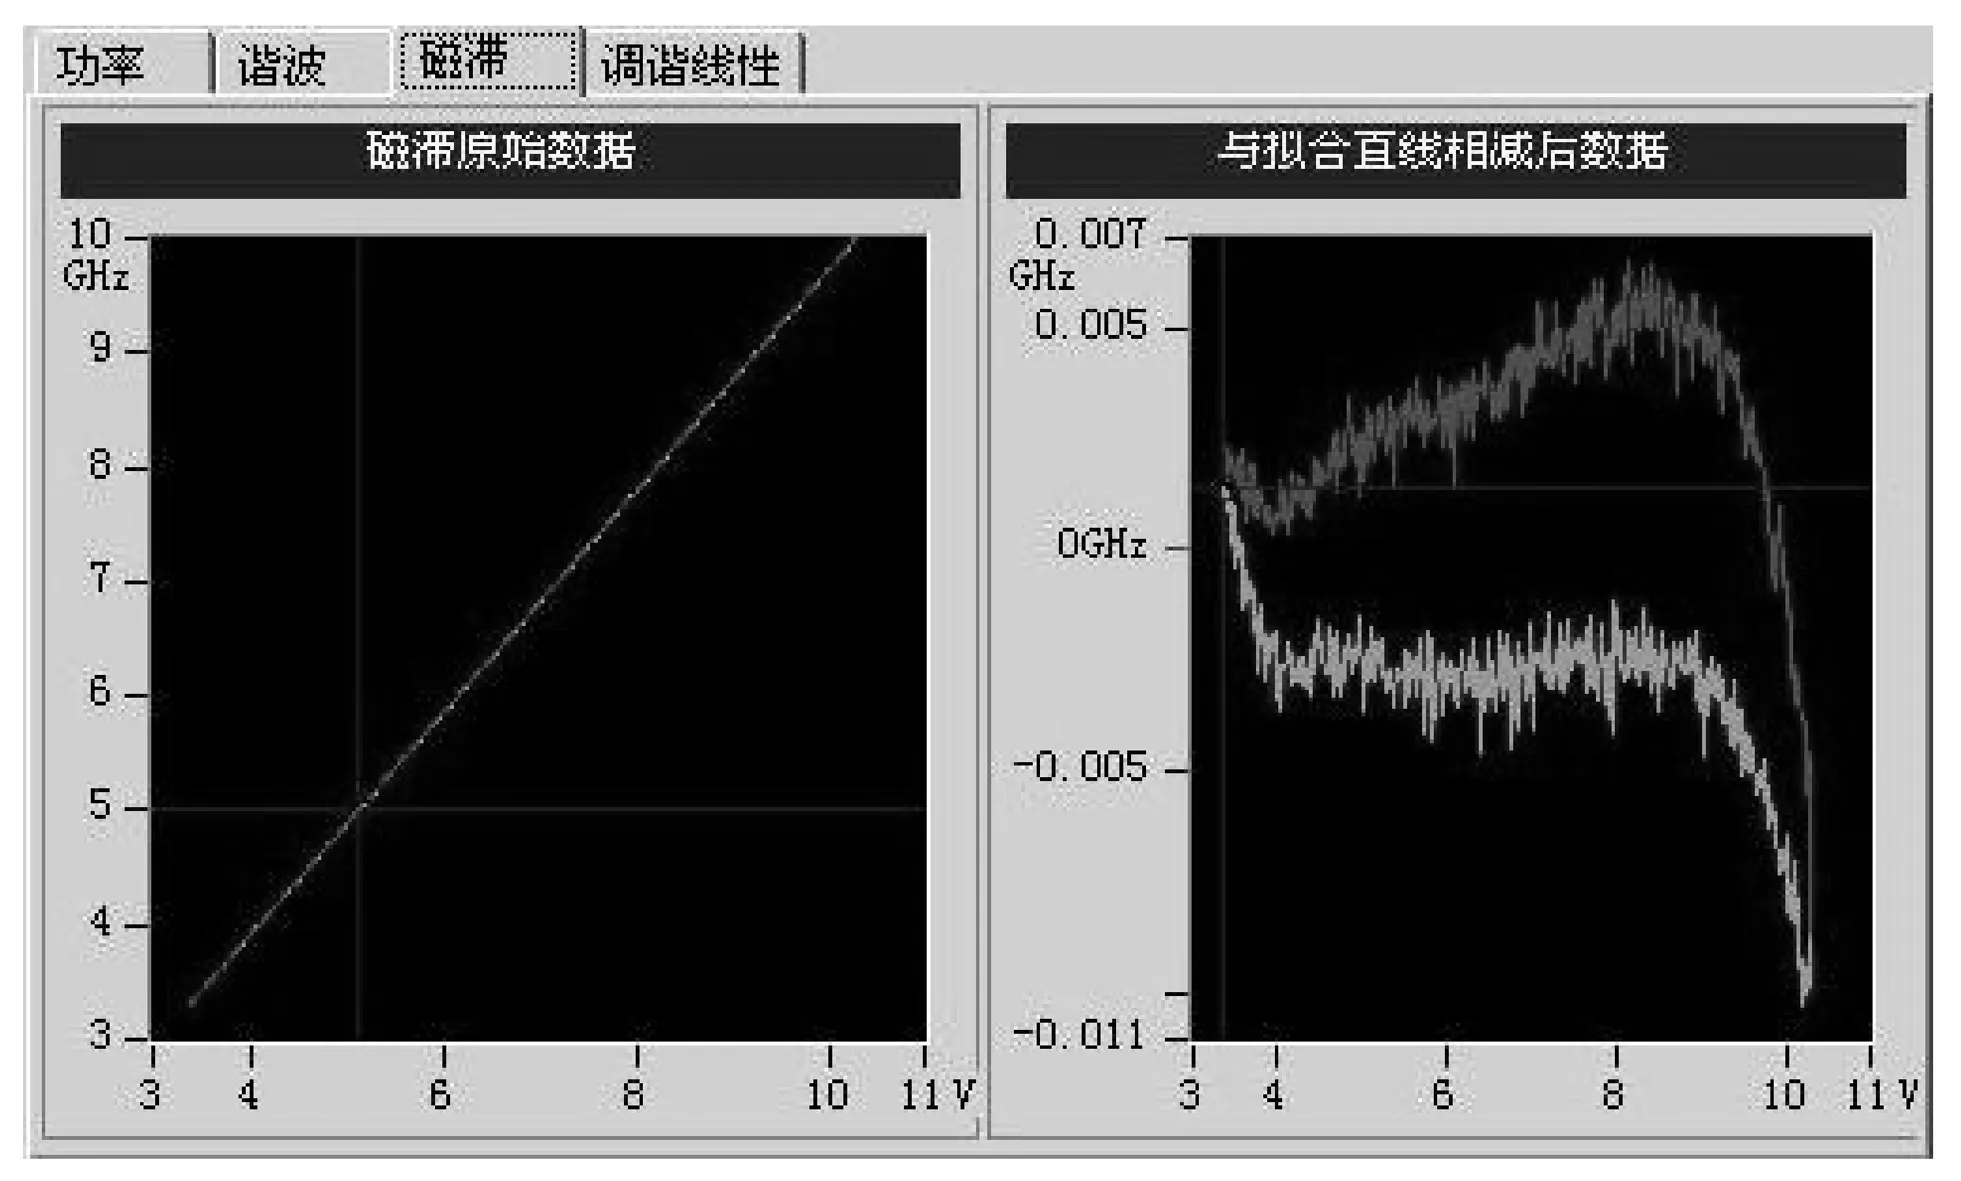
Fig.5 Hysteresis curve of a YTO from 3 GHz to 10 GHz
5) Tuning sensitivity
Tuning sensitivity is equal to the result of the difference of frequency dividing the difference of electricity in a small frequency range[5]. As there are a main coil and secondary coil in the YTO, the secondary coil is used for the small changes of frequency. Set frequency of YTO platform at middle frequency, record the electricity of YTO. Set middle frequency at center frequency on frequency-spectrometer, set span of frequency spectrometer at 100 MHz. Turn up the frequency a little, measure the electricity of YTO. The tuning sensitivity is the result of the difference of frequencies that divides the difference of the values of electricity.
6) Tuning linearity
Tuning linearity is the linearity of the frequency electricity line. The measurement method is as follows. Read the electricity from YTO platform and get the frequency of these points from frequency spectrometer, then there will be a curve that fits those points. Find the best-fitting straight line of the curve with least square method, and tuning linearity is the maximum difference between the two lines. Fig.6 shows the linearity of a YTO.

Fig.6 Tuning linearity of a YTO from 3 GHz to 10 GHz
The relationship between electricity and frequency is shown in the left figure. The right figure shows
the tuning linearity which is equal to the result of the frequency difference between the original line and the best-fitting straight line dividing the frequency of the fitting straight line.
7) Main system parameters
System parameters determine the system test capability. The main system parameters are listed as follows:
* Phase-locked frequency range: 3-10 GHz.
* SSB phase noise: -120 dBc/Hz at 100 kHz.
* Frequency resolution: 1 kHz.
* Phase-locked tuning sensitivity: 20±2; 41±3; 60±5 MHz/mA.
3 Conclusion
Compared with the manual measurement, this YTO measurement system has the characteristics of high efficiency, simple operation, high stability and multi-parameter auto-measurement. The measurement system meets the needs of YTO batch testing.
[1] Ohgihara T, Murakami Y, Mizunuma Y, et al. YIG tuned oscillator: European Patent No. EP0320825. [1989-06-21]. http://worldwide.espacenet.com/publicationDetails/biblio?CC=EP'NR=0320825A2&KC=A2&FT=D.
[2] Khanna A P S, Buenrostro J. 2-22GHz low phase noise silicon bipolar YIG tuned oscillator using composite feedback. In: Proceedings of IEEE International Microwave Symposium Digest, 1992: 1297-1299.
[3] Bryerton E W, Thacker D L, Saini K S, et al. Noise measurements of YIG-tuned oscillator sources for the Alma Lo. Alma Memo No.311, Nrao, Charlottesville, Virginia, USA, 2001: 57-59.
[4] Osbrink N K. YIG-tuned oscillator fundamentals. Microwave System News, 1983, 13: 207-225.
[5] LIU Na, LIU Sheng, DU Nian-wen. Characteristics of switching speed in YTO-oscillator generator. Chinese Journal of Scientific Instrument, 2009, 30(6): 311-314.
date: 2013-08-04
YAN Zhen (eiqd@ei41.com)
1674-8042(2013)04-0335-04
10.3969/j.issn.1674-8042.2013.04.007
杂志排行
Journal of Measurement Science and Instrumentation的其它文章
- A 4-layer method of developing integrated sensor systems with LabVIEW
- Calibration and compensation methods of installation error of electronic compass
- Design of shared bus DSP board in vector network analyzer
- Error modeling and analysis of inclinometer based on digital accelerometer
- Analysis of condition monitoring methods for electromotor on oil platform
- U disk recorder based on CH376 and ATmega 128