A 4-layer method of developing integrated sensor systems with LabVIEW
2013-12-20BAIJianghua白江华CHENJingwei陈静薇JohnFreeoufAndresLaRosa
BAI Jiang-hua (白江华), CHEN Jing-wei (陈静薇), John Freeouf, Andres La Rosa
(1. Tan Kah Kee College, Xiamen University, Xiamen 363105, China; 2. Department of Physics, Portland State University, Portland 751, USA)
A 4-layer method of developing integrated sensor systems with LabVIEW
BAI Jiang-hua (白江华)1, CHEN Jing-wei (陈静薇)1, John Freeouf2, Andres La Rosa2
(1. Tan Kah Kee College, Xiamen University, Xiamen 363105, China; 2. Department of Physics, Portland State University, Portland 751, USA)
System integrity is important for fast and accurate measurement and control. LabVIEW is widely used in education and industry. Many LabVIEW codes are hard to be read and shown because of their 2D topology. In order to simplify the programming, a 4-layer model of developing sensor or measurement systems with LabVIEW is proposed in this paper. The purpose of this paper is to show the readers how to design simple, clear and strong automated systems with LabVIEW. Using a Sensirion SHT75 humidity sensor and an NI USB6008 DAQ board as an example, this paper describes the steps of developing a sensor system from the physical layer to application layer in detail. In layer 2, port selection and signal regulation are demonstrated. In layer 3, timing waveform analysis and synthesis, state diagram analysis, instruction set design, micro operation and fault tolerance designs are demonstrated. In layer 4, data visualization is covered with a vivid example. Programmers found it was hard to show readers their LabVIEW codes because many LabVIEW codes occupy several screens. A layer model simplifies the programming, so one is able to show a medium size LabVIEW code easily.
LabVIEW; sensor system; layer model; automatic system
CLD number: TP27 Document code: A
0 Introduction
LabVIEW has a relatively shallow learning curve, and it has been accepted by many engineers and scientists. LabVIEW codes are not as compact as letter based programming languages, such as C[1-4]. The views of LabVIEW codes are messy patterns and wires, thus they are not easy to be displayed on monitors[5-6]. One effective solution is to use SubVIs to make structural programs[7-8]. Here we propose a 4 layer model to write LabVIEW programs and use a SHT75 sensor system to show how to divide and program each layer. Readers can follow the methods used in this paper to develop other similar automated measurement and control systems[7]. Some digital sensors, like SHT75, have a timing waveform showing their interface and functionality[9]. In order to put this kind of sensor into a LabVIEW controlled system, users need to start from the physical layer, such as hardware connection and pinout signal controls. Then, users also need to make a state diagram of the sensor controller, from which the LabVIEW code can be developed. The sensor may be used in an even bigger system, so high level abstraction and structural programming are also important; among these the essential part is to make an instruction set and realize each instruction with micro operations. All these will be elaborated by a Sensirion SHT75 sensor system. It is appropriate to divide the system into 4 layers. The application layer can be any heat controller, relay controller or air flow controller that will be controlled by the humidity and temperature value read from the sensor. The instruction set layer is a set of commands that correspond to the functions of the sensor. Each instruction has a lot of micro operations that meet the timing waveform of sensor and the state diagram of the controller. The interface layer contains both hardware and software, such as the data acquisition board and the subroutine which controls the signal level and direction (input or output) and timing of each pin. The physical layer is a cluster of digital or analog sensors. The layer model is shown in Fig.1.
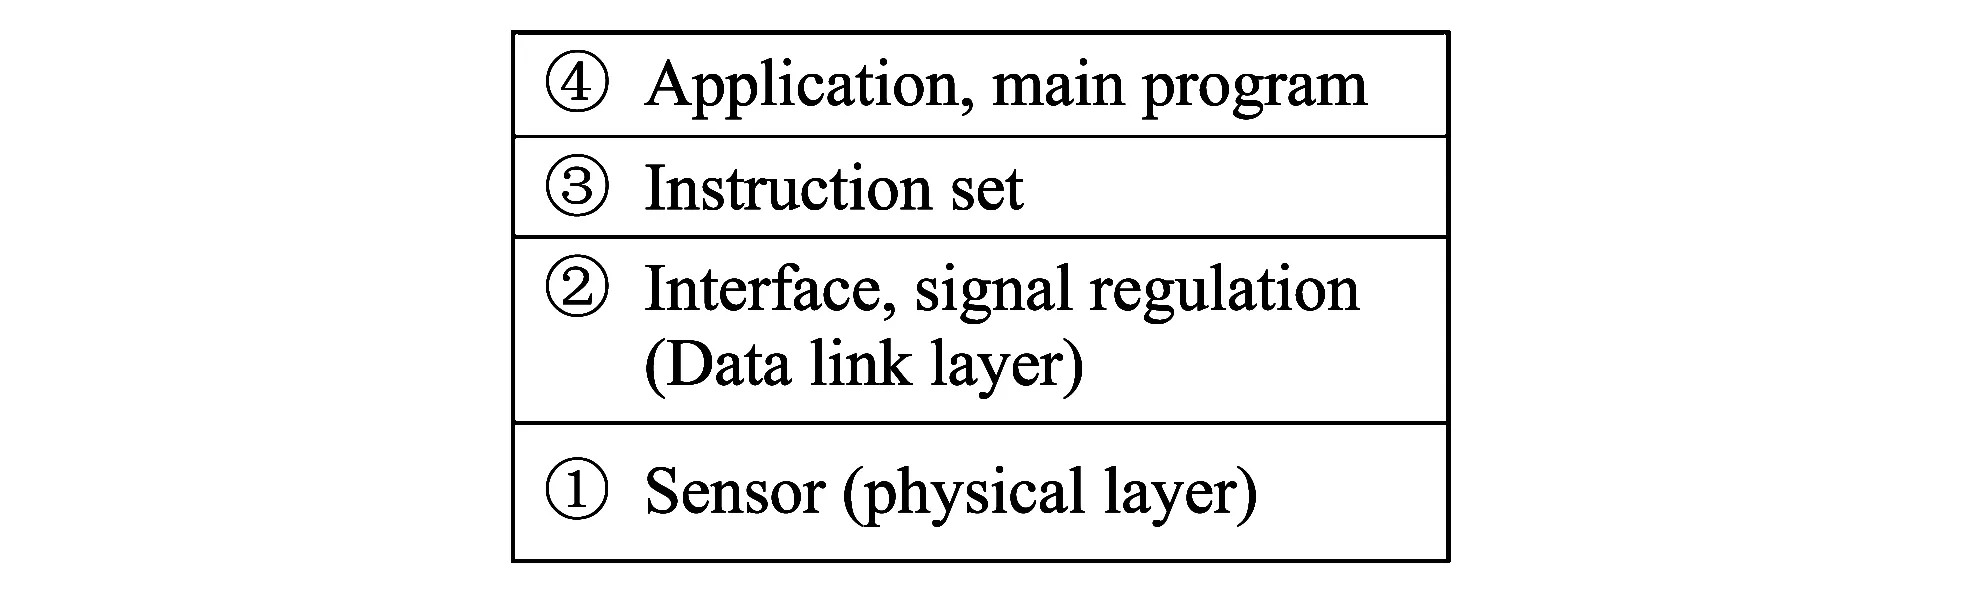
Fig.1 Layer model of a sensor system
1 Hardware connection (layer 1)
A fast, accurate and automatic temperature (TM) and relative humidity (RH) measuring system is useful in scientific instruments and industry. A low level microcontroller powered SHT7x TM and RH meter has many drawbacks. Some typical drawbacks are manual data recording, difficulty to integrate with an automatic control system and difficulty in transferring data at long distance.
This design shows how to use an NI USB6008 DAQ[10]to interface with the SENSIRION SHT75 sensor and drive the sensor by LabVIEW. Fig.2 shows the hardware connection of sensor system.
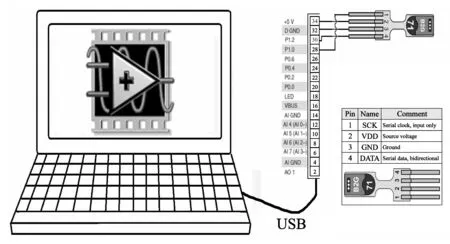
Fig.2 A simple illustration of hardware connection
2 Design of the main controller
A section of SENSIRION SHT75[9]timing waveform is shown in Fig.3. According to the signal level and timing, a state diagram of the controller can be derived as shown in Fig.4. The controller transits from Idle to Start states automatically. If the connection is reset, the controller resets the interface and then transits to Start. Then the controller is ready to receive instructions. If the instruction is True, the controller transits to Measure RH state. If there is no error, the controller transits to Wait state. Otherwise, it jumps back to Start. After the measurement is done, the controller transits to Read data state. After the data are read correctly from the sensor, the controller transits to Save & Display state and Idle state. The Idle, Reset, Start and Measure RH and Measure Temp states implemented by RH-TM subroutine (layer 3). The Wait state is implemented at the application (layer 4). The Read data state is implemented by DAQ2 subroutine (layer 3). The Save & Display state is implemented in the application layer (layer 4).
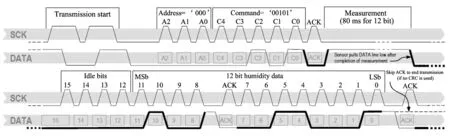
Fig.3 Section of SHT75 timing waveform
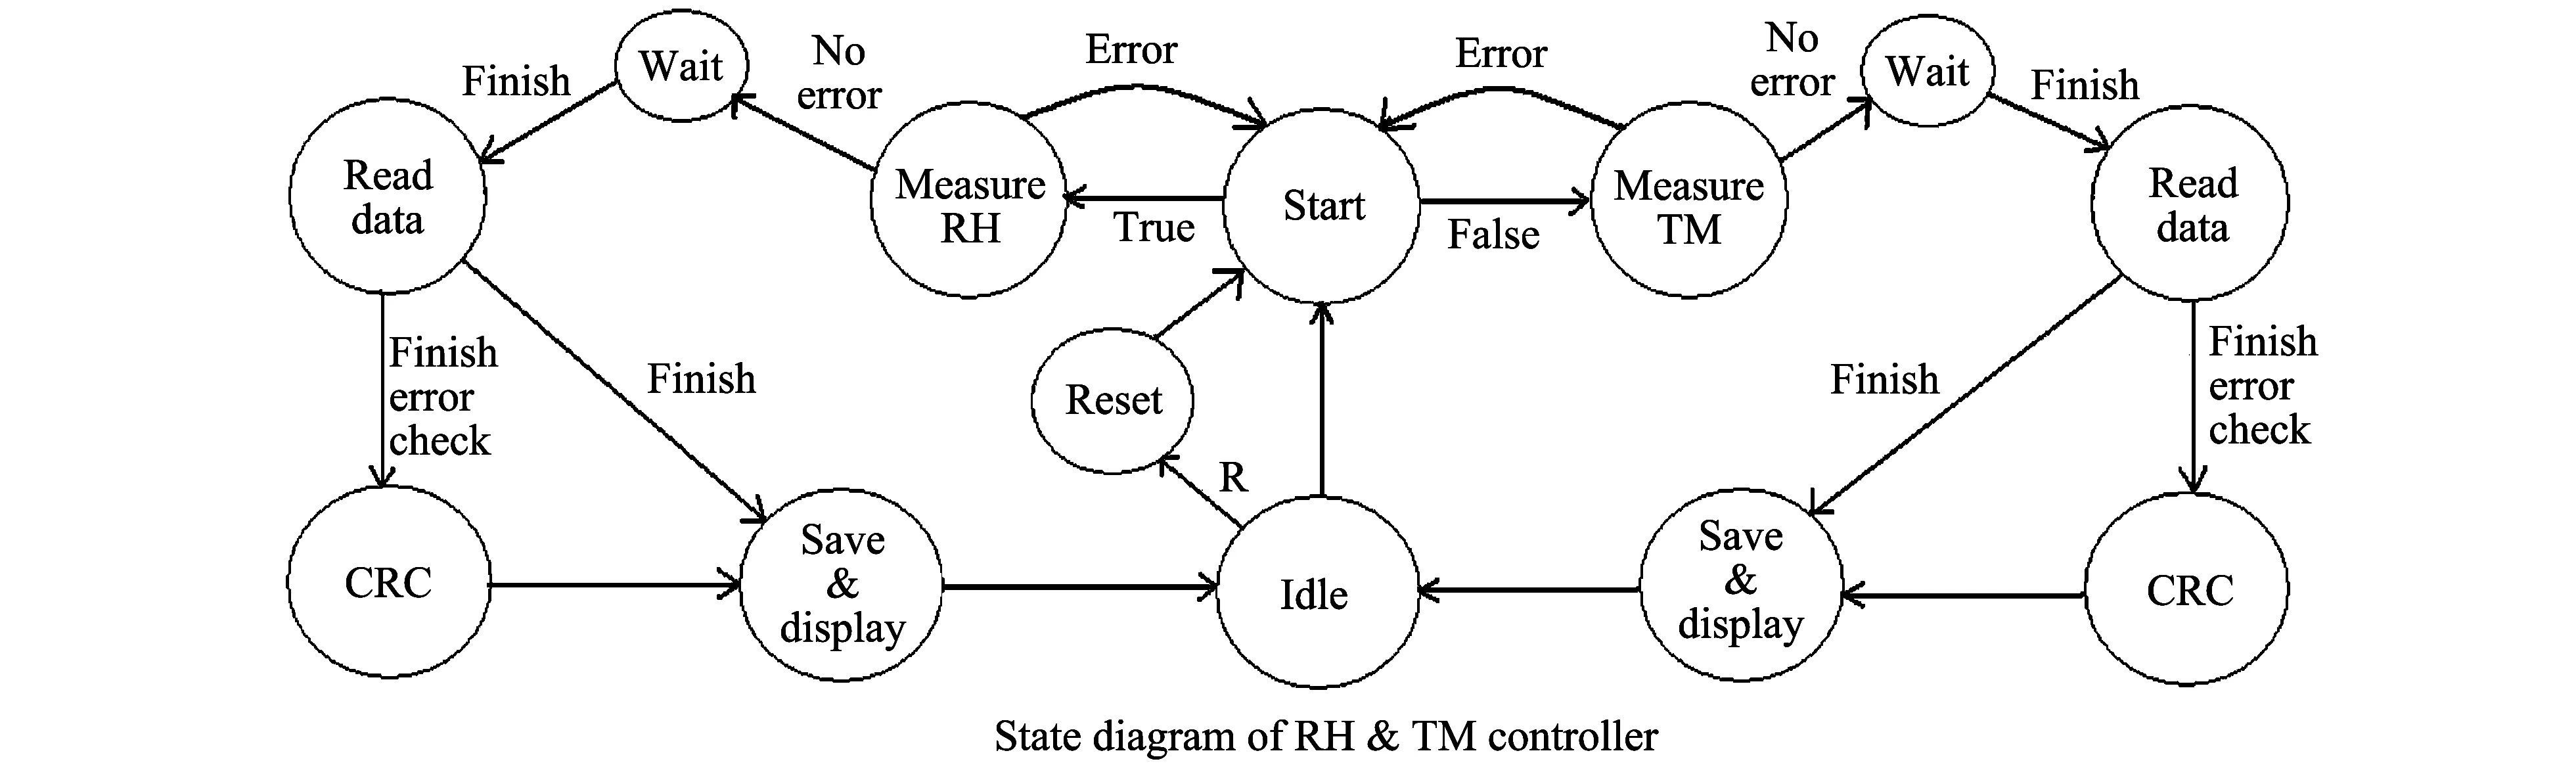
Fig.4 A complete state diagram of RH & TM controller
LabVIEW is a graphic programming language, so it is easy to design the controller top down. Starting from the timing waveform, generating a state diagram and translating the state diagram into LabVIEW codes, one can develop a sensor controller systematically. The LabVIEW code of the main application (layer 4) is shown in Fig.5. The PIN subroutine (layer 2) encapsulates the hardware connection. The RH-TM subroutine (layer 3) receives instructions and executes the instructions by a series of micro operations following the state diagram and the timing waveform. The DAQ2 (layer 3) subroutine reads the data from the sensor and converts them into decimal numbers.
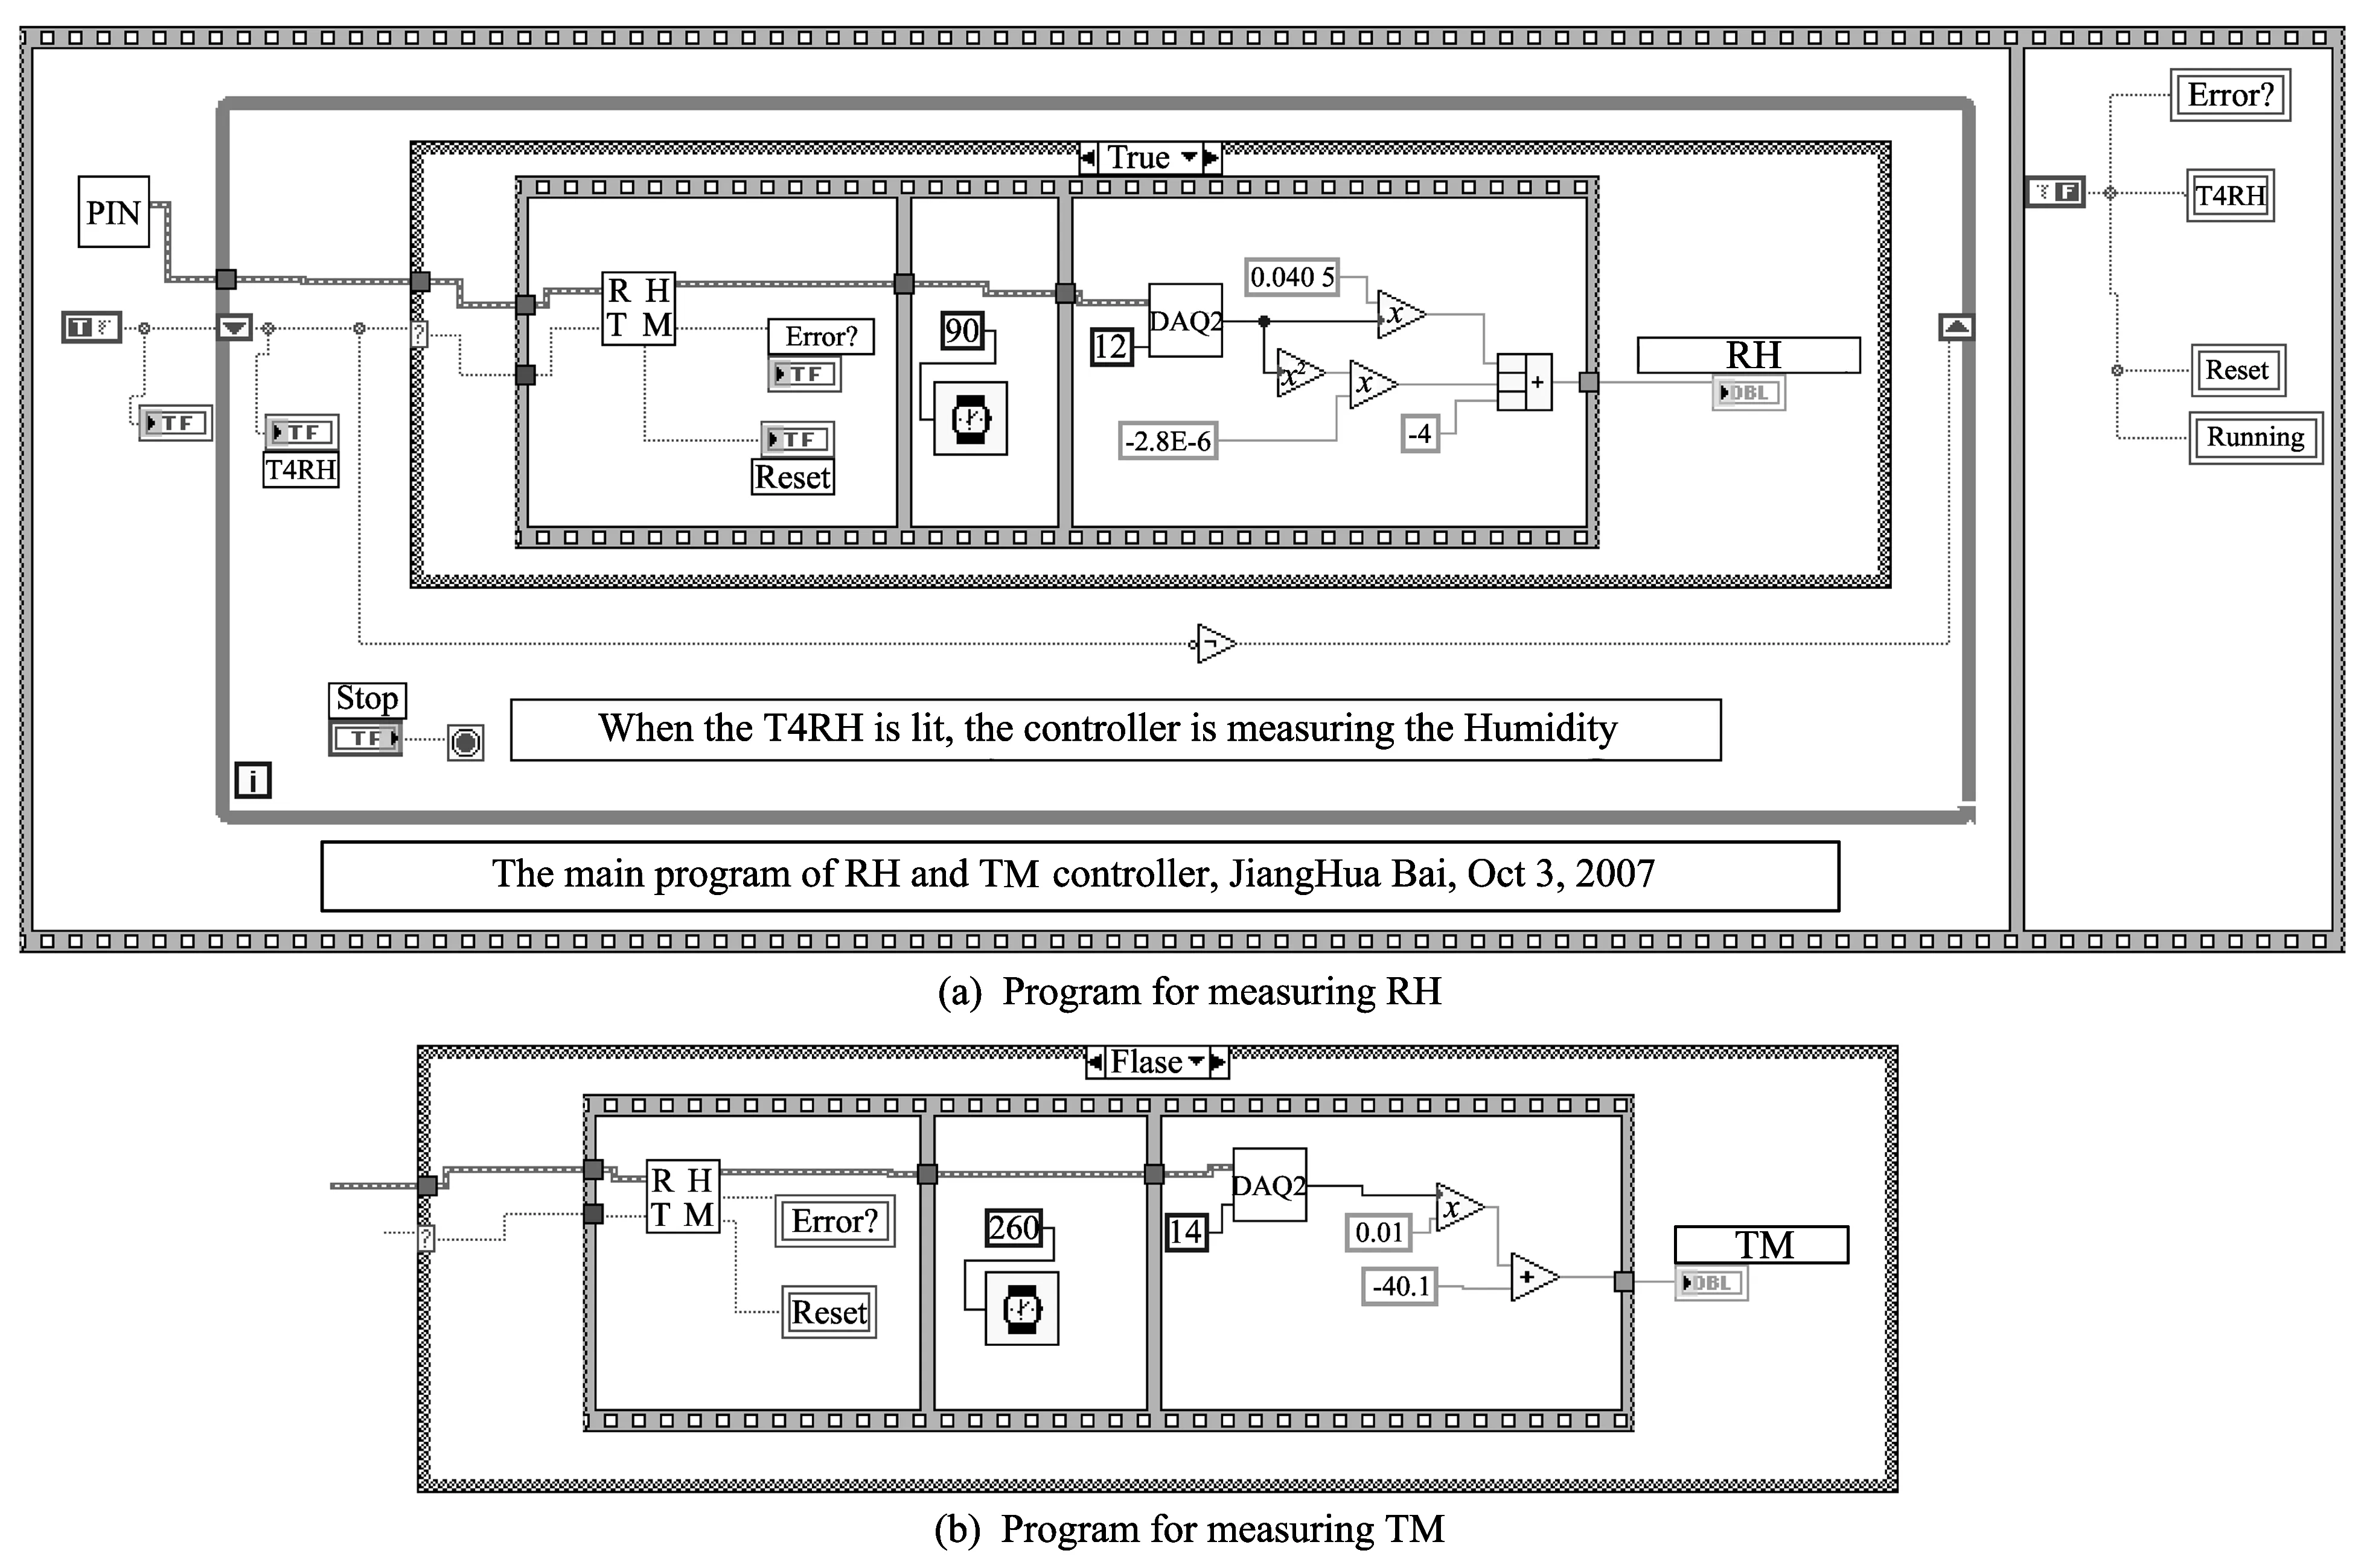
Fig.5 Main program of SHT75 driver
The PIN subroutine (layer 2) configures the DAQ ports connected to the sensor. The output of the PIN subroutine is a bus of SCK, DATA_IN and DATA_OUT signals, which are used by following subroutines to communicate with the SHT75 sensor. The RH-TM subroutine has an instruction input port, a bus input port and a bus output port. The input port is used to send out TM and RH measuring instructions. When the instruction is True, the system will measure RH. When the instruction is False, the system will measure the TM.
After the instructions are sent out correctly, the controller enters a Wait state. Then SHT75 sensor needs roughly 80 ms to measure the RH and 240 ms to measure TM. After the measurement, the DAQ2 subroutine will be triggered. The DAQ2 subroutine has a bus input port, a word length input port and a data output port.
The word length port is used to define the effective data bits. For RH measurement the word length is 12 bit, while for TM measurement the word length is 14 bit. The output of DAQ2 is used to compute the RH and TM values, according to several formulas provided by the manufacture. The details are covered in the sensor specification file[9].
3 PIN subroutine (layer 2)
As shown in Fig.2, the SHT75 sensor is connected to some ports of USB6008 DAQ box. The PIN subroutine is used to define the signal level, direction and encoding the types of these ports. The PIN subroutine greatly simplifies the programming and maintenance of the software. When users select a different interface to communicate with the sensor, they just need to change the setup of PIN subroutine through NI MAX and keep other subroutines and programs intact. The output of PIN subroutine is bounded into a bus, which is connected to the following subroutines, as show in Fig.6.
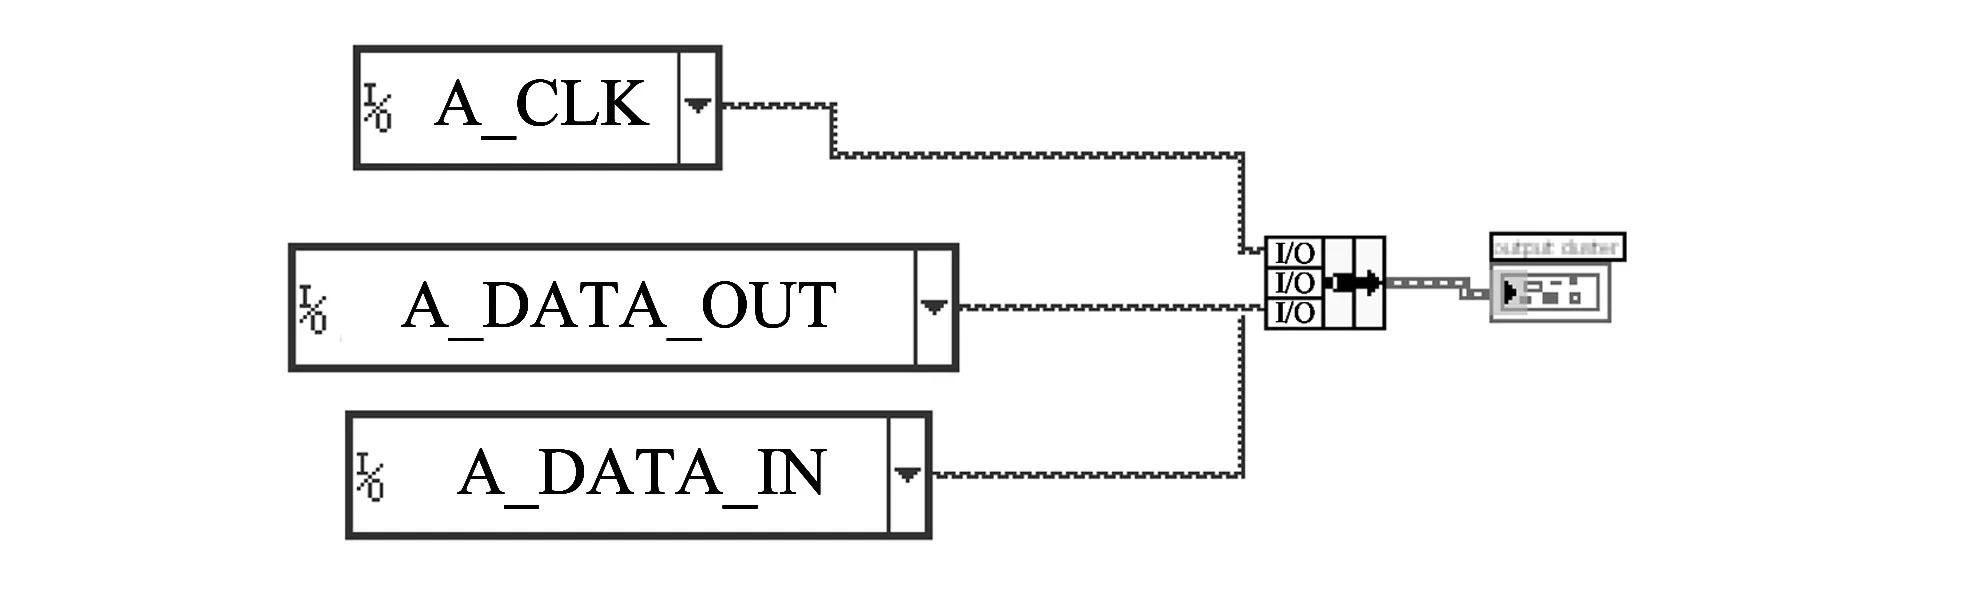
Fig.6 PIN subroutine select the pins connecting to the sensor to build a bus
4 RH-TM subroutine (layer 3)
From the first section of the timing waveform shown in Fig.3, it can be seen that the dataflow is almost unidirectional from the controller to the sensor. One easy way to implement this operation is to save SCK and DATA signal levels into the system memory and send out the bit sequence to SHT75 sensor by a loop structure.
According to the timing waveform shown in Fig.3 and the product specification[9], it can be known that the TM measuring command is 00011 and the RH measuring command is 00101. In order to avoid logic hazard and signal jitters at the interface, the signal level in the data line is better to maintain high
or low during the whole clock period, as shown in Fig.6[9]. Finally, the instructions can be implemented as the one shown in Fig.7.
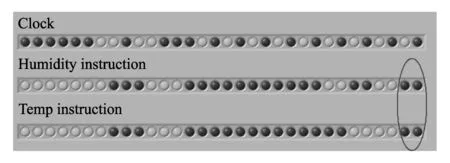
Fig.7 Saved operations of RH and TM measuring instructions
According to the state diagram shown in Fig.4 and timing waveform shown in Fig.3, RH-TM subroutine can be programmed as shown in Fig.8.
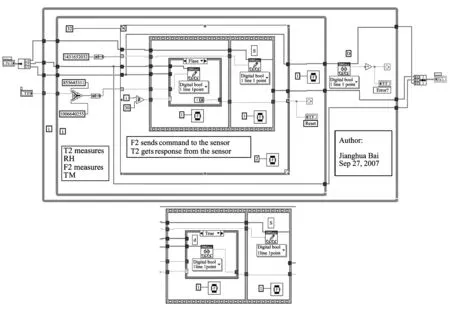
Fig.8 RH-TM subroutine
From Fig.5, it can be seen that RH-TM subroutine has a one bit instruction, True is to measure RH and False is to measure TM. The clock, TM and RH operations are all 32 bit binary numbers. They are saved into decimal numbers to simplify the notation. Then decimal to binary operators are used to change them into binary numbers to feed the For loop, which executes 32 times to write the commands to the sensor and read acknowledgement from the sensor. The input instruction is connected to a select operator, which will select the RH operation when the input is True and select the TM operation when the input is False.
As shown in Fig.8, in the first 30 cycles of the For loop, the controller sends RH or TM measuring operations to the sensor. In the 31st and 32nd cycles, the controller sends out a clock signal and reads the handshake signal from the sensor (see the bottom code in Fig.8).
If the sensor receives the data correctly, it will pull the handshake signal low. Otherwise the handshake signal is high, and the controller will resend the RH or TM command again until the command is sent correctly and sensor pulls the handshake signal low. After the sensor reads the command correctly, it will begin to measure the RH and TM and pull the handshake signal high again. If the handshake signal does not go up high, there are some errors in the measuring process. The measurement will be aborted. The controller will resend the command again until the first handshake signal is low and the second signal is high. Then the controller enters a Wait state and stops talking to the sensor. The RH measurement will take about 80 ms and Temp measurement will take about 240 ms. After this measuring time, the senor will pull the handshake signal down again to notify the controller that the sensor is ready for sending out data. Then the controller will enter Read data state and the DAQ2 subroutine will be triggered.
5 DAQ2 subroutine (layer 3)
DAQ2 subroutine reads data from the sensor and coverts the binary number into a decimal number. In order to show different LabVIEW programming techniques, here the DAQ2 is programmed with a different style from the RH-TM subroutine.
According to the timing waveform shown in Fig.3, the Read process takes 16 clock cycles. Each bit is read into the controller as the falling clock edge. After the 8th cycle, the controller writes a handshake signal 0 to the sensor at a rising clock edge to notify the sensor the first byte is read correctly. Then the sensor will send out the low 8 bits in the following 8 cycles. After the 16th clock cycle, at a rising clock edge, the controller will pull the data line high and keep it high for a while to terminate the reading process. In this way, a whole measuring process is complete, as shown in Fig.9.
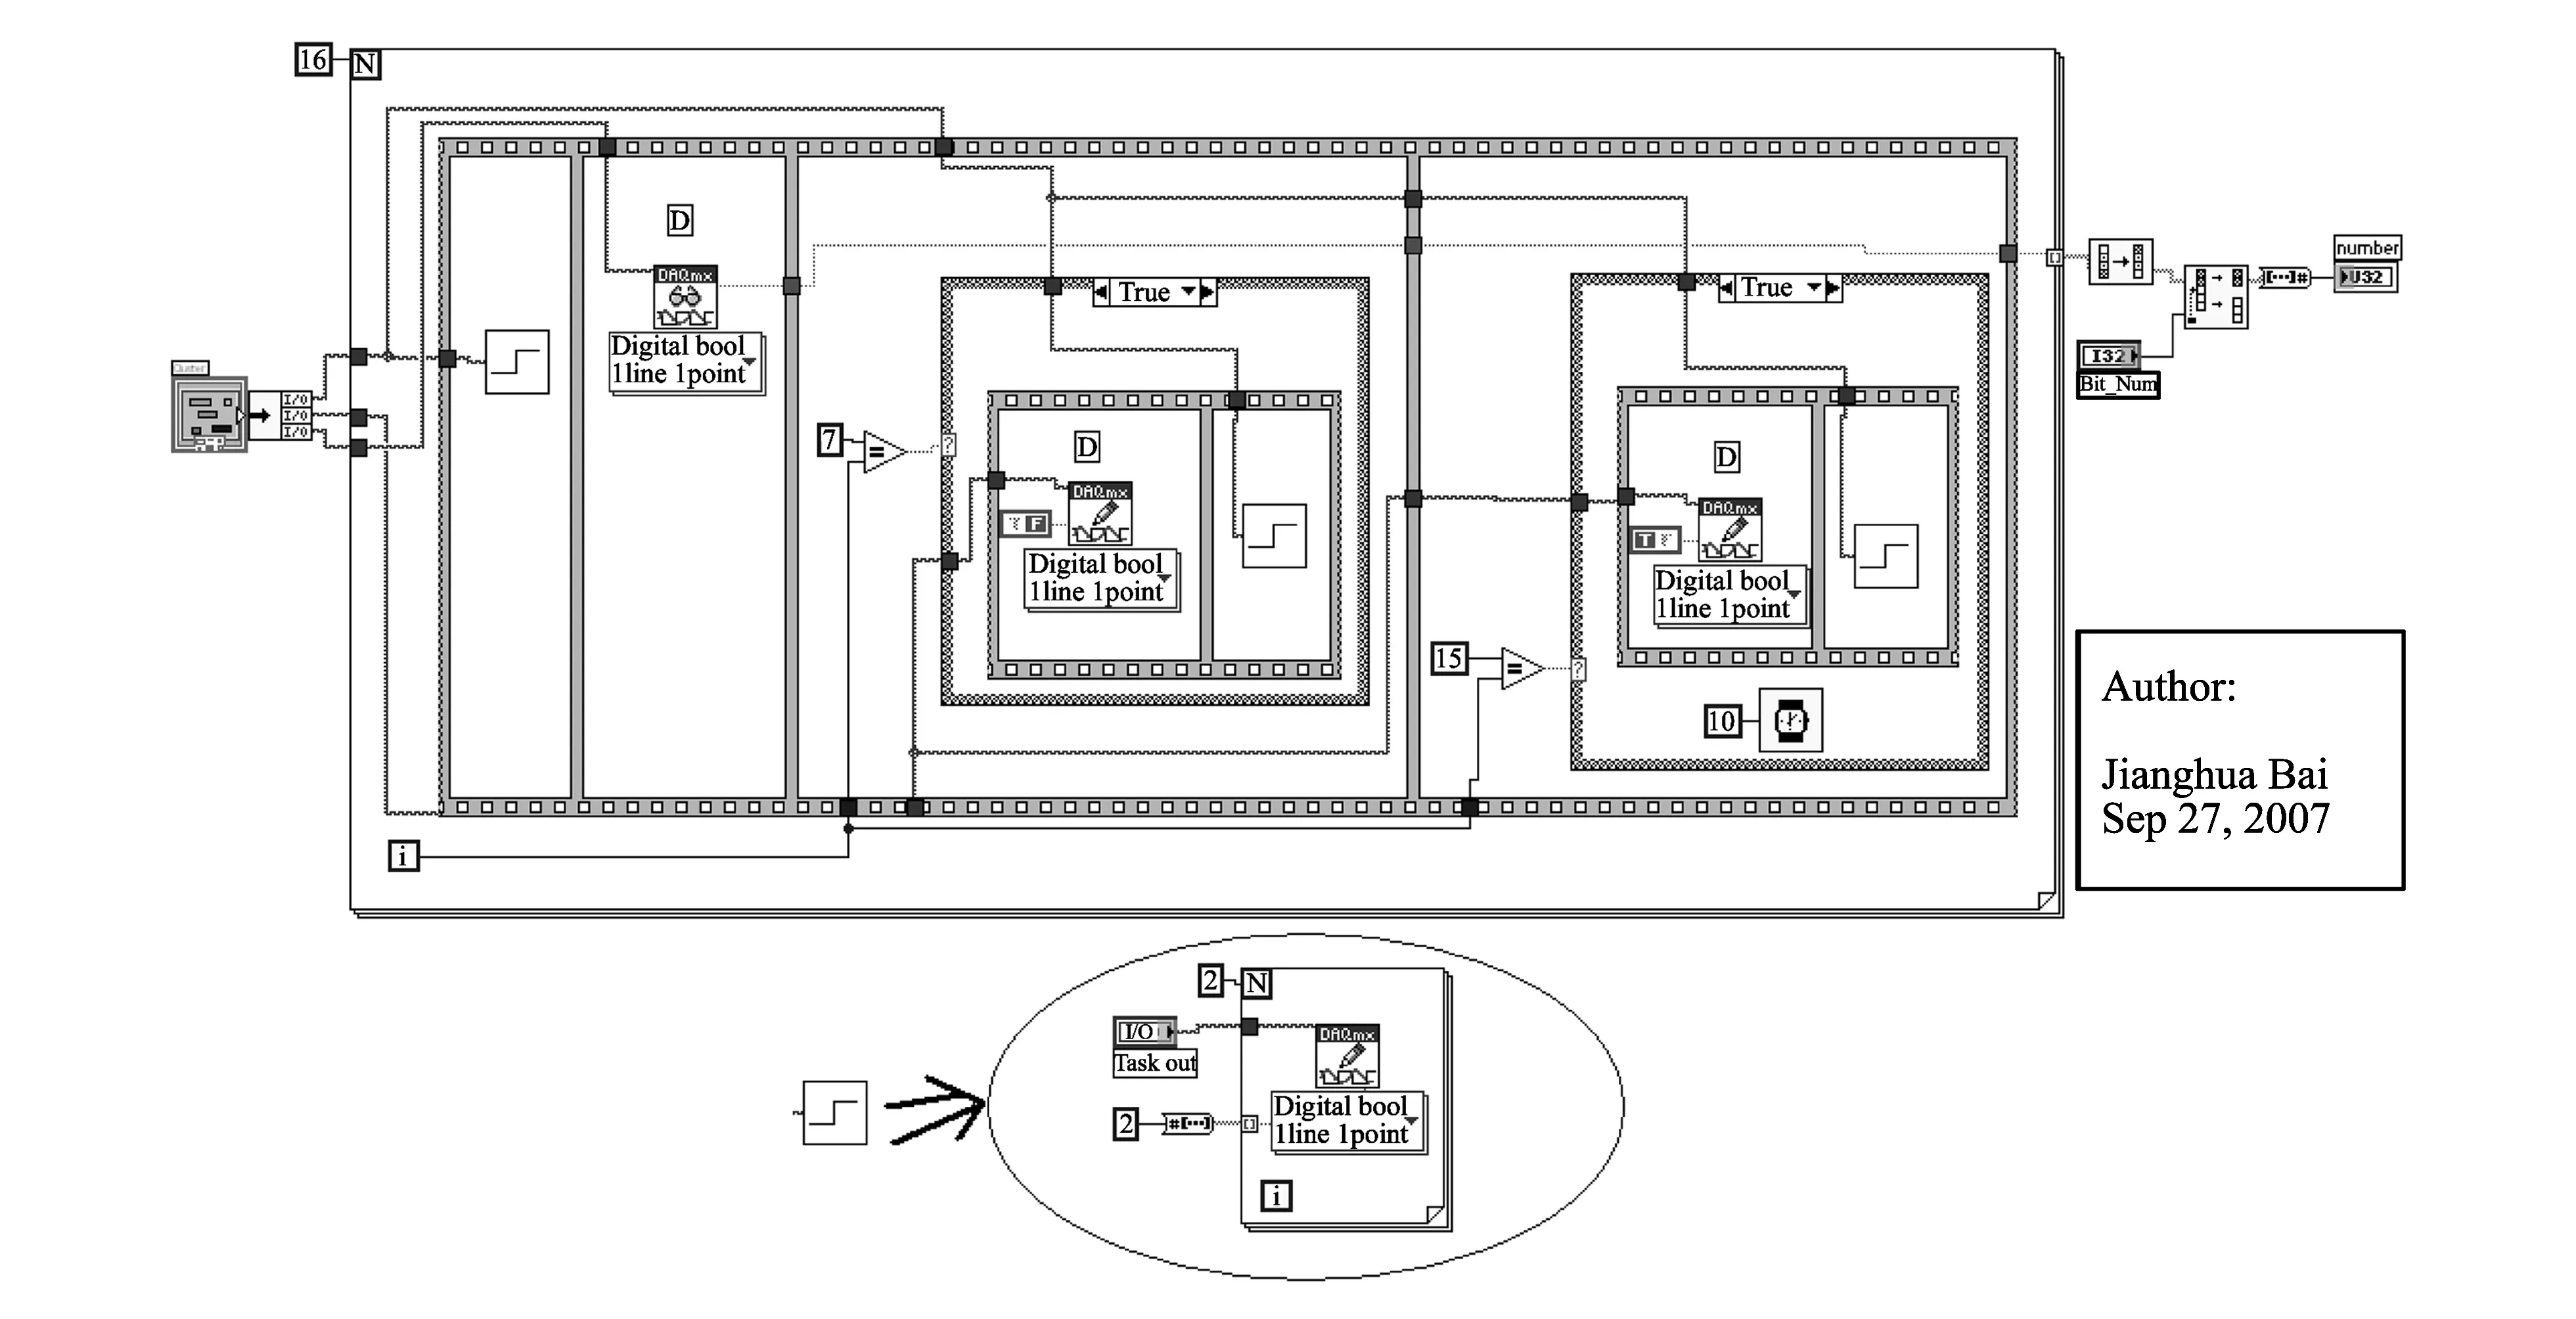
Fig.9 DAQ2 subroutine
From Fig.3, it can be seen that the controller reads the MSb at first[9]. So a reverse operator is used to change the binary number into its original form. Finally, the binary number is converted into decimal number and outputted to the RH or TM formula calculator and displayed on the screen.
6 Data visualization, storage and analysis (layer 4)
As shown in Fig.10, the front panel of the main controller displays the instant RH and TM value and the trend in 2 min. If everything is correct, Running is lit. When there is an error, the Error will be lit. T4RH LED shows the instruction sent by the controller to the sensor. When the T4RH is lit, the controller is sending RH measuring command to the sensor. When the T4RH is off, the controller is sending the TM measuring command. So in normal operation, the T4RH will blink all the time, showing the RH and TM instructions are sending out continuously.
A datalogger program can be attached behind of this main controller program. In this way, RH and TM values can be either saved in a hard disk or transfer red to the Internet. This controller can also work with a heater, sparkling, relay block or fan controller to controller the RH and TM of a warehouse or wine cell automatically.
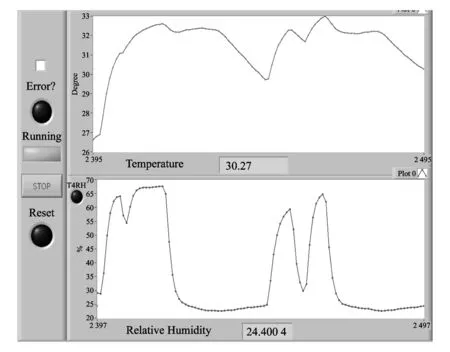
Fig.10 Front panel of main controller
7 Results and conclusion
In this example, there are only two instructions, one for RH and the other for TM. This sensor system can measure RH and TM automatically, quickly and accurately. It is also very easy to integrate with other LabVIEW controlled systems, making the fast and real-time dataloging, visualization, analysis, storage, and long distance data transfer and control possible. According to the functionality of a sensor, the instruction set can be designed either relatively complex or simple. A simple instruction set results in a stable and well encapsulating system, and then the driver is easy to be used independently or called by other programs.
This paper proposes a 4-layer model of developing sensor systems. The application is in the 4th layer. The instructions are in the 3rd layer. The signal regulation subroutine is in the 2nd layer. The sensor and the data acquisition board are in the 1st layer. The reader can follow the methods used in this paper to develop other similar automatic measurement and control systems[7].
The superb advantage of the layered abstraction and structural programming is that users can change each layer without affecting the functionality of programs working in other layers[7]. Programmable lock-in amplifiers, function generators and digital oscilloscopes are often used in scientific measurement. In this example, users can switch the USB DAQ interface with a lock-in amplifier AUX input and output interface. Then, one can use the lock-in amplifier to control the RH and TM sensor, by a minor change of the PIN subroutine. Layer models and programming can further improve the simplicity, integration and flexibility of LabVIEW controlled systems. Thus, the readability and maintenance of LabVIEW codes are improved.
[1] Johnson G, Jennings R. LabVIEW graphical programming. 4th ed. McGraw-Hill Professional, Columbus, USA, 2006.
[2] Blume P A. The LabVIEW style book. 1st ed. Prentice Hall, Upper Saddle River, New Jersey, USA, 2007.
[3] Bitter R, Mohiuddin T, Nawrocki M. LabVIEW: advanced programming techniques. CRC Press, Boca Raton, Florida, USA, 2000.
[4] Paton B E. Sensors transducers LabVIEW. Prentice Hall PTR, Upper Saddle River, New Jersey, USA, 1998.
[5] Lenka S, Mohapatra A. LabVIEW wireless sensor networks: a practical approach. 1st ed. Apress, New York, USA, 2013.
[6] Fairweather I, Brumfield A. LabVIEW: a developer's guide to real world integration. Chapman and Hall/CRC, 2011.
[7] Fedele L. Methodologies and techniques for advanced maintenance. Springer, Berlin, Germany, 2011.
[8] Kehtarnavaz N, Kim N J. Digital signal processing system-level design using LabVIEW. Newnes, New South Wales, Australia, 2005.
[9] Sensirion Company. Datasheet SHT7X humidity and temperature sensor. [2013-01-11]. http://www.sensirion.com/en/pdf/product_information/Datasheet-humidity-sensor-SHT7x.pdf.
[10] National Instruments. User guide and specifications USB-6008/6009. [2013-01-20]. http://www.ni.com/pdf/manuals/371303e.pdf.
date: 2013-08-21
BAI Jiang-hua (jianghua_bai@163.com)
1674-8042(2013)04-0307-06
10.3969/j.issn.1674-8042.2013.04.001
猜你喜欢
杂志排行

Journal of Measurement Science and Instrumentation的其它文章
- A CAWL handler for context-aware composite workflow services
- Movement and behavior analysis using neural spike signals in CA1 of rat hippocampus
- Synthesis and cost estimation of ethylene oxide process using PRO/II
- Efficient model building in active appearance model for rotated face
- Preparation and characterization of TiO2-SiO2-Fe3O4 core-shell powders in nano scale
- Changes in hippocampal neural response by external reward