2,2′-联嘧啶和二硫烯双核钴混配配合物的合成和晶体结构
2013-09-15王冬妮许多慧丁刘镠芦昌盛
王冬妮 许多慧 丁刘镠 陈 琪 芦昌盛*,
(1南京大学化学化工学院配位化学国家重点实验室,南京 210093)
(2南京工业大学理学院,南京 210009)
0 Introduction
Bis-dithiolate metal ion-pair complexes have been extensively studied for a long time,since potentially they could be candidates for conducting and magnetic materials as well as nonlinear optical materials[1-2].A variety of dithiolene coordination complexes have shown unusual optical,electrical,magnetic and electrochemical properties[3-5].
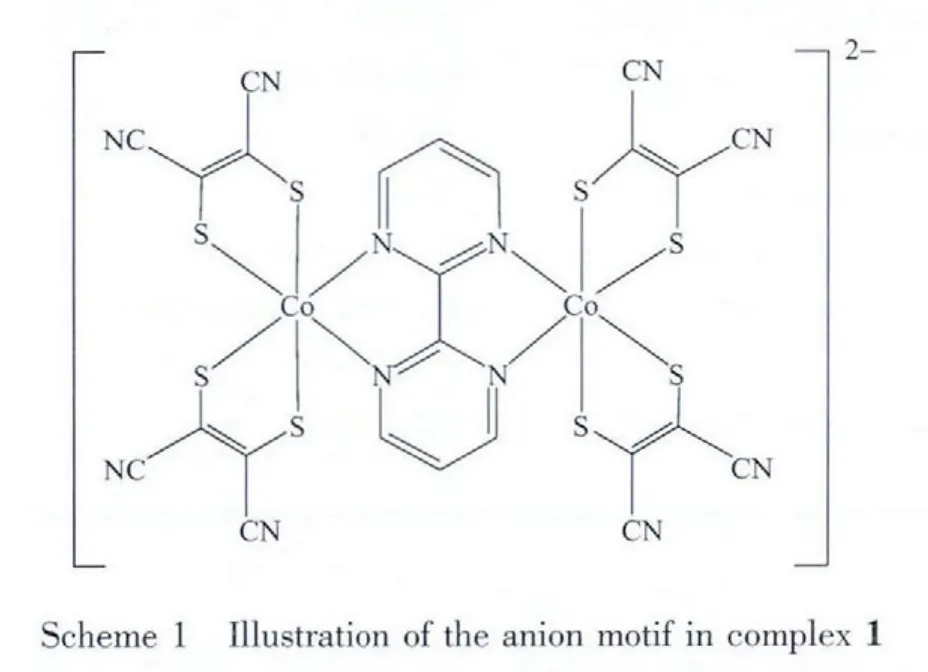
It is noted that the mixed-ligand complexes of transition metals with 1,2-dithiolene and diimine ligands have novel optical,electrical and magnetic properties[6-12].Therefore,we chose 2,2-pyrimidine and mnt as the diimine and dithiolene ligands to prepare a mixed-ligand dinuclear cobalt complex,[(C4H9)4N]2[(Co(mnt)2)2(bpy)]((C4H9)4N=tetrabutylammonium,mnt=aleonitriledithiolate and bpy =2,2′-bipyrimidyl)(complex 1 in Scheme 1),where two[Co(mnt)2]units are bridged by a pyrimidine ligand.UV spectroscopy reveals charge transfer between the two ligands(from mnt to 2,2′-bipyrimidine).Complex 1 possesses reversible redox process in the potential range of-0.8 to 0.8 V.And the temperature-dependent magnetic susceptibility indicates the existence of antiferromagnetic exchange between the two cobalt i ons.
1 Experimental
1.1 Materials and measurements
The reagents of analytical grade were purchased from commercial sources and used without any further purification.The starting materials,2-butenedinitrile-2,3-dimercapto disodium salt(Na2mnt)was synthesized following the literature procedures[13].Elemental analyses (EA)were performed on a Perkin-Elmer 1400C analyzer.TGA was performed on a SDT 2960 thermal analyzer under flowing N2with a heating rate of 10 ℃·min-1between ambient temperature and 700℃.IR spectra were recorded on a Bruker Vector 22 spectrophotometer with KBr pellets in the 4 000~400 cm-1region.UV-Vis spectra were recorded with a Shimadzu UV-3150 double-beam spectrophotometer using a quartz glass cell with a path length of 10 mm.Magnetic susceptibility measurements were carried out on a Quantum Design MPMS-XL superconducting quantum interference device (SQUID)magnetometer over the range 2.0~300 K.Powder X-ray diffraction(PXRD)measurements were performed on a Rigaku D/max-RA X-ray diffractometer using Cu Kαradiation(λ =0.154 18 nm),in which the X-ray tube was operated at 40 kV and 40 mA at room temperature.XPS patterns were recorded on a PHI 5000 VersaProbe X-ray photoelectron spectrometer,using Al Kα monochromatic X-ray radiation (1 486.6 eV).The peak positions were calibrated against the reference C1s peak (284.6 eV)of contaminating carbon.CVs were recorded on a CHI660B electrochemical analytical instrument,with platinum disk as working electrode,platinum wire as counter electrode,and an Ag/AgCl electrode as reference electrode.Ferrocene was used as an internal standard for all electrochemical experiments.
1.2 Synthesis of[(C4H 9)4N]2[(Co(mnt)2)2(bpy)](1)
To the NiCl2·6H2O (47.5 mg,0.2 mmol)in a mixture solvent of acetonitrile (20 mL)and methanol(20 mL),Na2mnt(74.4 mg,0.4 mmol)was added,and the solution turned red. (C4H9)4NBr (128.4 mg,0.4 mmol)was added to the above mixture and stirred at room temperature for 2 h.The mixture was evaporated under reduced pressure until microcrystals appeared,followed by refrigeration in freezer.24 h later,[(C4H9)4N]2[Ni(mnt)2]crystals were filtered.
Single-crystal samples of[(C4H9)4N]2[(Co(mnt)2)2(bpy)]suitable for X-ray diffraction measurement were grown from a diffusion method.The above-prepared[(C4H9)4N]2[Ni(mnt)2](25 mg,0.03 mmol)in acetonitrile(8 mL)was layered on top of a mixture of acetonitrile and water(1∶1,8 mL),with a mixture of Co(NO3)2·6H2O (36.25 mg,0.12 mmol)and 2,2′-bipyrimidyl(34.5 mg,0.21 mmol)in water(5 mL)at the bottom.About one month later,dark green crystals were obtained,yield 11.88 mg (60%).FTIR absorptions(KBr pellets,ν/cm-1):3058(Ar-H),2 962(C-H),2 853(C-H),2210(CN),2 196(CN),1 634(C=C),1 446(C=C of mnt2-),845 (C-Sof mnt2-),723 (Ar-Csingle replaced).Elemental Analysis Calcd. (%)for C56H78N14S8Co2:C,50.99;H,5.92;N,14.87.Found(%):C,51.07;H,6.02;N,15.12.UV-Vis (λmaxin acetonitrile):260,306 and 422 nm.
1.3 X-ray Single Crystallography
Single crystal of complex 1 was mounted on glass fibers for data collection on a Bruker SMART 1K CCD area detection diffractometer with Mo Kα (λ=0.071073 nm) radiation from a graphite monochromator at 293 K(HT).In the range of 2.54°<θ<25.00°,a total of 47462 reflections were collected,of which 11832 were independent(Rint=0.058 4),and 8246 with I>2σ (I)were observed.The collected data were reduced by using the program SAINT[14]and empirical absorption corrections were done by the SADABS[15]program.Structure was solved by the direct method(SHELXS-97)and refined by full-matrix least-squares on F2(SHELXL-97)[16],while hydrogen atoms were inserted in the calculated positions[17].
All molecular graphics were drawn by using XSHELL and Diamond softwares.Details of the data collection and refinement results for complex 1 were listed in Table 1,while selected bond distances and bond angles were given in Table 2.
CCDC:919857.
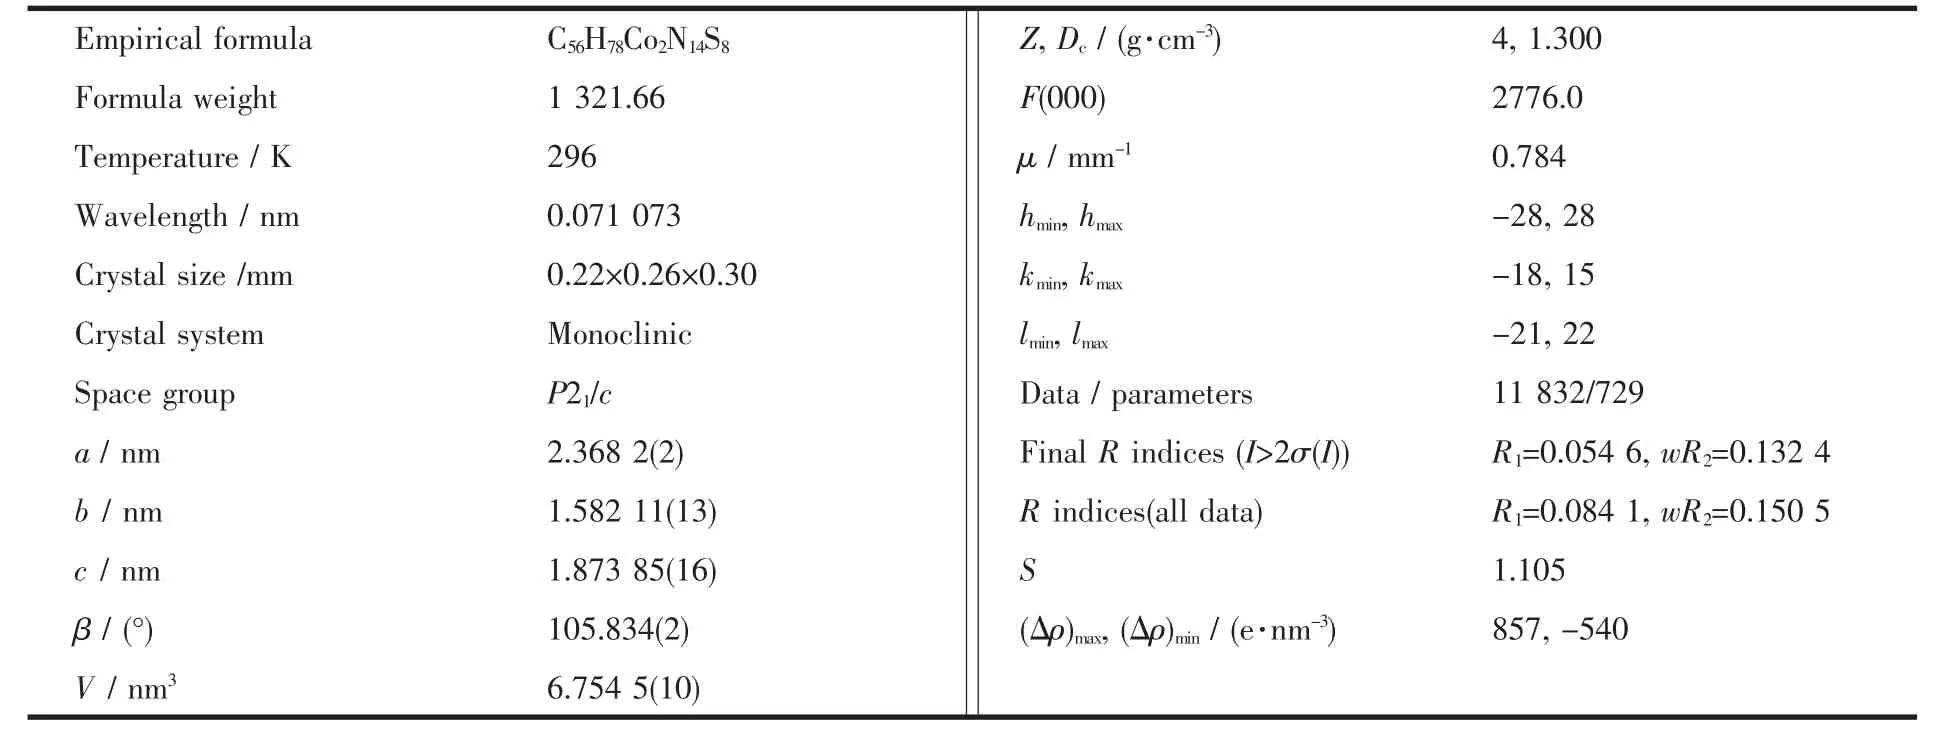
Table 1 Crystal data and structural refinements for 1
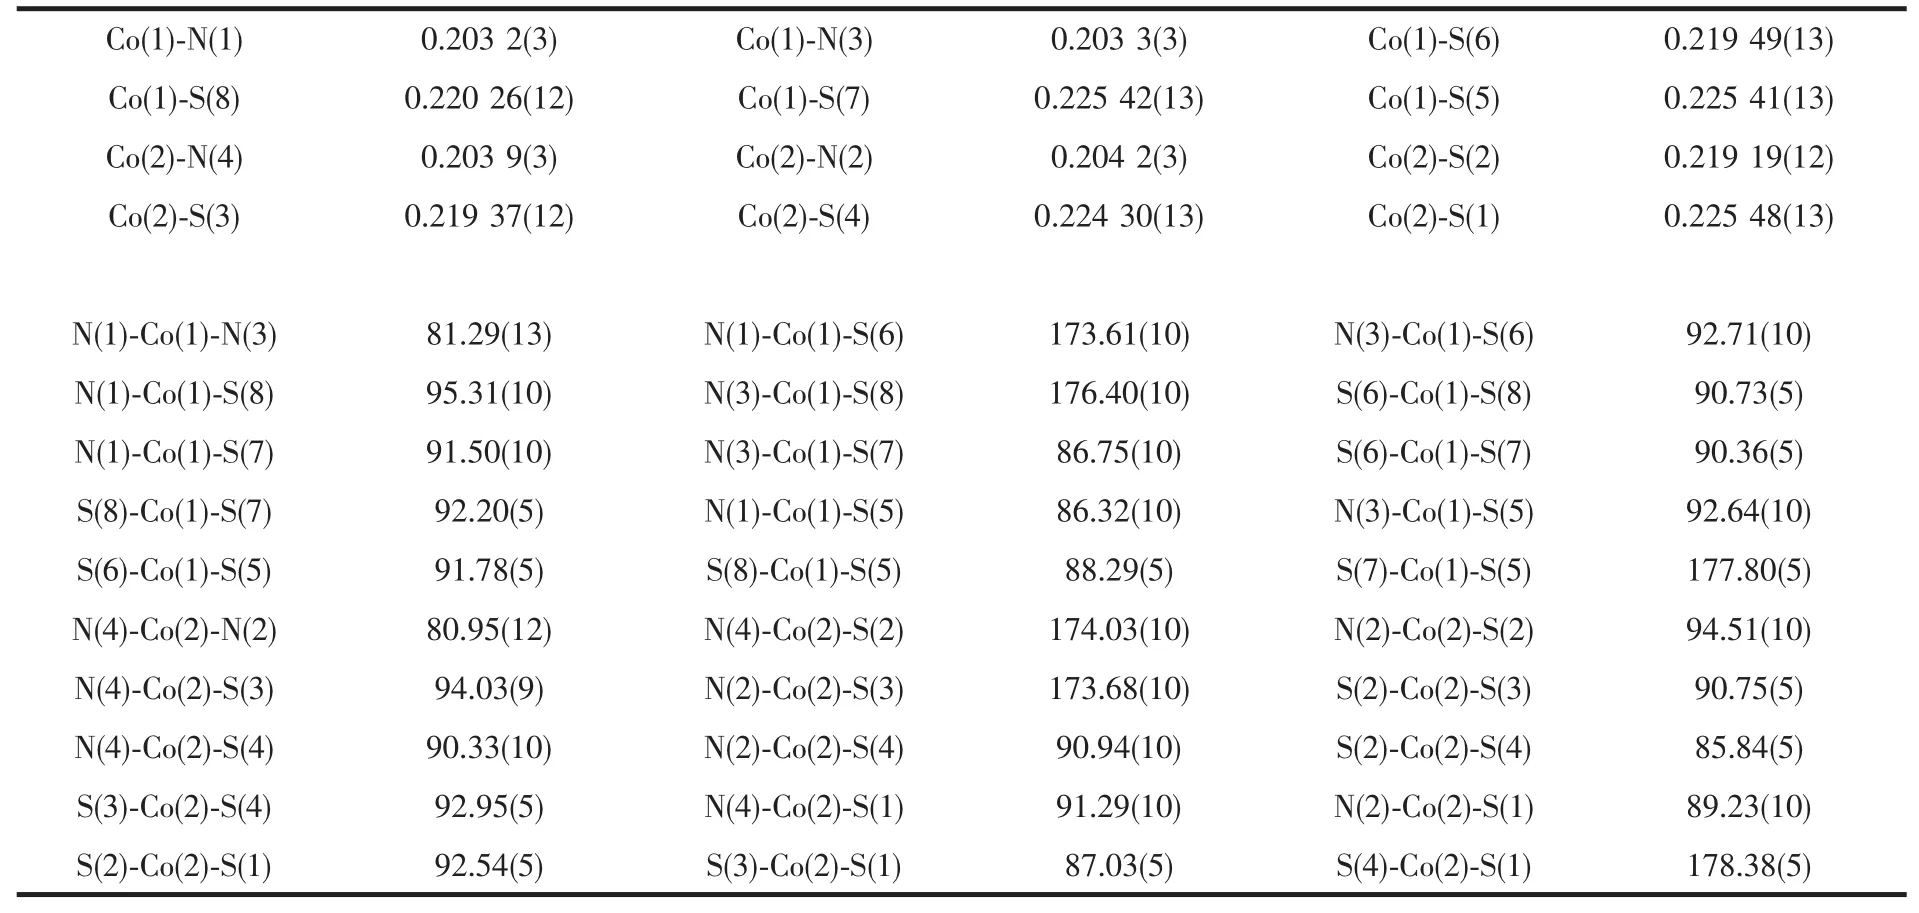
Table 2 Selected bond distances(nm)and angles(°)for 1
2 Results and discussion
2.1 Thermal Analysis
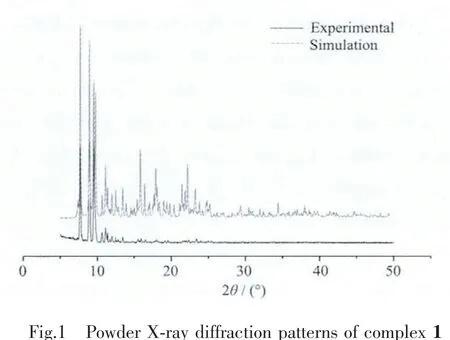
PXRD has been used to check phase purity of the bulk sample in solid-state.Therefore PXRD measurements of complex 1 were performed prior to its thermal-stability analysis.As shown in Fig.1,measured PXRD patterns of complex 1 closely match the simulated ones generated from the results of single crystal diffraction,indicating that our product is quite pure.
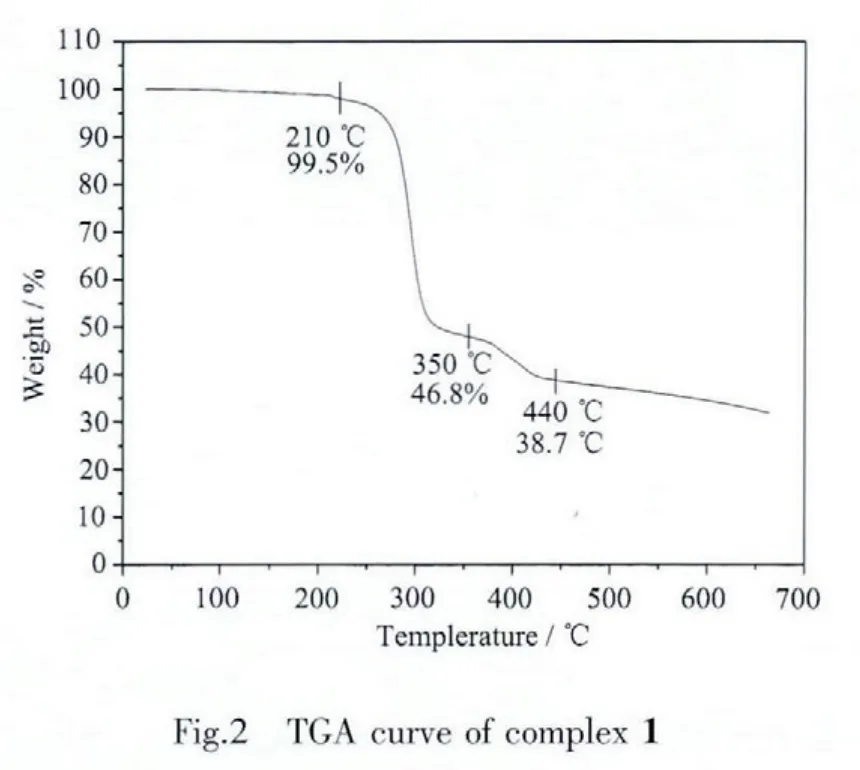
TGA of complex 1 was carried out,as depicted in Fig.2.The thermogram indicates that complex 1 successively decomposed in two stages.The weight loss of ca.52.7%within the temperature range of 210~350 ℃ may be attributed to the loss of one 2,2′-bipyrimidine ligand and four mnt groups(Calcd.53.7%).The second stage in the temperature range of 350~440 ℃ is presumably due to the partial decomposition of(C4H9)4N+cation.
2.2 Electronic Absorption Spectra
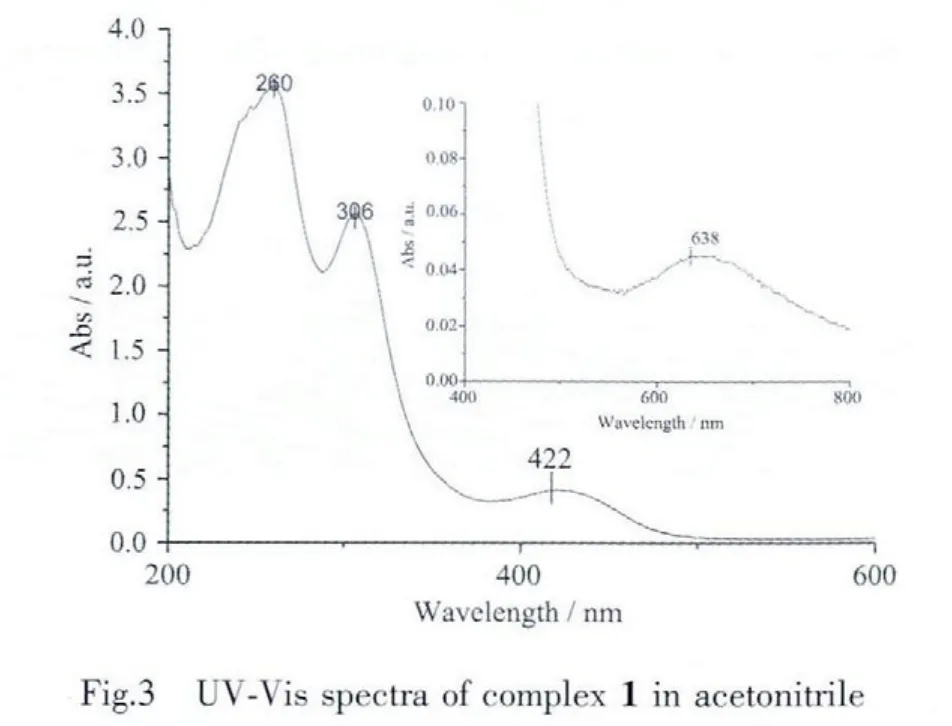
UV-Vis spectra of complex 1 has been recorded in acetonitrile solution with the concentration of 2.0μmol·L-1.It shows three obvious absorption peaks centered at 260,306 and 422 nm as illustrated in Fig.3 (ε=1.78×106,1.28×106and 2.04×10⁵L·cm-1·mol-1respectively),which are ascribed to the overlapping of πb→π*transitions of mnt and 2,2′-bipyrimidine,the πb→π*transitions of mnt,and the π-π*transitions between mnt and 2,2′-bipyrimidine,respectively[18].There is also a weak absorption peak centered at 465 nm (ε=2.0×10⁻⁴L·cm-1·mol-1,as inserted panel in Fig.3),which is ascribed to the LLCT transition from the HOMO(highest occupied molecular orbital)of mnt to the LUMO(lowest unoccupied molecular orbital)of 2,2′-bipyrimidine ligand.If the orientation of both ligands would be exactly orthogonal(torsion angelθ=90°),the LLCT transition is symmetry forbidden and the corresponding absorption should be absent.However,a small deviation from 90°does not require much energy,which can be obtained by the thermal excitation of torsional vibrations.Thus the orbital forbidden can be partly relieved,and a small peak will be present.Therefore in fact,one weak peak at 634 nm mounted slightly in Fig.3,as the torsion angel of mnt and 2,2′-bipyrimidyl is not 90° (from 85.816°to 92.924°,vide infra)[19].
2.3 Magnetic susceptibilities of complex 1
Variable-temperature magnetic measurements were performed with complex 1 at an applied magnetic field of 2 kOe in the range of 2~300 K.
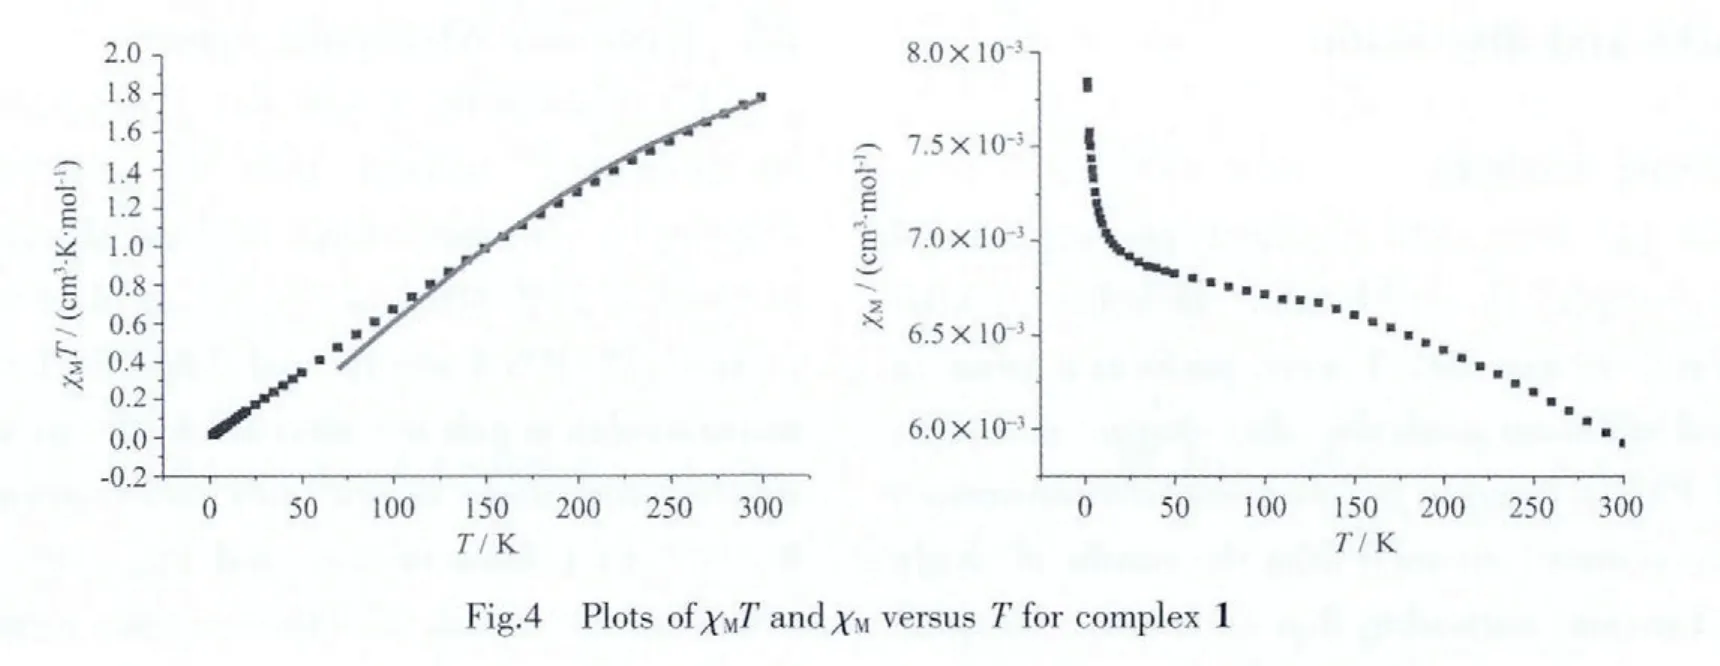
The resulting plots of χMand χMT versus T for complex 1 are depicted in Fig.4.The value ofχMincreases from 6×10⁻³to 7.8×10⁻³cm-3·mol-1during the temperature range from 300 to 2 K.At 300 K,the χMT is 1.80 cm3·K·mol-1,close to the theoretical value for two non-interacting Co2+(1.875 cm3·K·mol-1,S=3/2). Upon cooling, the χMT value continuously decreases to 0.03 cm3·K·mol-1at 2 K,which features a fingerprint of the antiferromagnetic exchange interaction.The magnetic susceptibility data were fitted[20]using the spin-Hamiltonian accounting to the isotropic dimer model for two S=3/2 cobalt ions.
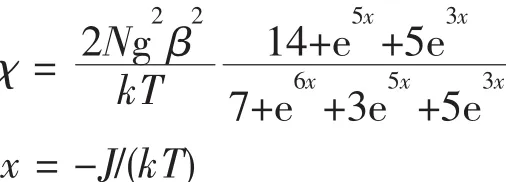
The best fit(shown as the solid lines in Fig.4)results in parameters g=2.1 and J=78.39 cm-1,suggesting a weak antiferromagnetic interaction between the two Co2+ions.
2.4 X-ray Photoelectron Spectroscopy(XPS)
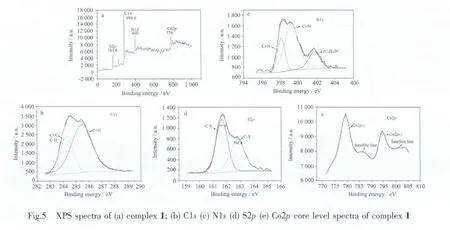
XPS is a proven reliable method for intensive investigation for the oxidation state of atoms in the top few layers of material surfaces with partially filled valence bonds.Fig.5a shows that complex 1 is composed mainly of C,N,S and Co.The XPS core level spectra of C1s,N1s,S2p,Co2p are present in Fig.5b,5c,5d,and 5e.The C1s XPS core level can be curve-fitted into two peak components with binding energy of about 284.2 and 285.4 eV,attributable to the carbon atoms in the forms of C=C (aromatic)and CN (nitrile group)respectively.The N1s signal is fitted by three sub-bands,corresponding to nitrile group (CN)at 398.1 eV,2,2′-bipyrimidine (CN)at 399.2 eV,and positively charged nitrogen atoms(C4H9)4N+with a binding energy of 401.7 eV.The S2p signal is fitted by two sub-bands,corresponding to-C-Sat 161.6 and-C-S-at 162.8 eV of mnt group.Highresolution Co2p spectrum shows spin-orbit splitting into 2p1/2and 2p3/2components,and both components qualitatively contain the same chemical information.It′s evident that there are obvious shake-up satellites around the Co2p1/2and 2p3/2peaks.Satellite line structure always can be observed in the late 3d transition metal compounds.These additional spectral lines have been related either to a coupling between unpaired electrons in the atom (multiplet splitting)or a multipleelectron excitation(the so-called shakeup).[21]It is reported that cobaltバwas distinguished from cobalt(Ⅱ)by the absence of mulitelectron excitation satellites in the former,[22-23]so most likely the cobalt ions in complex 1 are of Co(Ⅱ)form.
2.5 Cyclic voltammograms
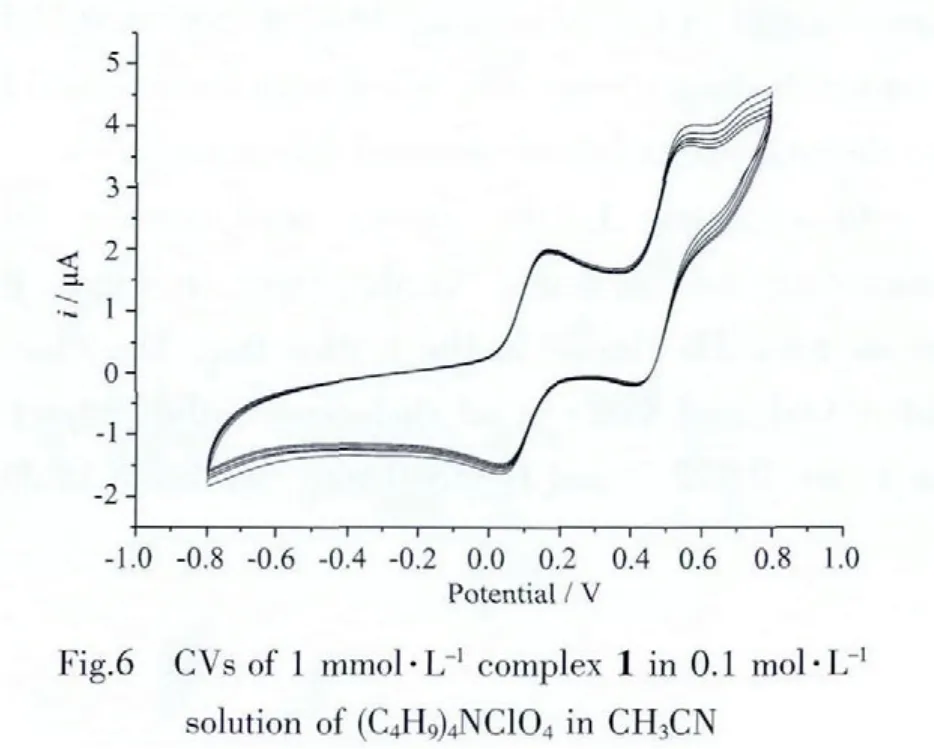
The electrolyte for electrochemistry in CH3CN was(C4H9)4NClO4(0.1 mol·L-1)and the concentration of complex 1 was1 mmol·L-1.All thepotentialswererun at ascan rateof 100 mV·s-1.Fig.6 shows CVsof complex 1.There are two reversible redox couples,one(observed at 0.101 5 V)correspondingtotheredox processof internal ferroceneand theother reversibleredoxcouple(ipc/ipa≈1)observed at 0.48 V vs Ag/AgCl attributed to the[Co(mnt)2]2(bpy)/[Co(mnt)2]2(bpy)2-couple.
2.6 Structural description of complex 1
Complex 1 crystallizes in monoclinic P21/c space group.An ORTEP drawing with hydrogen atom labeling of the asymmetric unit is shown in Fig.7.Its asymmetric unit contains one[(Co(mnt)2)2(bpy)]2-anion and two (C4H9)4N+(bpy)cations.In the anion,two motifs of Co(mnt)2are linked by bridging ligand 2,2′-bipyrimidine to form a binuclear core.Every central Co atom is in a distorted octahedral coordination sphere and coordinated with four S atoms from two mnt ligands and two N atoms from 2,2′-bipyrimidine.The Co-S bond lengths range from 0.219 20 to 0.225 51 nm and the Co-N bond lengths range from 0.203 2 to 0.204 3 nm.In addition,other chemically equivalent but crystallogrphically unequivalent bond distances within the anion are shown in Table 2.The two mnt ligands together with the 2,2′-bipyrimidine form a three mutually perpendicular plane.The distance between the Co atoms is 0.547 8 nm and the torsion angel of Co-S-Co range from 85.84°to 92.95°,a minor deviation from 90°,which can be obtained by the thermal excitation of torsional vibrations[19].
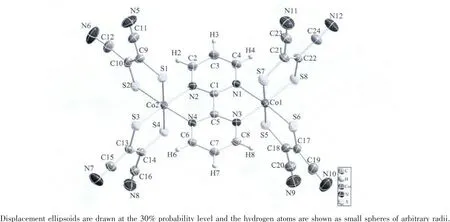
Fig.7 ORTEPdrawings of anion in complex 1 with the atom-numbering scheme
In complex 1,the anions and cations form alternating arrangements.As displayed in Fig.8,the anions form 1D chains in the b direction.The closest Co1…Co1 and Co2…Co2 distances within adjacent anion are 0.972 7 and 0.983 0 nm.As shown in Fig.8c,there seems to be weak anion-π interactions between-CN and bpy[24].The distance between N5 and the centroid of the pyrimidine ring of the adjacent anion is 0.441 6 nm,while the distance between N10 and the centroid is 0.428 8 nm.It is noticeable that there exist non-classical intramolecular and intermolecular C-H…S,C-H…N hydrogen-bonding interactions[25],which are summarized in Table 3.
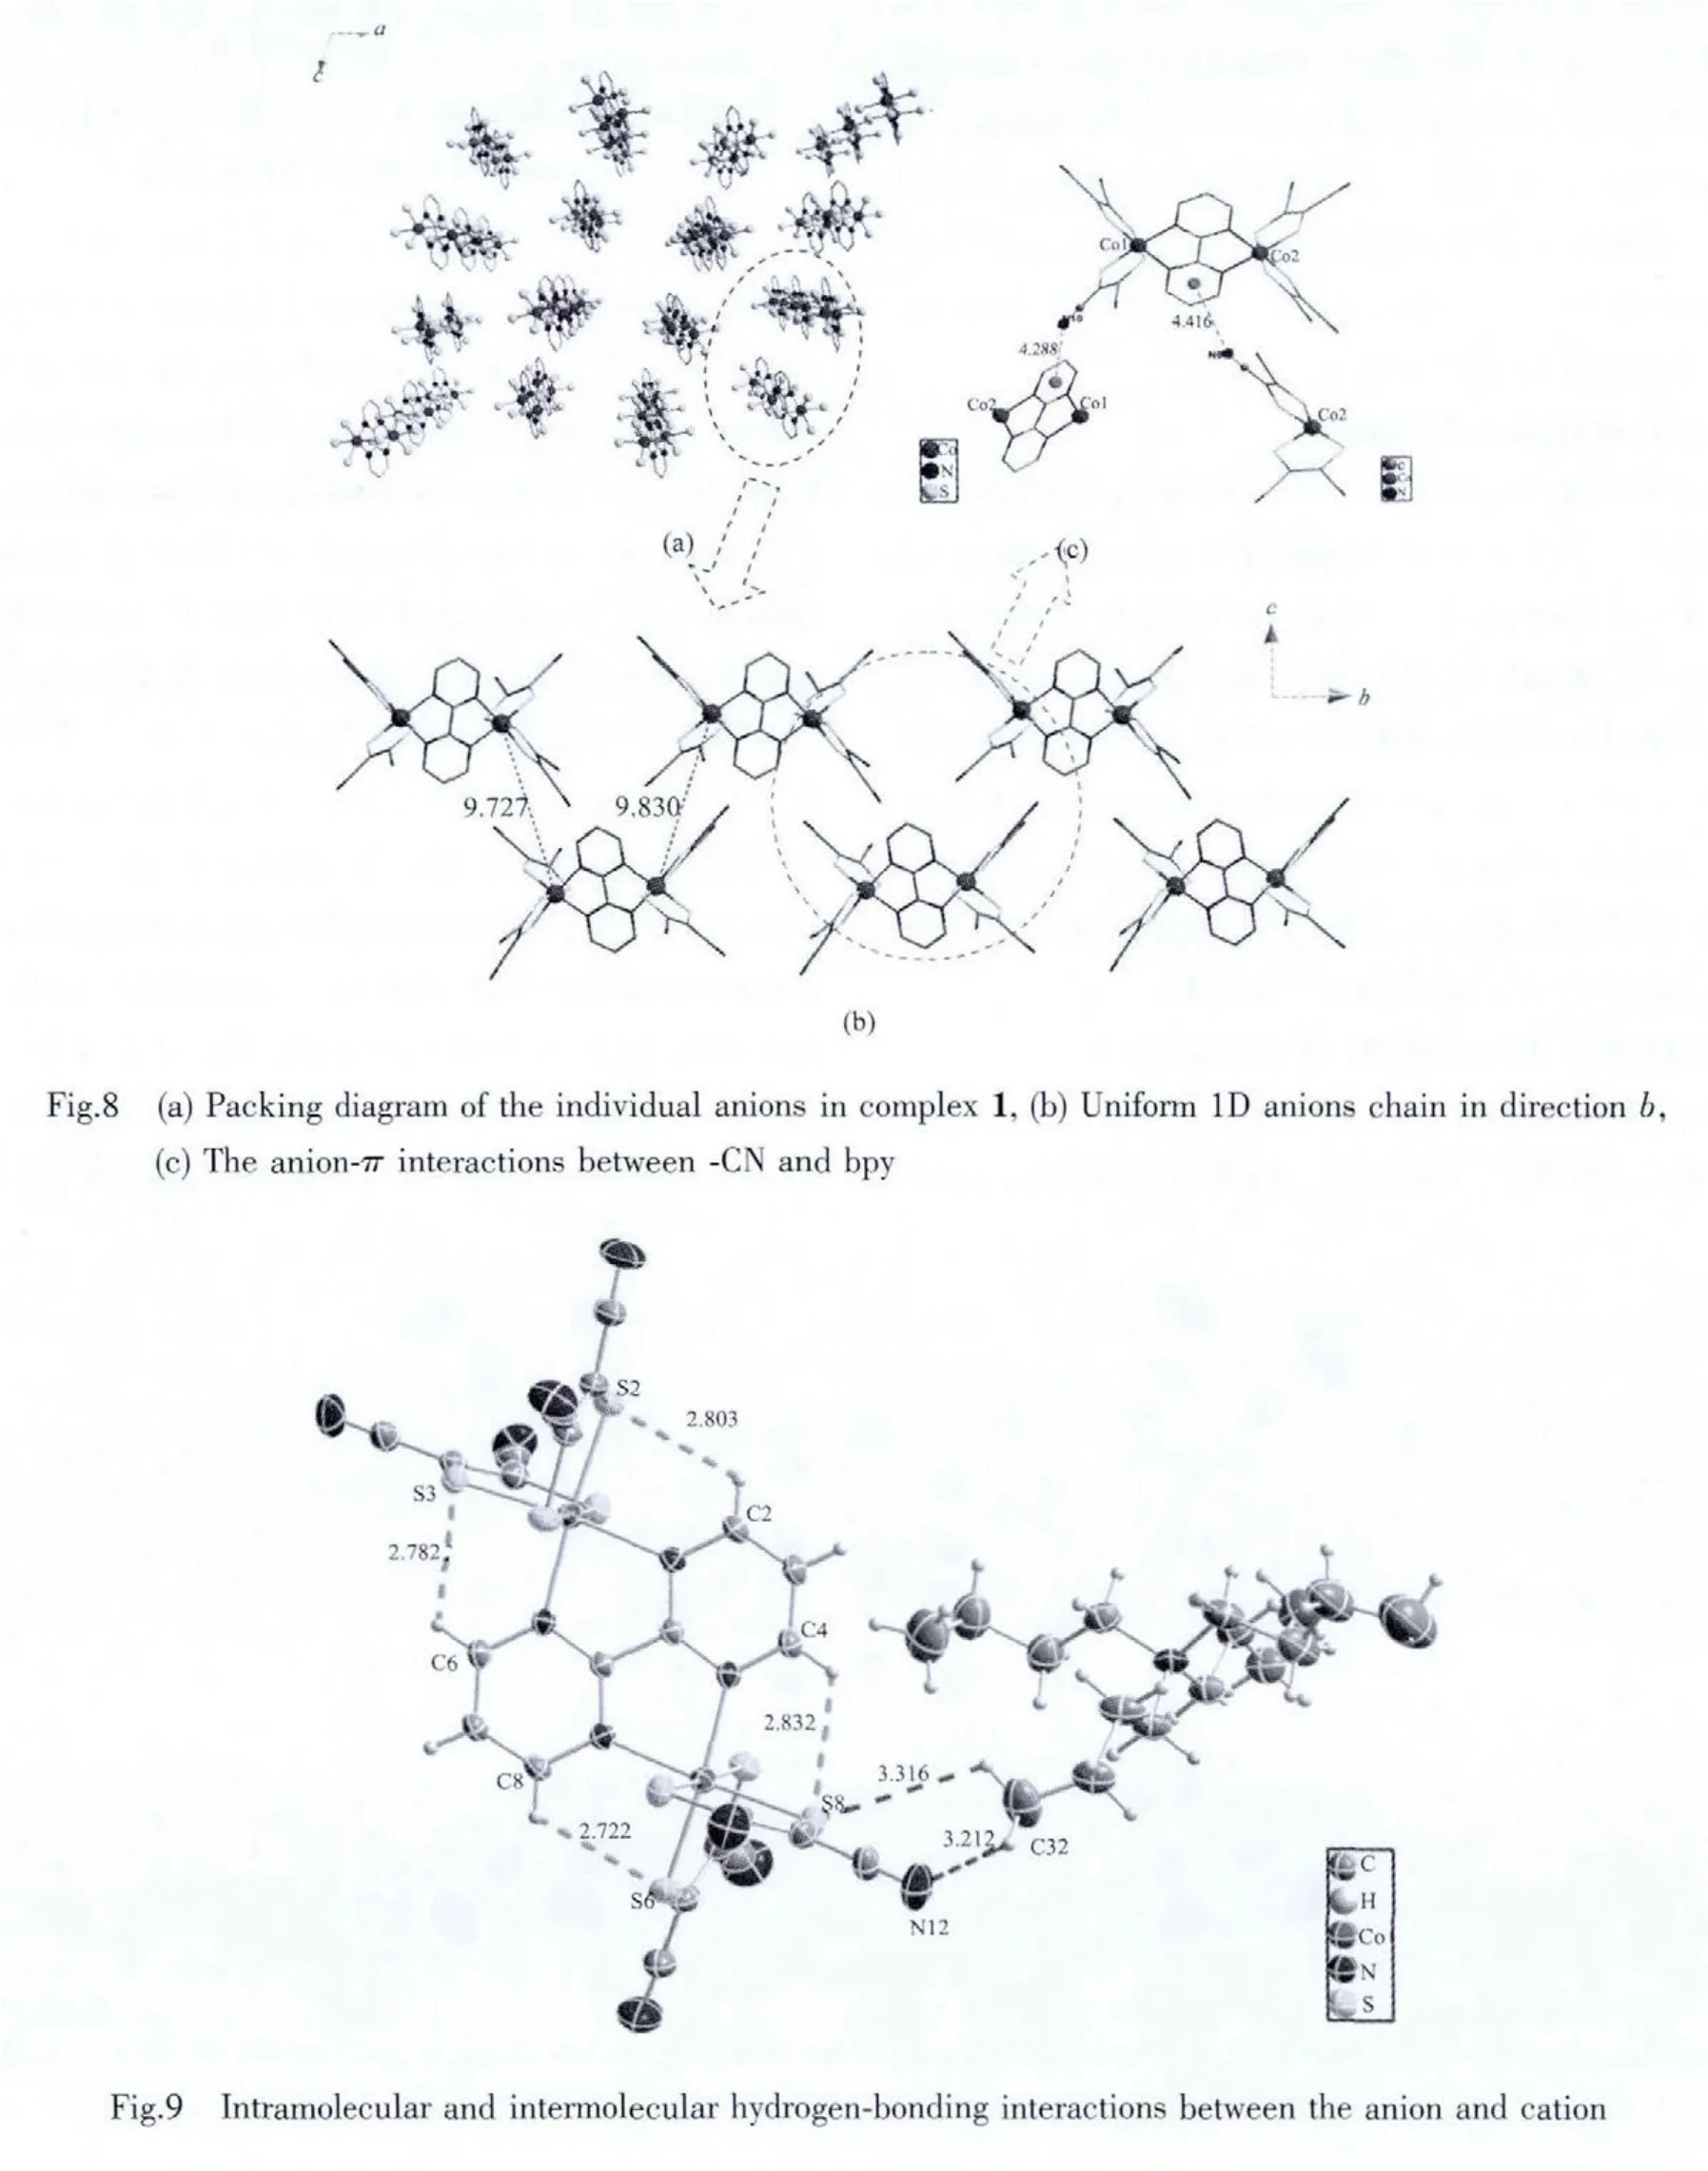

Table 3 Selected hydrogen bond parameters of complex 1
3 Conclusions
In summary,a mix ed-ligand dinuclear cobalt complex [(C4H9)4N]2[(Co(mnt)2)2(bpy)], has been synthesized and characterized.The anions and cations form alternating arrangements in the crystal structure.In the anion,two motifs of Co(mnt)2are linked by bridging ligand 2,2′-bipyrimidine to form a binuclear core,and the anions form 1D chains in the b direction.There are weak anion-π interactions between-CN group(from mnt ligand)and bpy as well as intramolecular and intermolecular C-H…S,C-H…N hydrogen-bonding interactions.UV-Vis spectra reveals charge transfer between the two ligands(from mnt to 2,2′-bipyrimidine),which is verified by the XPS data (the existence of both-C-S-and-C-S signals).Magnetic susceptibilities measurements of complex 1 revealed weak antiferromagnetic exchange interactions between the adjacent Co(Ⅱ).
Acknowledgements:We are grateful for the financial support of the National Basic Research program of China(2010CB923402),National Nature Science Foundation of China(NSFC:21021062 and 91122031),Jiangsu Science &Technology Department (BK2011550)and the Center of Analysis and Determining of Nanjing University.
[1](a)Nakamura T,Akutagawa T,Honda K,et al.Nature,1998,394:159-162
(b)Malfant I,Andreu R,Lacroix P G,et al.Inorg.Chem.,1998,37:361-3370
(c)Kobayashi A,Fujiwara E,Kobayashi H.Chem.Rev.,2004,104:5243-5246
(d)Kobayashi H,Cui H B,Kobayashi A.Chem.Rev.,2004,104:5265-5288
(e)Kato R.Chem.Rev.,2004,104:5319-5346
[2](a)Staniland SS,Fujita W,Umezono Y,et al.Inorg.Chem.,2005,44:546-551
(b)Dawe L N,Miglioi J,Turnbow L,et al.Inorg.Chem.,2005,44:7530-7539
(c)Jeannin O,Clerac R,Fourmigue M.J.Am.Chem.Soc.,2006,128:14649-14656
(d)Jeannin O,Clerac R,Fourmigue M.Chem.Mater.,2007,19:5946-5954
(e)Nomura M,Fourmigue M.Inorg.Chem.,2008,47:1301-1312
[3]Charles T V,Robert D B,Jon B,et al.Inorg.Chem.,1985,24:2905-2910
[4]Jane H W,Robert DB,Phirtu S.Inorg.Chem.,1990,29:68-73
[5]Nishijo J,Ogura E,Yamaura J.Solid State Commun.,2000,116:661-664
[6]Huertas S,Hissler M,McGarrah J E,et al.Inorg.Chem.,2001,40:1183-1188
[7]Connick W B,Geiger D,Eisenberg R.Inorg.Chem.,1999,38:3264-3265
[8]Paw W,Lachicotte R J,Eisenberg R.Inorg.Chem.,1998,37:4139-4141
[9]Zuleta J A,Burberry M S,Eisenberg R.Coord.Chem.Rev.,1990,97:47-64
[10]Zuleta J A,Chesta C A,Eisenberg R.J.Am.Chem.Soc.,1989,111:8916-8917
[11]Matsubayashi G,Nakano M,Tamura H.Coord.Chem.Rev.,2002,226:143-151
[12]Kaasjager V E,Bouwman E,Gorter S,et al.Inorg.Chem.,2002,41:1837-1844
[13]Davison A,Holm R H.Inorg.Synth.,1967,6:8-26
[14]Siemens.SAINT v4 Software Reference Manual,Siemens Analytical X-Ray Systems,Inc.,Madison,Wisconsin,USA,2000.
[15]Sheldrick G M.Program for Empirical Absorption Correction of Area Dectector Data,Univ.of Gottingen,Germany,2000.
[16]Sheldrick G M.SHELXS-97,Program for X-ray Crystal Structure Solution,University of Gttingen,Germany,1997.
[17]Smart and SAINT,Area Detector Control and Integration Software;Siemens Analytical X-Ray Systems,Inc.:Madison,WI,1996.
[18]FU Tie-Xiang(傅 铁 祥),LI Dan(李 丹).CIESC J.(Huagong Xuebao),2006,57(11):2772-2777
[19]Benedix R,Hennig H.Chem Phys.Lett.,1990,175:483-487
[20]Bai SQ,Gao E Q,He Z,et al.New J.Chem.,2005,29:935-941
[21]McIntyre N S,Cook M G.Anal.Chem.,1975,47:2208
[22]Yang J,Liu H W,Wayde N.J.Phys.Chem.C,2010,114:111-119
[23]HU Gang(胡 刚),ZHANG Wu(张 芜).Acta.Phys-Chim.Sin.(Wuli Huaxue Xuebao)1988,4(2):172-176
[24]Paloma A M,Carla B,Antonio B,et al.J.Am.Chem.Soc.,2013,135:102-105
[25]Cai B,Liu J L,Sheng X L.Inorg.Chem.Commun.,2011,14:1971-1974
