An Improved Phase Correlation Method for Obtaining Dynamic Feature of the Ocean from Sequential SAR Sub-aperture Images
2013-07-25WangXiaoqingSunHaiqingChongJinsong
Wang Xiao-qing*① Sun Hai-qing①② Chong Jin-song①
An Improved Phase Correlation Method for Obtaining Dynamic Feature of the Ocean from Sequential SAR Sub-aperture Images
Wang Xiao-qingSun Hai-qingChong Jin-song
(National Key Laboratory of Science and Technology on Microwave Imaging, Institute of Electronics,Chinese Academy of Sciences, Beijing100190, China)(Graduate University of Chinese Academy of Sciences, Beijing 100049, China)
Dynamic features are important aspects of the ocean. However the dynamic information is lost in most conventional Synthetic Aperture Radar (SAR) image processing methods, because they treat the image as an instantaneous state of the observed area. In fact, we can obtain dynamic features of the ocean from sequential sub-aperture images, because we know that the different parts of the azimuthal aperture correspond to different imaging instances. A key step for retrieving the dynamic features from sequential images is image-matching. However, the heavy noise characteristic of sub-aperture SAR images renders the traditional image-matching methods ineffective. In this paper we propose an image matching method based on improved phase correlation to deal with the heavy noise problem of SAR sub-aperture images. Experimental results show that the improved image-matching method presents an accuracy of 0.15 pixel and noise robustness. The analysis indicates that the improved algorithm is competent for obtaining dynamic information from the medium resolution airborne SAR images or high resolution spaceborne SAR images with 0.15-0.3 m/s estimation precision under most SNR conditions. The improved algorithm was used on an airborne SAR data to retrieve the movement velocity. The retrieved velocity ranged from 0.05-0.5 m/s, which seems to be reasonable value for the ocean current velocity.
Ocean surface dynamic feature; Synthetic Aperture Radar (SAR) sub-aperture image; Image matching; Phase correlation
1 Introduction
Synthetic Aperture Radar (SAR) has its adven- tages of high resolution, wide scale, working on day as well as night and under most weather conditions. It is a significant important sensor in ocean remote sensing field, and has many successful applications on obtaining the ocean feature such as ocean internal wave, wind field. Dynamic features are also important aspects of the ocean. However, the dynamic information is lost in most SAR image processing methods, because they treat SAR image as an instantaneous state of the ocean surface. There are mainly two techniques for obtaining the movement information based on SAR data: (1) one method utilizes the mechanism that the surface current can cause SAR Doppler centroid shift in the single antenna SAR signal; (2) another technique called Along Track Interferomatric SAR (ATISAR), which requires a second receiving antenna, can also calculate the current with much higher resolution than the method based on Doppler centroid shift. The main drawback of these two techniques is that they can only retrieve the current in the SAR look direction but not two-dimension current.
In fact, we indeed can obtain the dynamic information from SAR data by some proper methods because the SAR data reflects the dynamic information during the SAR integral time. From the principle of SAR imaging, we know that the different parts of the azimuthal aperture correspond to different imaging instants. There- fore, using SAR sub-aperture imaging method, we can acquire the sequential SAR sub-aperture images with a short time interval. Then, the ocean surface two-dimensional movement information can be further obtained from these sequential images by some image matching methods. However, the heavy noise characteristic of SAR sub-aperture image renders the traditional image matching method ineffective. Phase correlation method is a very useful high-precise image matching method. Nevertheless, the classic phase correlation method is mainly applied in optical image processing, in which the Signal to Noise Ratio (SNR) is generally higher than that of SAR images. When used for the sub-aperture SAR images with heavy multi- plicative and additive noise, the precision of the classic phase correlation method is rather low. In this paper, an improved phase correlation method is proposed for dealing with the heavy noise problem of SAR sub-aperture images. Simulation experimental results show that, the improved method can raise matching accuracy by dozens of times under low signal-noise ratio condition, and still reach rather high precision when the classic phase correlation method is unable to work properly.
The approach and some simulation experiment of the improved phase correlation method are given in Section 2. And in Section 3, we use the improved algorithm to process an airborne SAR data for obtaining the two-dimensional dynamic feature of the ocean surface. At the end, some conclusions are given in the Section 4.
2 Improved Phase Correlation Method
2.1 Phase correlation method theory
The key point of phase correlation method is to get the movement quantity in spacial domain via phase shift quantity in frequency domain. The most important advantage of phase correlation method is its high precision. It can obtain sub-pixel precision under proper SNR condition.
Supposing a rigid movement vector [,] between sequential imagesandwhereis a rigid movement of,..

then two-dimensionalFourier-Transform ofandhave following relation:
(2)
where(,) is the Fourier-Transform of,andare the image height and width respectively.
The movement vector in spacial domain leads to a linear phase shift in frequency domain. So we can calculate the movement quantity through the phase shift quantity. The element of normalized cross- power spectrum matrixis expressed as below:

A method based on Singular Value Decompo- sition (SVD) is proposed by Hoge for solving the movement vector [,]. He concluded that the high-order singular values in the SVD matrix of the phase matrix reflect image noise, and the low-order singular values correspond to image background. According to Eq. (3), we know the rank of the normalized cross-power spectrum matrixmust be 1. However, because of the noise, the real rank is greater than 1. So we apply SVD on the matrixand use the lowest order singular value to reconstruct the matrix. It is a convenient and noise-robust method for calculating the movement vector [,].
The size of cross-power spectrum matrixis assumed to be(supposing), and the rank ofis supposed to be. The singular value decomposition of a non-square matrix is expressed as:

(5)
The non-zero diagonal elements satisfy:

Then the matrix can be expressed by
(7)
For filtering out the noise, we only reserve the lowest-order singular value and discard other singular values to reconstruct matrix.

Finally, we can use one column of data extracted fromto solveby least square method, as shown in Eq. (9).
(9)

2.2 Error analysis
Since image matrix is discrete signal and there are approximate calculations during the processing, some error exits invetibly in phase correlation method. The error comes mainly from two effects: image boundary effect and image aliasing effect.
Image boundary effect is caused by two- dimensional Discrete Fourier-Transform (DFT). DFT supposes the image are periodical. As a result, the image left-top part is jointed with the right- bottom part, and the left-bottom part is jointed with the right-top part. The discontinuity at the joint position leads to high frequency noise in the frequency domain. This is the image-boundary effect. According to Stone,., an effective way to reduce image boundary effect is to append a Blackman-Harris window (shown in Fig. 1) in spacial domain before DFT.
When the continuous signal is sampled and becomes discrete image signal, this process is similar to passing a low-pass filter. When the sampling rate is smaller than Nyquist frequency, the image aliasing effect happens.
In general, the high frequency components are smaller than lower components, so the aliasing effect is slight at lower frequency and serious at higher frequency, as shown in Fig. 2. Stone,. point out an effective method for suppressing image-aliasing effect: only using the central low frequency region. In general, the effective low frequency region is about 60% of the entire image for optical images, as shown in Fig. 3.
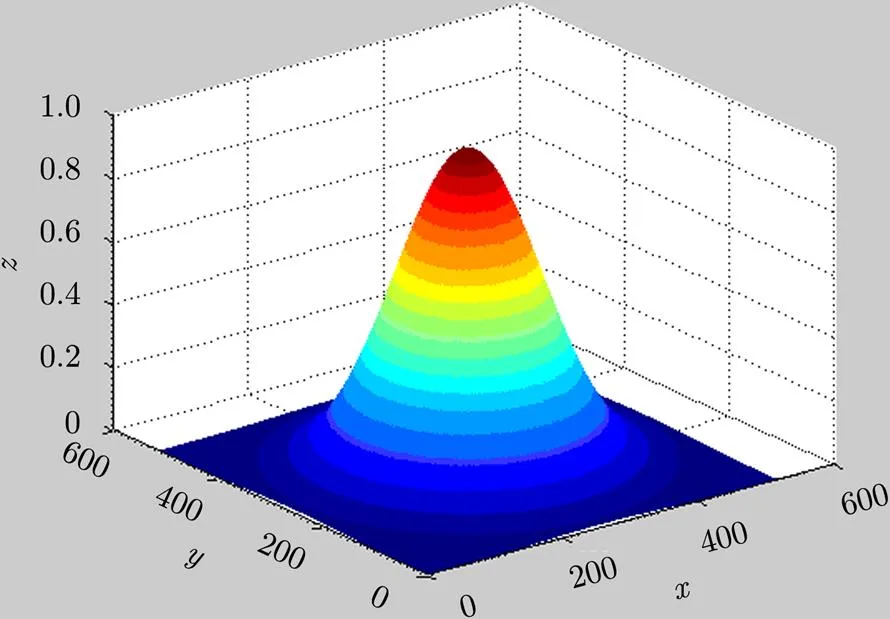
Fig. 1 Blackman-Harris window

Fig. 2 Sketch of image aliasing effect
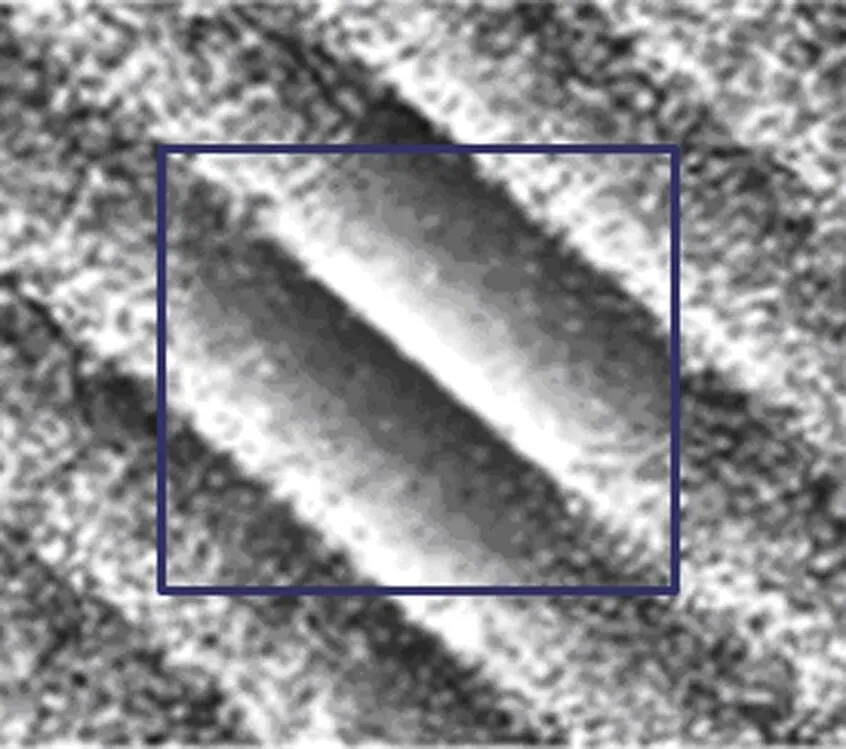
Fig. 3 Cross-power spectrumand the effective region of a typical optical image (blue rectangle)
2.3 The improved phase correlation method
Up to now, the phase correlation method is mainly used in the imaging matching of optical images. Unlike optical imaging sensor, SAR is a coherent imaging sensor in which the coherent speckle noise is inevitable. Furthermore, the speckle noise of sub-aperture SAR image is higher than that of full-aperture SAR image because of its narrower Doppler bandwidth. In addition, the radar backscattering signal of ocean is relatively low, which results in relatively higher additive thermal noise effect. Therefore the noise problem of ocean SAR sub-aperture images is much more serious than that of common optical images, therefore, could lead to more serious aliasing effect. As Fig. 4 shows, Stones’ proposal of effective region parameter “60%” already has included severe aliased region for SAR images, so this algorithm must be optimized for SAR sub-aperture images.

Fig. 4 Several kinds of images’ cross-power spectrum
Because SNR of image affects the aliasing level, the effective region size of “60%” is only suit for common high SNR optical images but not for SAR sub-aperture images. The movement estimation errors, obtained in our simulation experiment, under various effective region and different SNR are shown in Fig. 5.
From Fig. 5, we can see that when the SNR range from 3 dB to 9 dB, the optimal effective region is around 40%. Nevertheless, the estimation error will be much higher if the effective region is set to be 60%, as recommended in Ref. [7]. With the optimal effective region size, the error is about -25 dB, which means the matching accuracy is smaller than 0.06 pixel.
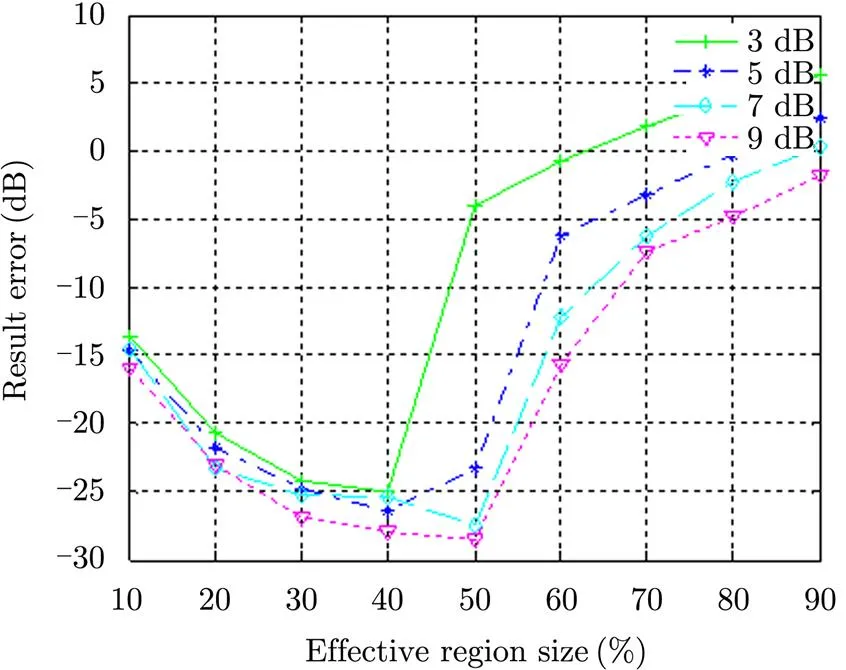
Fig. 5 Movement estimation error under various effective region size and different SNR
In this paper, we will search for an adaptive algorithm for getting the optimal effective region size under arbitrary SNR conditions.
According to Subsection 2.1, the matching problem transforms to an over-determined equation solving problem. In the Eq. (9), after unwrapping operation, a typical column phase data ofdata and a typical row phase data ofare shown in Fig. 6.
First, we use a small central region (in this paper the first small region is set to be 10%) as the original effective region. And then based on the phase data in the small frequency region, we use least square method to fit a straight line, as shown in Fig. 7, the line gradient is the first estimation of the movement vector [,]. Next, we compare the real phase data with the fitted line from centre to edge, if the difference between them is larger than a certain threshold, the effective region stop there. Then we can use the new effective area to repeat the aforementioned operation. After several iterations, we can get the final optimal effective region size.
Furthermore, the phase data in the effective region should not be treated equally because the phase noise intensity is not uniform in the effective region. Fig. 2 shows that the aliasing effect is not same from centre to edge, Thus an appropriate weighting factor should be added to the phase data when calculating the movement vector [,]. Here we use the reciprocal of the noise intensity as the weighting factor. The noise intensity can be approximated by the difference between the fitted line and the real phase data. To suppress the fluctuation, a curve fitting algorithm is used to fit noise intensity curve from the difference between the fitted straight line and the real phase data, which is shown in Fig. 8.
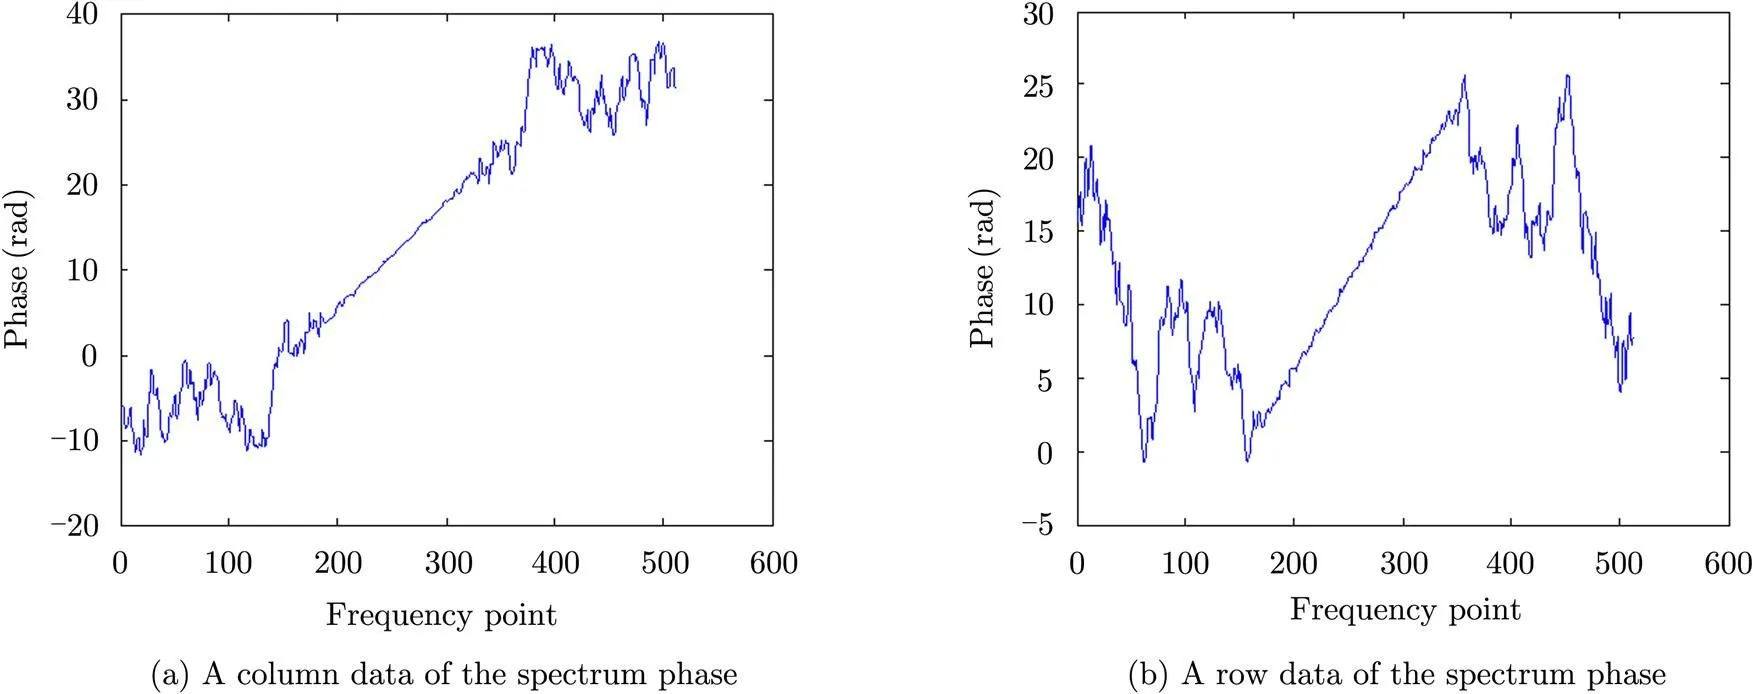
Fig. 6 Spectrum phase
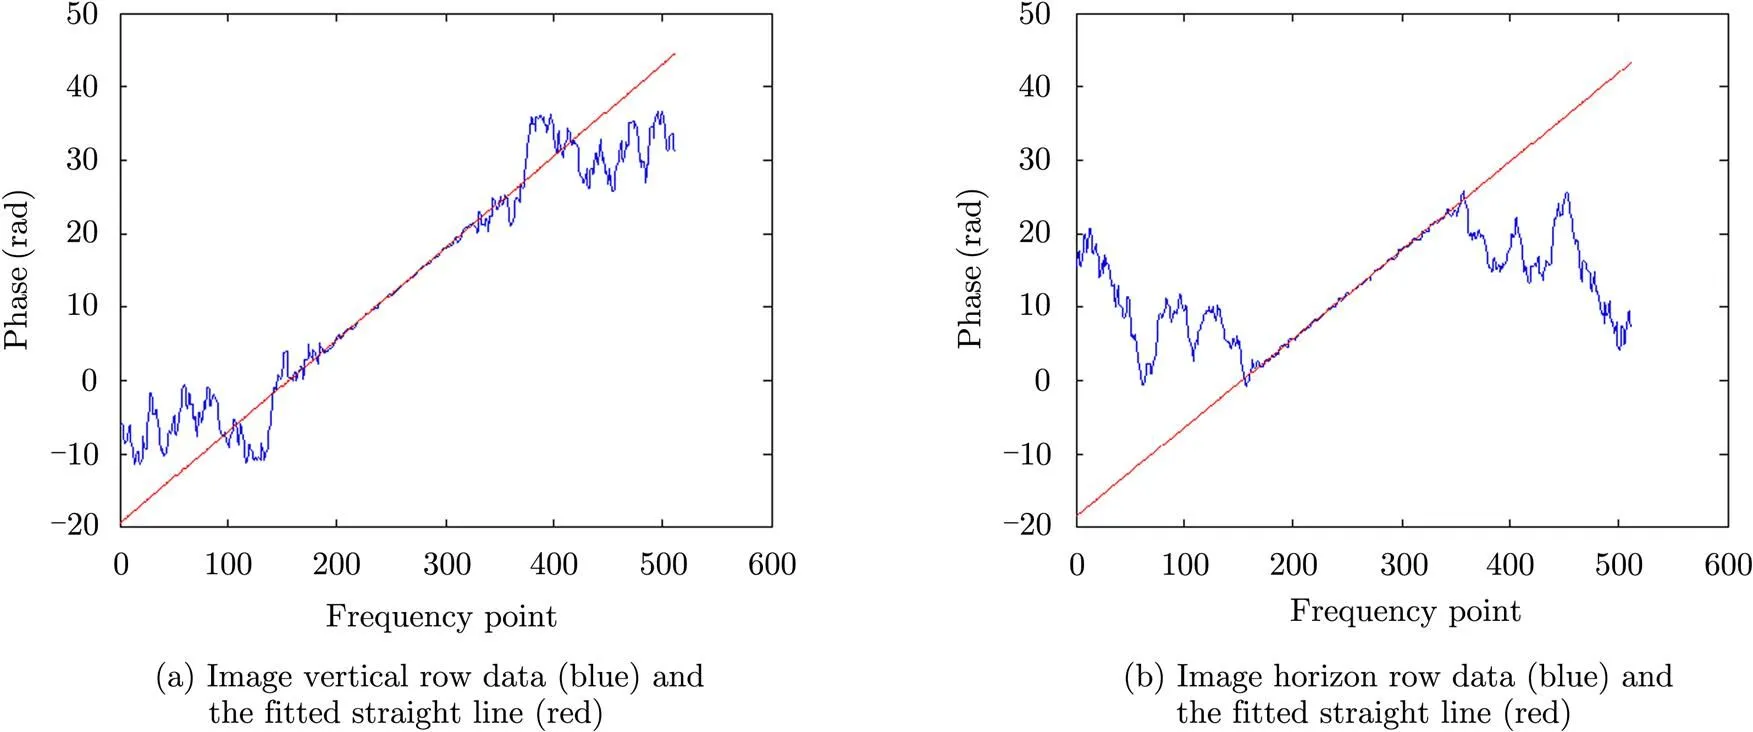
Fig. 7 Spectrum phase and the fitted straight line
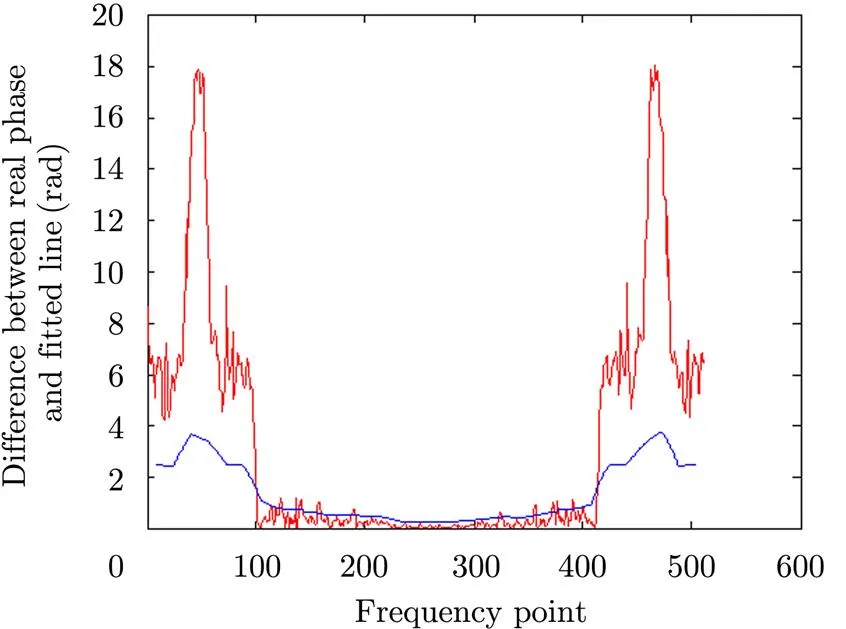
Fig. 8 Difference between the fitted straight line andthe real phase data (red), fitted curve line (blue)
The weighted version of Eq. (9) becomes
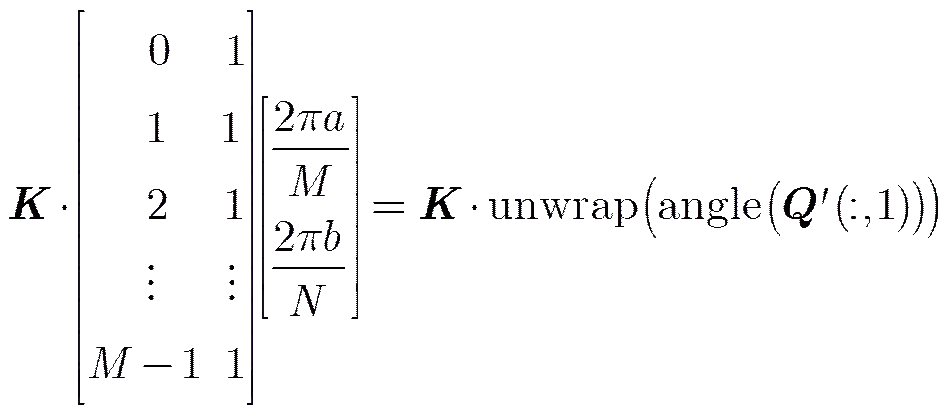
whereis the angular weighting factor matrix
withkdenoting the weighting factor at the-th point.
2.4 Comparison between the improved algorithm and the classic algorithm
The best approach to assess the accuracy of our algorithm is comparing the estimated result with the in-situ measurement. Unfortunately, we have no in-site measurement of the movement in the observed ocean area of the SAR data. Thus, we have to use simulation experiments to evaluate our idea. The simulation experiments include following steps:
Step 1 Select a typical ocean SAR image as the original images;
Step 2 Make a certain shift with the original image to generate a second image;
Step 3 Add noise with different type and intensity to these two images;
Step 4 Use the improved algorithm and the classic algorithm to estimate the relative shift between the two images contaminated by the noise. And then compare the estimated result with the actual shift we set in the second step.
The original image used in the simulation experiments is shown in Fig. 9.
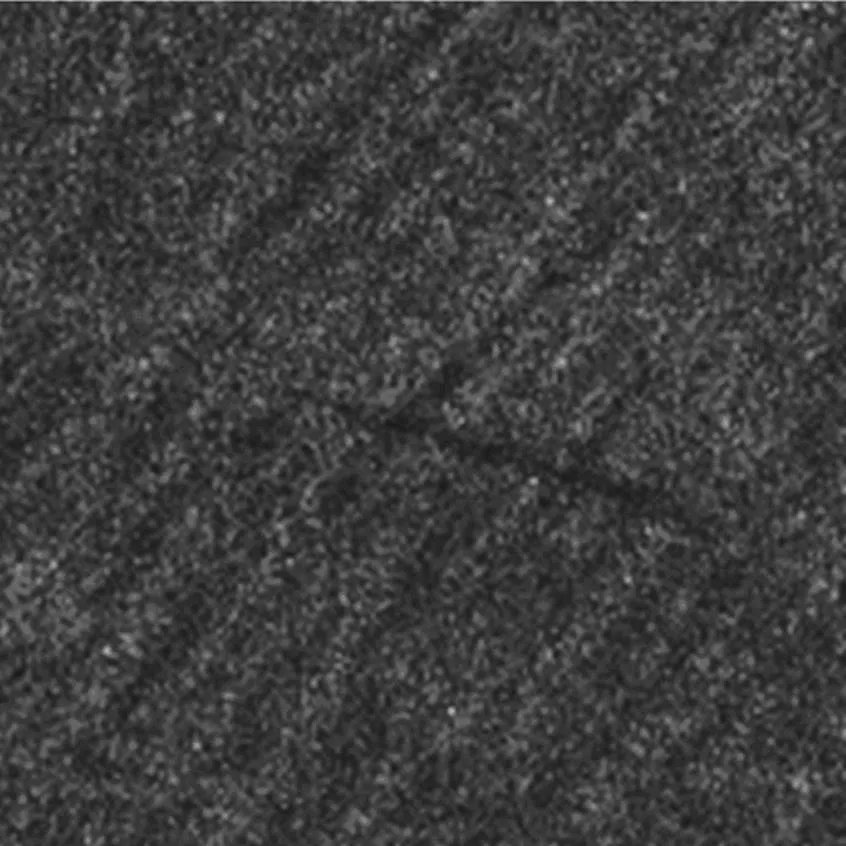
Fig.9 Original image used in the simulation (CIECAS 2003)
The following 3 tables show the standard deviation of the estimation error under different noise intensity and type.
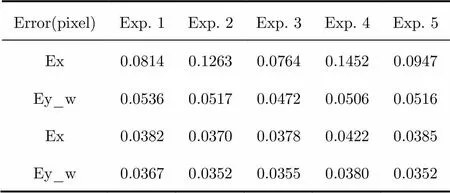
Tab. 1 Estimation error under Gaussian noise with standard deviation of 0.1 (normalized)
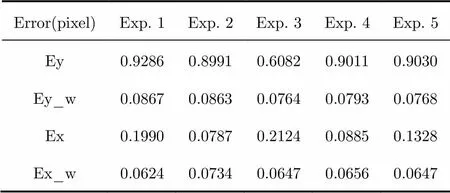
Error(pixel)Exp. 1Exp. 2Exp. 3Exp. 4Exp. 5 Ey0.92860.89910.60820.90110.9030 Ey_w0.08670.08630.07640.07930.0768 Ex0.19900.07870.21240.08850.1328 Ex_w0.06240.07340.06470.06560.0647
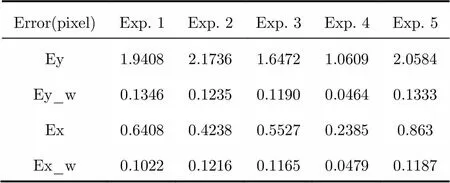
Tab. 3 Estimation error under Gaussian noise with standard deviation of 0.22 (normalized)
In Tabs. 1-3, Ex and Ey refer to the estimation error on theandaxis using classic algorithm, and Ex_w and Ey_w denote the estimation error on theandaxis using the improved algorithm. The numbers of simulation repeat in each experiment is 100.
From Tabs. 1-3, we can see that the estimation error of classic algorithm increases rapidly with increasing noise, while our improved algorithm can keep the estimation error under 0.15 pixel in most cases. Under heavy noise case (Tab. 3), the precise of our improved algorithm is much higher than the classic one. Under low noise condition (Tab. 1), the precision of the improved algorithm even reach about 0.03 pixel order.
For airborne SAR with mediate resolution of 3 -5 m and integral time of 10 s order, the image matching precision of 0.15 pixel can ensure the velocity estimation accuracy of about 0.15 m/s or higher. So the improved algorithm is competent for obtaining dynamic feature with an accuracy of 0.15 m/s accuracy under most SNR conditions.
For spaceborne SAR with medium resolution of 10-20 m and integral time of 1-2 s, only image matching precision of 0.03 pixel can ensure the accuracy of 0.3-0.6 m/s estimation accuracy. As to the high resolution spaceborne SAR such as RADARSAT-2 (the resolution is about 3 m, and the integral time is about 3 s), the image matching precision of 0.15 pixel can ensure an accuracy of 0.3 m/s or higher. In other words, the improved algori- thm is applicable for obtaining dynamic feature from medium resolution spaceborne SAR image only under high SNR condition, and from high resolution spaceborne SAR image under most SNR conditions.
3 Matching Sub-aperture Sequential Images
As an example, we use an airborne SAR data to test the improved algorithm. The airborne data was obtained in 2003 with resolution of 5.4 m(azimuth direction)*4.5 m(range direction) by the L band SAR of the Institute of Electronics, Chinese Academy of Science (IECAS).
The data processing includes following steps:
Step 1 Dividing the Doppler spectrum of SAR raw data into two parts and re-imaging these two parts, we can get two sub-aperture sequential images;
Step 2 Divide these two sub-aperture images into small girds (in this examples, the gird size is 128×128 pixels)
Step 3 Matching the corresponding grids of the two sub-aperture images by the improved method, we can get the relative shift of every grid between the two sub-aperture images.
Step 4 Multiplied by the pixel size and divided by the time interval between the two sub-aperture images, we can get the movement velocity of each grid from the relative shift.
The time interval between the sub-aperture images is about 8 s. Thus, to reach a movement accuracy of 0.2 m/s, the image matching error must be lower than 0.15 pixel, which can be satisfied by the improved algorithm in most case. The surface dynamic feature obtained from the airborne SAR of IECAS is shown in Fig. 10.
For example, the computed velocity of 25 grids in this image are shown in Tab. 4
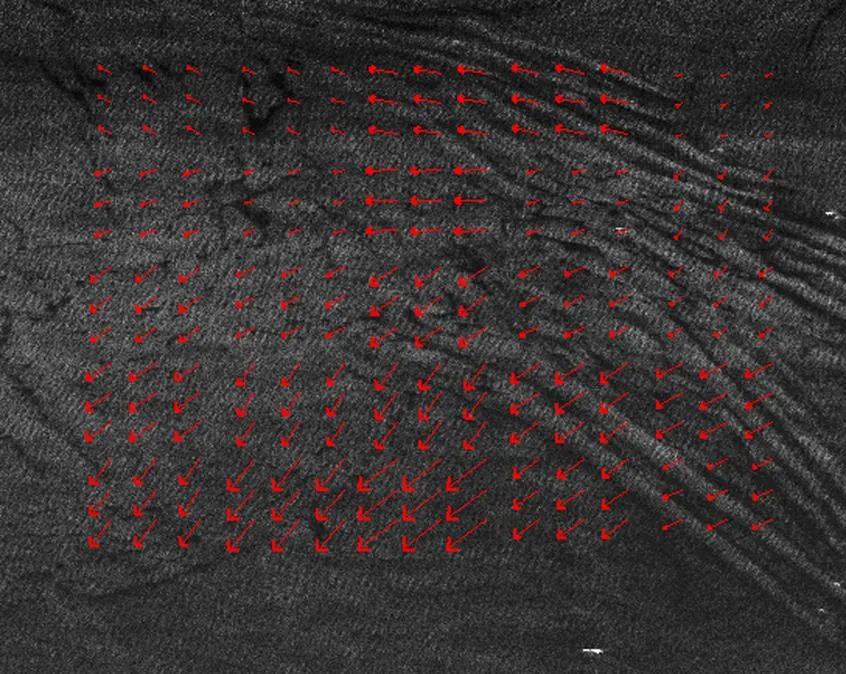
Fig. 10 Ocean surface dynamic feature obtained from airborne SAR of IECAS (C IECAS 2003)
Tab. 4 The computed velocity vector of 25 grids (m/s)

Number of rowNumber of colum 12345 1[-0.07,-0.16][-0.04,-0.14][-0.05,-0.35][-0.06,-0.35][0.04,-0.06] 2[0.05,0.20][0.04,-0.12][0.01,-0.39][0.03,-0.13][0.10,-0.08] 3[0.16,-0.26][0.10,-0.22][0.19,-0.33][0.09,-0.24][0.10,-0.14] 4[0.19,-0.33][0.25,-0.20][0.28,-0.26][0.21,-0.36][0.15,-0.33] 5[0.28,0.26][0.33,-0.32][0.32,0.49][0.19,-0.33][0.09,-0.24]
In Tab. 4, the estimated velocities range from 0.05 m/s to 0.5 m/s, which seems to be a reasonable value of the ocean current. Unfortunately, we have no in-situ measurement to validate the estimated velocity.
4 Conclusions
We can obtain ocean dynamic feature from sequential sub-aperture SAR images, because we know that the different parts of the azimuthal aperture correspond to different imaging instants. Image-matching is a key technique for retrieving the movement information from sequential images. In the image matching methods, the phase correlation method is a widely used and high- precision method. However, the classic phase correlation method is mainly used in optical image with relatively high SNR. When used for sub- aperture SAR images with heavy noise, theprecision of classic phase correlation method is rather low. In this paper, an improved phase correlation method is proposed for dealing with the heavy noise problem. The simulation results show that the improved algorithm can get much higher estimation precision than the classic algorithm especially under rather low SNR conditions. The estimation precision of the improved algorithm is smaller than 0.15 pixel under most cases, and reaches 0.03 pixel under high SNR condition. The analysis indicates that the improved algorithm is competent for obtaining the dynamic information from the medium resolution airborne SAR image or high resolution spaceborne SAR image with 0.15-0.3 m/s velocity precision under most SNR conditions. We use the improved algorithm to obtain the dynamic feature from an airborne SAR data, acquired by a L band airborne SAR of IECAS. The retrieved velocity ranges from 0.05-0.5 m/s, which seems to be a reasonable value of ocean current velocity.
[1] Van der Kooij M, Hughes W, and Sato S. Doppler current velocity measurements: a new dimension to spaceborne sar data [OL]. http://atlantisscientific.com/eoserv.html, 2001.
[2] Johannessen J A, Chapron B, Collard F,.. Direct ocean surface velocity measurements from space: improved quantitative interpretation of Envisat ASAR observations[J]., 2008, 35(10), L22608, doi: 10.1029/2008GL035709.
[3] Johannessen J A, Kudryavtsev V, Chapron B,.. Backscatter and doppler signals of surface current in SAR images: a step towards inverse modelling[C]. Proceedings of SEASAR 2006, ESA/ESRIN, Frascati, Jan. 2006: 23-26.
[4] Hansen M W, Kudryavtsev Chapron V B, Johannessen J A,.. Simulation of radar backscatter and Doppler shifts of wave–current interaction in the presence of strong tidal current[J]., 2012, 120(1): 113-122.
[5] Rossi C, Runge H, and Breit H. Surface current retrieval from TERRASAR-X data using Doppler measurements[C]. IEEE Geoscience and Remote Sensing Symposium, Munich, German, July 2012: 3055-3058.
[6] Kersten P R and Jansen R W. Estimating surface water flow speeds using time-frequency methods[J]., 2010, (4): 406-412.
[7] Graber H C, Thompson D R, and Carande R E. Ocean surface features and currents measured with synthetic aperture radar interferometry and HF radar[J]., 1996, 101(C11): 25,813-25,832.
[8] Romeiser R, Breit H, Eineder M,.. Current measurements by SAR along-track interferometry from a space shuttle[J]., 2005, 43(10): 2315-2324.
[9] Romeiser R and Runge H. Theoretical evaluation of several possible along-track InSAR modes of TerraSAR-X for ocean current measurements[J]., 2007, 45(1): 21-35.
[10] Romeiser R, Suchandt S, Runge H,.. First analysis of TerraSAR-X along-track InSAR-Derived current fields[J]., 2010, 48(2): 820-829.
[11] Hoge W S. A subspace identification extension to the phase correlation method[J]., 2003, 22(2): 277-280.
[12] Stone M, Orchard E C, and Chang S M. A fast direct Fourier- based algorithm for sub-pixel registration of images[J]., 1998, 20(10): 2235-2243.
[13] Foroosh H, Zerubia J B, and Berthod M. Extension of phase correlation to sub-pixel registration[J]., 2002, 11(3): 188-200.
[14] Belongie S, Malik J, and Puzicha J. Shape matching and object recognition using shape contexts[J]., 2002, 24(4): 509-522.
[15] Huang L and Li Z. Feature-based image registration using the shape context[J]., 2010, 31(8): 2169-2177.
从SAR子孔径序列图像中提取海洋动态特征的改进相位相关法
王小青孙海清种劲松
(中国科学院电子学研究所微波成像国家重点实验室 北京 100190)(中国科学院大学 北京 100049)
动态特征是海洋信息中的重要方面。但是在通常的SAR图像处理中动态信息往往会被丢失,因为这些方法大多把SAR图像看成是观测区域的瞬时状态。实际上,我们可以从SAR子孔径序列图像中获取动态信息,因为我们知道SAR不同方位向孔径对应不同的成像瞬间。从序列图像中获取动态信息的一个关键步骤就是图像匹配。但是SAR子孔径图像的强噪声特性使得传统的图像匹配算法难以奏效。该文中,为了应对SAR子孔径图像中的噪声问题,我们提出了一种改进的相位相关法。仿真实验表明改进的算法在多数情况下都可以达到0.15像素以上的精度以及很好的噪声鲁棒性。分析表明,该方法可以适用于从中等分辨的机载SAR图像和高分辨的星载SAR图像中提取动态特征,速度提取精度可以达到0.15-0.3 m/s。该文将该方法用于一个实际的机载SAR图像的处理,反演的海面动态速度在0.05-0.5 m/s左右,这个速度范围符合海面上一般的流速范围。
海洋面动态特征;SAR 子孔径图像;图像匹配;相位相关
TN957.52
A
2095-283X(2013)01-0030-09
Wang Xiao-qing.E-mail: huadaqq@126.com.
CLC index: TN957.52
10.3724/SP.J.1300.2013.13016
Manuscript received February 28, 2013; revised March 22, 2013. Published online March 27, 2013.
Supported by the National Natural Science Foundation of China (No. 41276185).
Wang Xiao-qing was born in 1978. He received his Ph.D. degree from the Institute of Electronics, Chinese Academy of Sciences in 2006. He is currently an associate research fellow with the Institute of Electronics, Chinese Academy of Sciences. His research interests are SAR signal and marine information processing.E-mail: huadaqq@126.com

Sun Hai-qing was born in 1989. She received her Master degree from the Institute of Electronics, Chinese Academy of Sciences in 2012. She is currently an engineer in Micro- soft Corporation. Her research interests is image processing.E-mail: haiqingsun2010@gmail.com
Chong Jin-song was born in 1969. She received her Ph.D. degree from the Institute of Electronics, Chinese Academy of Sciences in 2003. She is currently a research fellow with the Institute of Electronics, Chinese Academy of Sciences. Her research interests are SAR signal and marine information processing.E-mail: chongjinsong@sina.com
