Investigation on transformation process of trip mode choicefor planned special events
2013-01-08WuJiaorongWangChenChenFeiChenXiaohong
Wu Jiaorong Wang Chen Chen Fei Chen Xiaohong
(School of Transportation Engineering, Tongji University,Shanghai 201804, China)
A planned special event (PSE) is defined as a public activity with a scheduled time, location, and duration that may impact the normal operation of the surface transportation system due to the increased travel demand and/or reduced capacity attributed to event staging[1]. While the definition of the PSE varies from city to city in China, the PSE concentrated on in this study is defined as a world-class public activity with a long duration, multiple venues, ultra-large scale, numerous participants such as Olympic Games, World Expo, World Cup and so on. One of the distinguishing attributes of a PSE is that a large number of passengers are expected to be carried, combined with a congested road network and limited parking space, which makes it difficult to use private vehicles during such planned special events.
The Expo 2010 Shanghai venues are located in the south of the city center, where daily traffic demand has already exerted a large pressure on the transportation system. According to the SP survey in 2005, more than 52% of the visitors preferred to travel by car and only 43% of the visitors tended to choose a public transport mode. In this case the road capacity around the Expo venues was inadequate to meet the abnormal increase in the traffic demand of cars and would lead to serious congestion. Therefore, how to guide the transformation of trip mode choice to divert visitors from cars to public transport modes was an important transportation research issue for the Expo 2010.
Traffic demand management is a commonly used technique to suppress the car travel demand. The incentive-based policies and command-and-control policies are available for urban transportation operations and management[2]. The incentive-based policies can be used in combination with taxes and fees to compensate for the difference between individual costs and social costs. Command-and-control policies are mandatory, aiming to force the consumers and providers of transportation services to change their behavior. And previous researches focus more on the impacts of the incentive-based policies on daily trip mode choices, and few pieces of research offer an in-depth analysis of the impacts and the intervention processes of transportation management policies on visitors’ travel behavior during planned special events[3-5]. In recent years, some domestic scholars have already begun to pay attention to the successful experience of transportation management measures and the impact of traffic demand management on transportation modes during special events[6-9]. However, these researches do not provide a method of decision-making on transportation management measures during special events, and the impact of transportation management strategies on the transformation of multi-mode transportation has received relatively little attention in previous research.
This paper adopts the objective-oriented stated preference (SP) survey questionnaire design method with additional questions to get visitors’ stated mode choice data in the intervention-guidance process; uses the structural equation model approach to analyze the dynamic mechanism of trip mode choice and difference between the objectives and the survey results, and then adjusts the transportation management measures and planned transport service system for the Expo 2010 Shanghai. Based on the above analysis and feedback test, this paper aims at establishing a goal difference-feedback-adjustment-intervention-guidance cycle progression analysis method, and provides insights for establishing effective traffic management policies for future PSEs.
1 Methodology
1.1 Objective-oriented SP survey framework
The difference seeking and the feedback analysis are the key parts of the transportation management measures decisions for the PSE. SP surveys are frequently adopted for the analysis of the impacts of transport policies on travel behavior, which can provide the possibility for the evaluation and adjustment of transportation management measures. In addition, the important element of the feedback analysis is the value of objective (trip mode shares) at the starting point, which is set based on the road capacity and the acceptable transport service level for participants. For example, the goal set in this paper is that the average saturation degree of roads around the venue is less than 0.7 during the Expo 2010 Shanghai. In view of the research objective and the advantages of SP surveys, we suggest the objective-oriented SP surveys framework as shown in Fig.1, depending on whether the survey result is close to the value of objective set at the starting point in different stages and on the effectiveness of adjusting transportation management measures to narrow the difference gap. The objective-oriented SP surveys can provide the data and information required for the difference seeking and feedback analysis in different stages. Since the survey objective in every stage is different, additional questions in the design phase allow us to assess the effects of transportation management measures on travel behavior at every stage and adjust the measures at the next stage.

Fig.1 Objective-oriented SP surveys framework
1.2 Variables
There are many influencing factors of travel behavior besides transportation management measures[10-14], and the influence factors of commuting trips and special event trips are quite different. The travel behavior of commuters is mainly affected by individual attributes, socio-demographic attributes, travel habits and travel characteristics. While the travel behavior of visitors to a special event is mainly affected by the location of the event and visitor trip origins, followed by travel characteristics, there is, however, not much literature on the inter-actions between the factors influencing the travel behavior of visitors to a special event and the goals set in the transportation management plan for the special event.
According to the previous research on the factors influencing travel behavior, the main influencing factors of visitor trip mode choices at special events consist of two types: macro and micro ones. Macro factors have indirect impacts on visitors, including transportation management measures, the transportation supply system, climate and weather conditions, geographical conditions of event venues and special event characteristics. Micro factors vary from one individual to another, including individual attributes (e.g. trip origin, gender, age, job etc.), socio-economic attributes (e.g. income, car ownership et al.), travel characteristics (e.g. travel distance, cost constraints etc.) and companion attributes (e.g. the number of companions, the relationship between companions etc.).
1.3 Structural equation model
A structural equation model (SEM) is adopted to capture the latent relationships among variables, which is an effective approach to analyze the complex relationship among the various variables. This paper tries to explore the impact of a large number of factors on trip mode choice, especially the feedback analysis of transportation demand management measures by using the SEM.
The SEM can handle a large number of endogenous and exogenous observed variables simultaneously, and, furthermore, it can include latent variables in the model. An SEM with latent variables has three components: 1) A measurement model for the endogenous variables (Ymeasurement model); 2) A measurement model for the exogenous variables (Xmeasurement model); and 3) A structural model[15](see Fig.2). Latent variables are specified as linear combinations of the observed variables. In general, an SEM can have as many endogenous and exogenous variables as are desired. An SEM structural model is used to capture the causal influences of the exogenous variables on the endogenous variables and the causal influences of endogenous variables upon one another. The structural parameters include three coefficientsβ,γandλ. Theβcoefficients are the direct effects among endogenous latent variables and theγcoefficients are the regression effects for exogenous latent variables on endogenous latent variables. Theλcoefficients are linkings between the latent and observed variables.
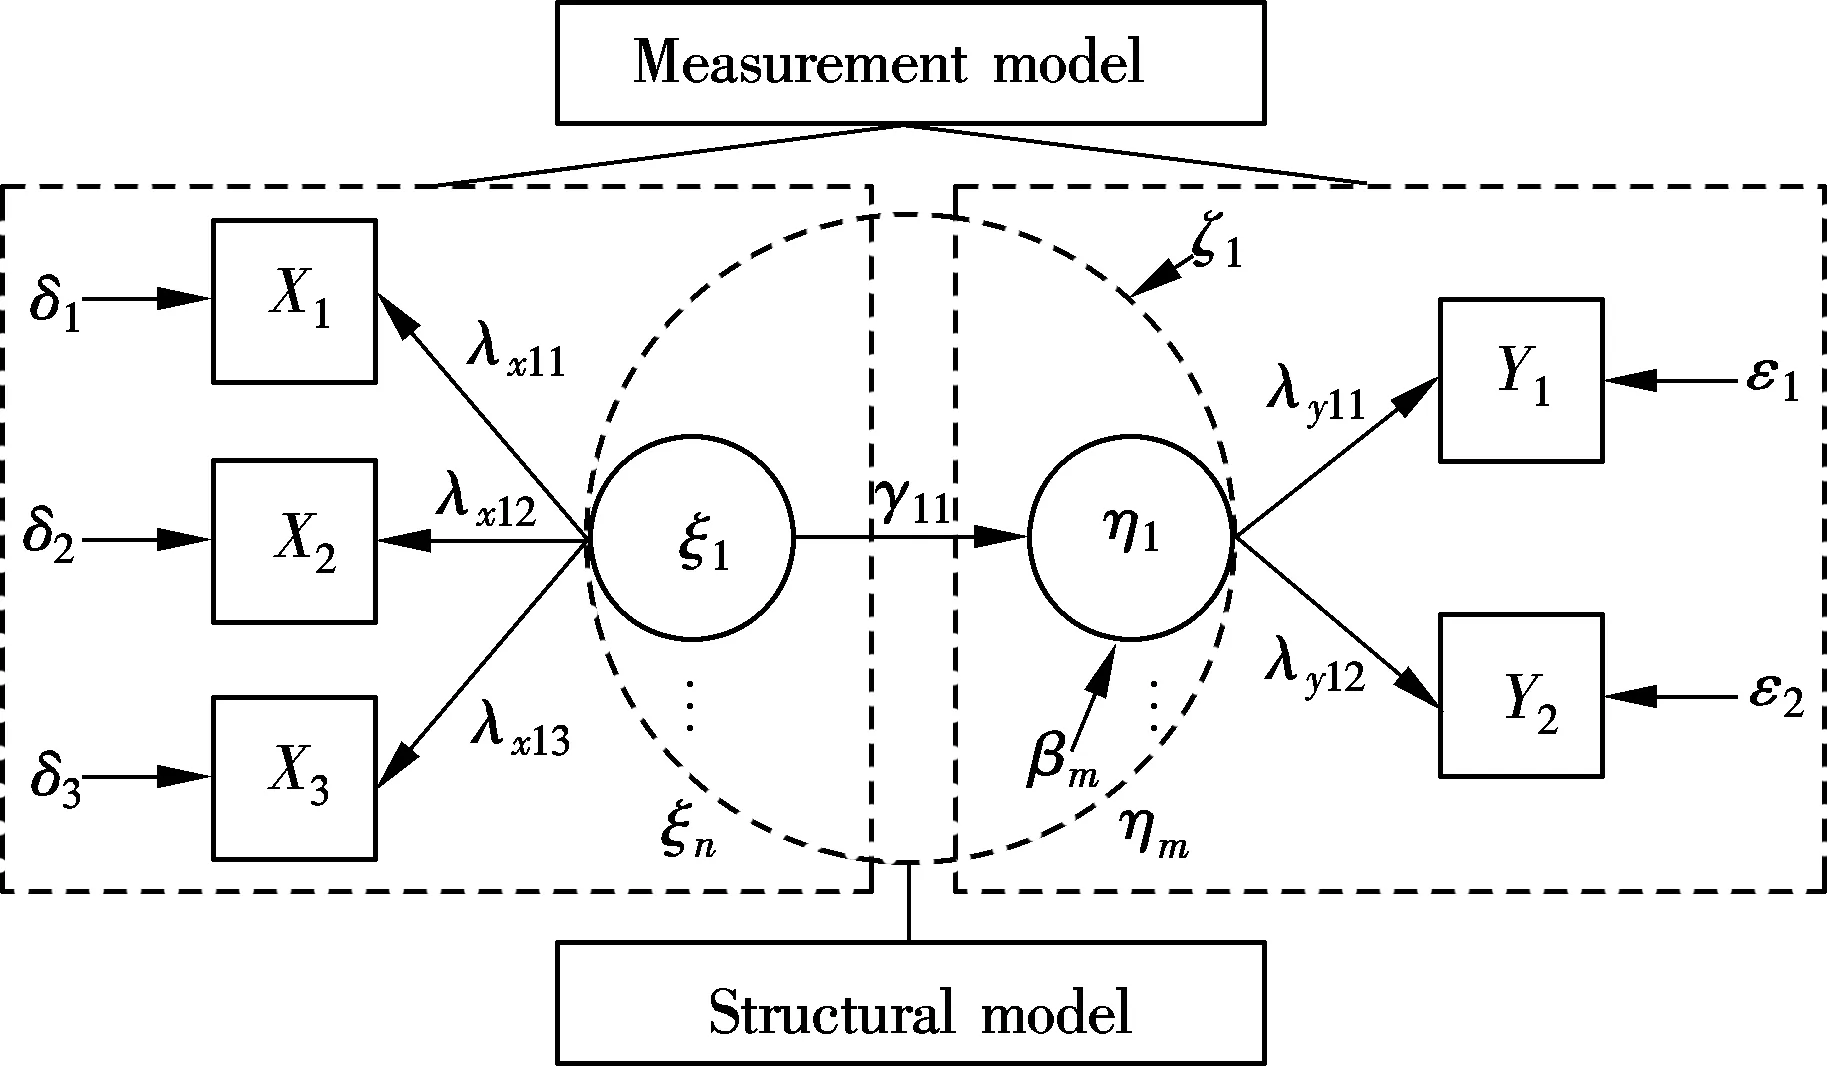
Fig.2 An example of structural equation model[15]
Macro factors and micro factors are major factors determining the trip mode choice. However, we should further simplify the influencing factors so that we can capture the most significant factors. Based on our previous study, a multinomial logit model of trip mode choice is estimated on a data set from the SP survey of the Expo 2010 Shanghai, which shows that the individual attributes, socio-economic attributes, travel characteristics attributes, companion attributes and transport policy are key factors that influence the trip mode choice behavior in special event travel decision-making. Therefore, this paper chooses these key factors as the endogenous variables and exogenous variables of the structural equation model (see Tab.1).

Tab.1 Summary of variables
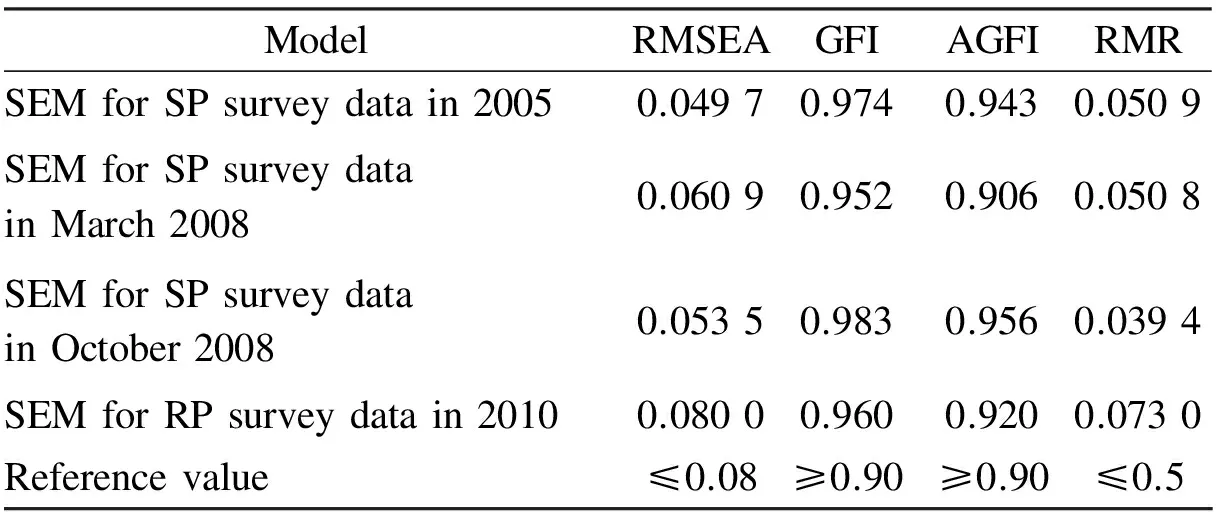
The SEM is carried out using covariance (structure) analysis, where model parameters are determined by the variances and covariances of the variables implied by the model system being as close as possible to the observed variances and covariances of the sample. The LISREL Version 8.51 and PRELIS/SIMPLIS software are used to estimate the model in this research. Many criteria are developed for assessing the overall goodness-of-fit of the SEM. Most of these evaluation criteria are based on the chi-square statistic given by the product of the optimized fitting function and the sample size. Goodness-of-fit measures for a single model based on chi-square values include: 1) Root mean square error of approximation (RMSEA). It measures the discrepancy per degree of freedom, and it is generally accepted when the value of RMSEA for a good model is less than 0.08; 2) The root mean square residual (RMR, or average residual value); 3) The goodness-of-fit index (GFI); 4) The adjusted goodness-of-fit index(AGFI). It adjusts the GFI for the degrees of freedom in the model. Most programs calculate several of these indices using the definition of an independence (null) model with no restrictions. Using such a baseline, a rule of thumb for most of the indices such as AGFI and GFI is that a good model should exhibit a value greater than 0.90. Although there are many goodness-of-fit measures, the assessment of fit cannot rely on single criteria. Although no consensus has been reached (i.e. no single goodness-of-fit measure has been shown to be superior to the others), experts in the field recommend that a variety of measures should be used to assess model fit[16]. Most SEM software packages present numerous goodness-of-fit measures as parts of their standard reporting.
2 Data and Case Analysis
The Expo 2010 Shanghai, China is undoubtedly a successful case. In 2005, the Conceptual Transportation Plan for the Expo 2010 Shanghai proposed the transport system planning objectives that the public transport mode share should reach 87%; the car (including taxi) mode share should be about 7%, and all other modes share should be 6% or so. In the central urban area of Shanghai in 2005, the public transit mode share among all commuting trips was 40.2%, which is 47% lower than the objective, and the car mode share was 20.4%, which is 13% higher than the objective. Meanwhile, the congested road network and limited parking spaces have already made it difficult to use private vehicles. Through continuous adjustments of transportation management measures and facilities construction, the public transport mode share is 88.6%, slightly higher than the desired objective for the duration of the Expo 2010 Shanghai, which ultimately ensured that the activities in the special event took place efficiently and the traffic operated in a well-organized manner in the central urban area. A total number of 73 084 400 people visited the Expo site for a duration of 184 d, and the maximum daily peak attendance exceeded 1 030 000.
This paper is based on five surveys based on the Expo 2010 Shanghai visitor trip mode choices in July 2005, March 2008, October 2008, May 2010 and October 2010. The first three surveys are SP surveys and the last two surveys are RP surveys. Micro factors are consistent among the five surveys, which include individual attributes, socio-economic attributes and companion attributes. However, the macro factors in these surveys differ significantly. The changes in transport policies and facility construction at different stages is shown in Tab.2. In this paper, the types of trip mode are divided into three, namely public transport, car and others. The public transport mainly includes bus, rail transit and tour bus. The car mode includes private car and taxi. Non-motor vehicle, walking, and ferrying belong to other modes. A summary of the five objective-oriented SP surveys of the Expo 2010 Shanghai is presented in Tab.2.
The objective value of Expo visitors’ transport mode share proposed in 2004 and the car and public transport shares in the five surveys are shown in Fig.3. As shown in Fig.3, the closer to the Expo 2010, the closer the car share and that of public transport share meet the desired values. At the end of the Expo in October 2010, the actual transport mode shares basically met the planned objectives.

Tab.2 Summary of survey questions in five objective-oriented surveys

Fig.3 Trends of visitors’ trip mode choice behavior shown in the five surveys
3 Estimation Results of SEMs
According to the time of the surveys (2005, 2008 and 2010) and the survey types (SP or RP), we divide the survey data into four groups and construct the structural model for each group, respectively. We further confirm the effectiveness of transportation management measures by comparing the choice patterns between the “before” and “after” stages of the adjustments in these measures. According to the survey feedback of the previous stage, some transportation management measures have been adjusted before implementation. Based on the five survey data of the Expo visitors’ trips, 11 factors are initially selected as the exogenous variables of the SEM (see Tab.1). The SEMs constructed in LISREL version 8.70 is shown in Figs.4 to 7. Tab.3 presents a brief summary of goodness-of-fit measures for each of the four models. The goodness-of-fit measures for the four models indicate that the overall fit of the models is good and the SEM is effective. The absolute value of the path coefficients indicates the impact of factors on trip mode choice behavior, and the negative value suggests the negative impact. If the absolute value of the path coefficient decreases, the impact of the factors is weakened due to the changes in transport management measures and the transport service system at different stages.
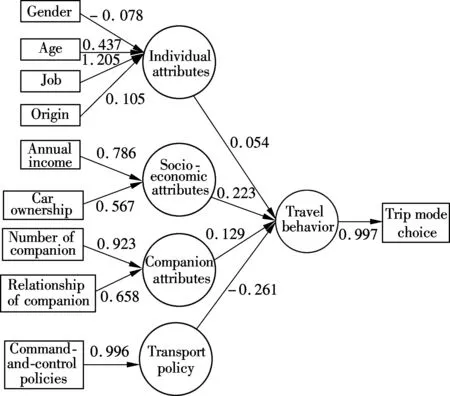
Fig.4 Model structure and estimated coefficients for the SP survey in 2005
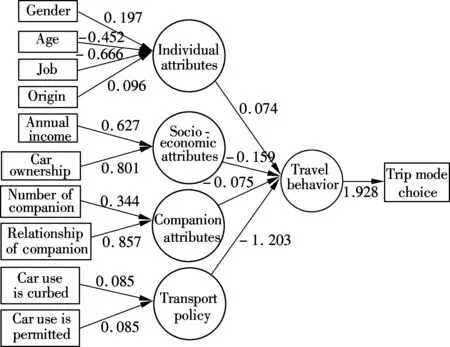
Fig.5 Model structure and estimated coefficients for SP survey in March 2008

Fig.6 Model structure and estimated coefficients for the SP survey in October 2008
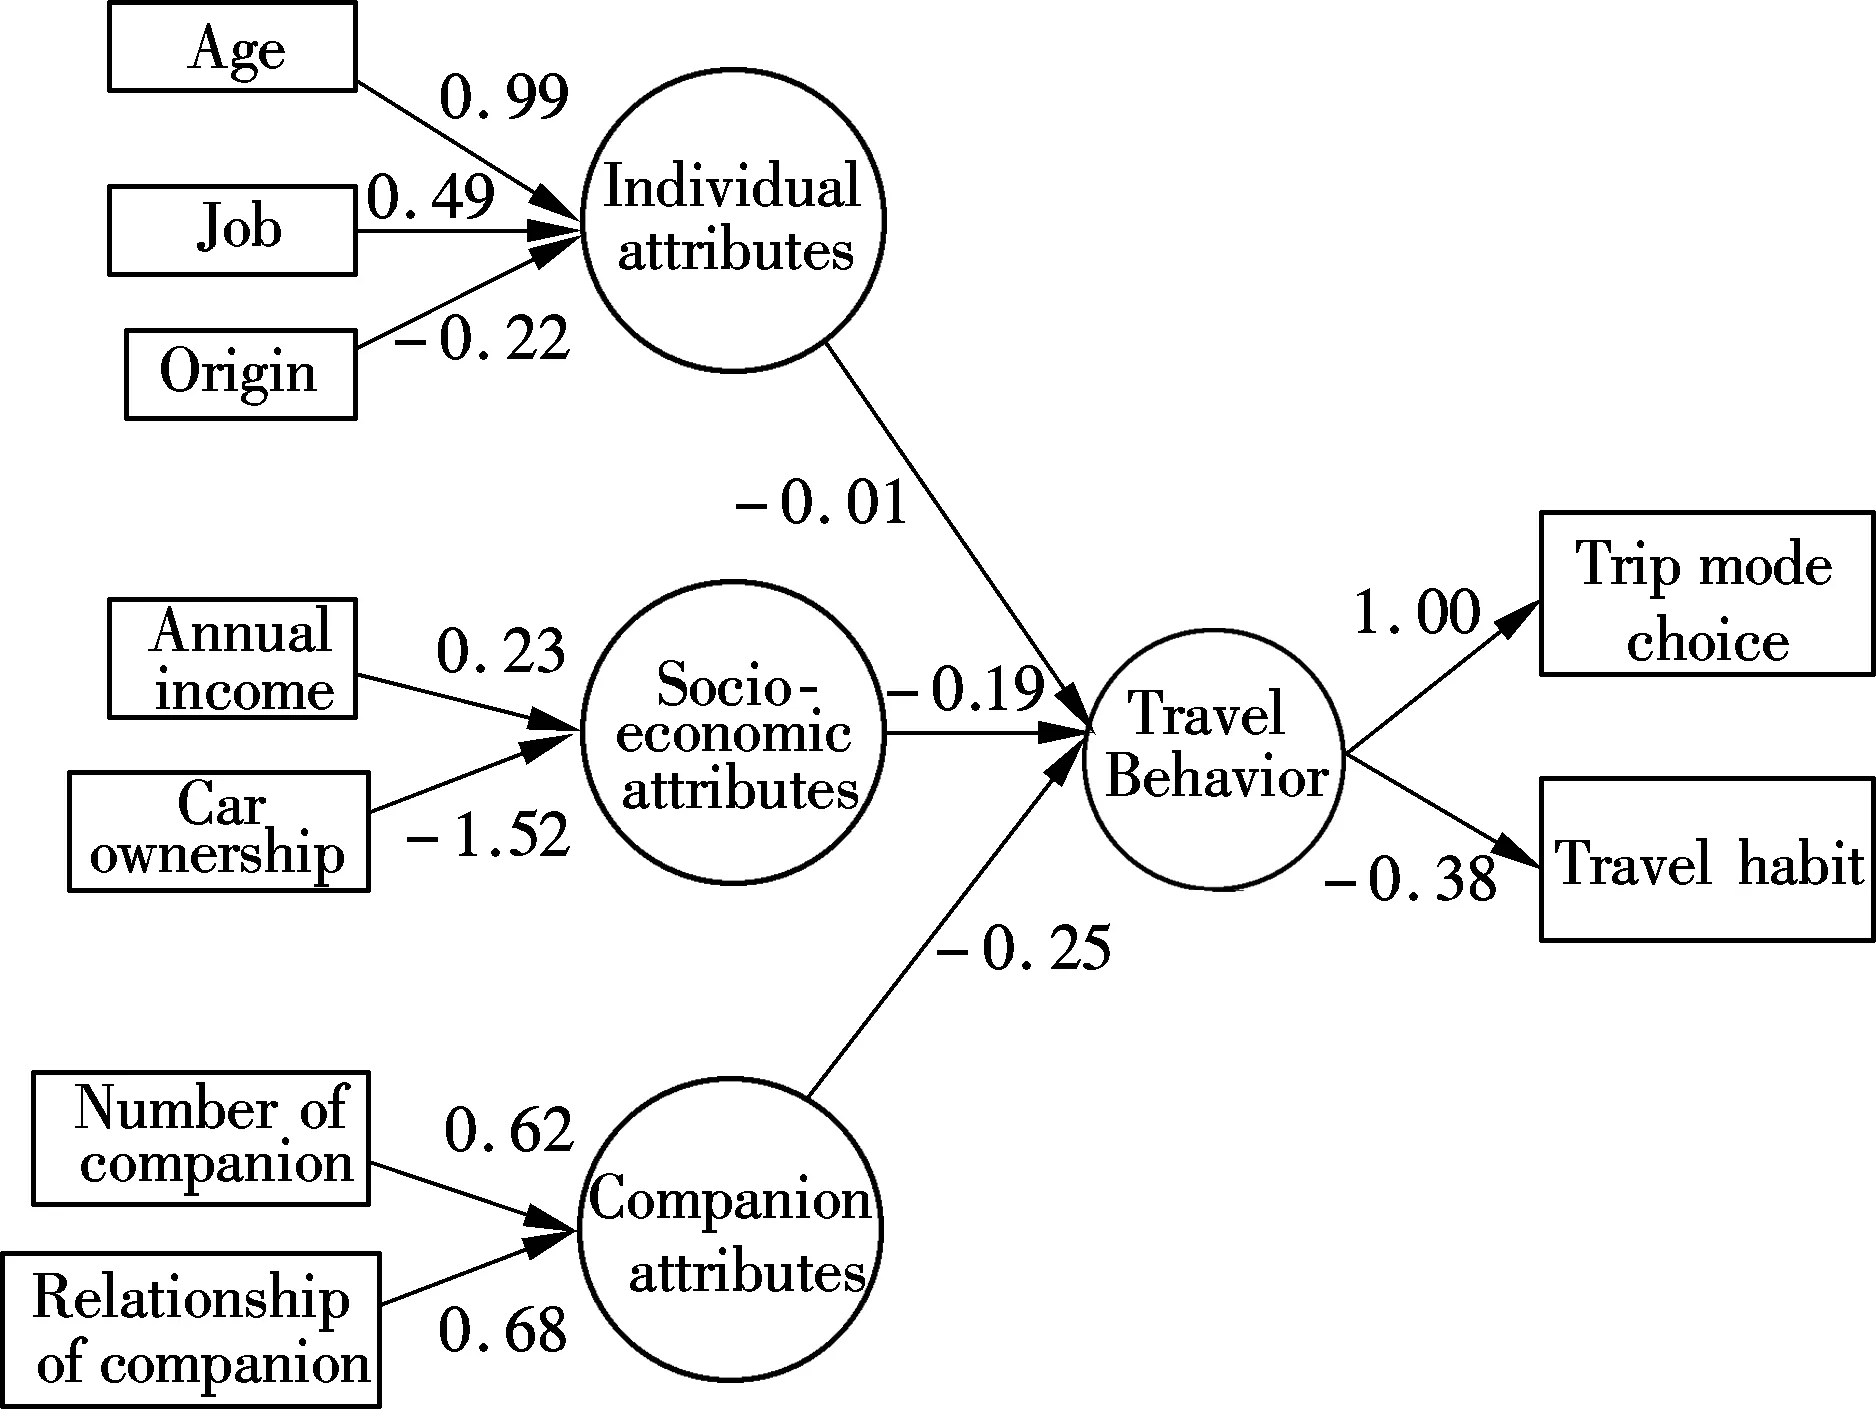
Fig.7 Model structure and estimated coefficients for the RP survey in 2010
Tab.3 Goodness-of-fit measures
4 Discussion
4.1 Impact of visitors’ trip origins on trip mode chain choices
The trip origins of visitors to a planned special event can be widely distributed. We divide the visitors into two types:local and nonlocal. Local visitors are the people living in Shanghai, while nonlocal visitors come from other cities. The nonlocal visitors mainly consist of Chinese visitors, because the visitors from other countries only accounted for a small part of the sample. And the survey results suggest that the proportion of nonlocal visitors in the Expo 2010 Shanghai is 68%. Based on the fitting results of structural equation models for different stages, we find that the effects of visitors’ origins increase significantly in real travel behavior (The path coefficient is -0.22 in Fig.7). The alteration of nonlocal visitors’ trip modes choices (here tour bus and car only) is shown in Fig.8. After a series of regulatory guidance policy measures are implemented one by one, the tour bus share has risen from 13.1% to 41.0% and the car share has reduced from 55.4% to 9.8%. Since nonlocal visitors are not very familiar with the transportation system in Shanghai, they are inclined to choose nonstop modes of transportation. The results of the SP survey in 2005 indicate that nonlocal visitors preferred direct access to the Expo site by car. The implementation of the command-and-control policy reduced car use and enhanced the attractiveness of the tour bus for nonlocal visitors. The proportion of tour bus trips exceeded 20.0% in 2008. With the introduction of newly-planned transportation management measures and the improvement of the public transport system, part of the visitors chose tour bus instead of car, and actually the tour bus became the main trip mode for nonlocal visitors during the Expo 2010 Shanghai.
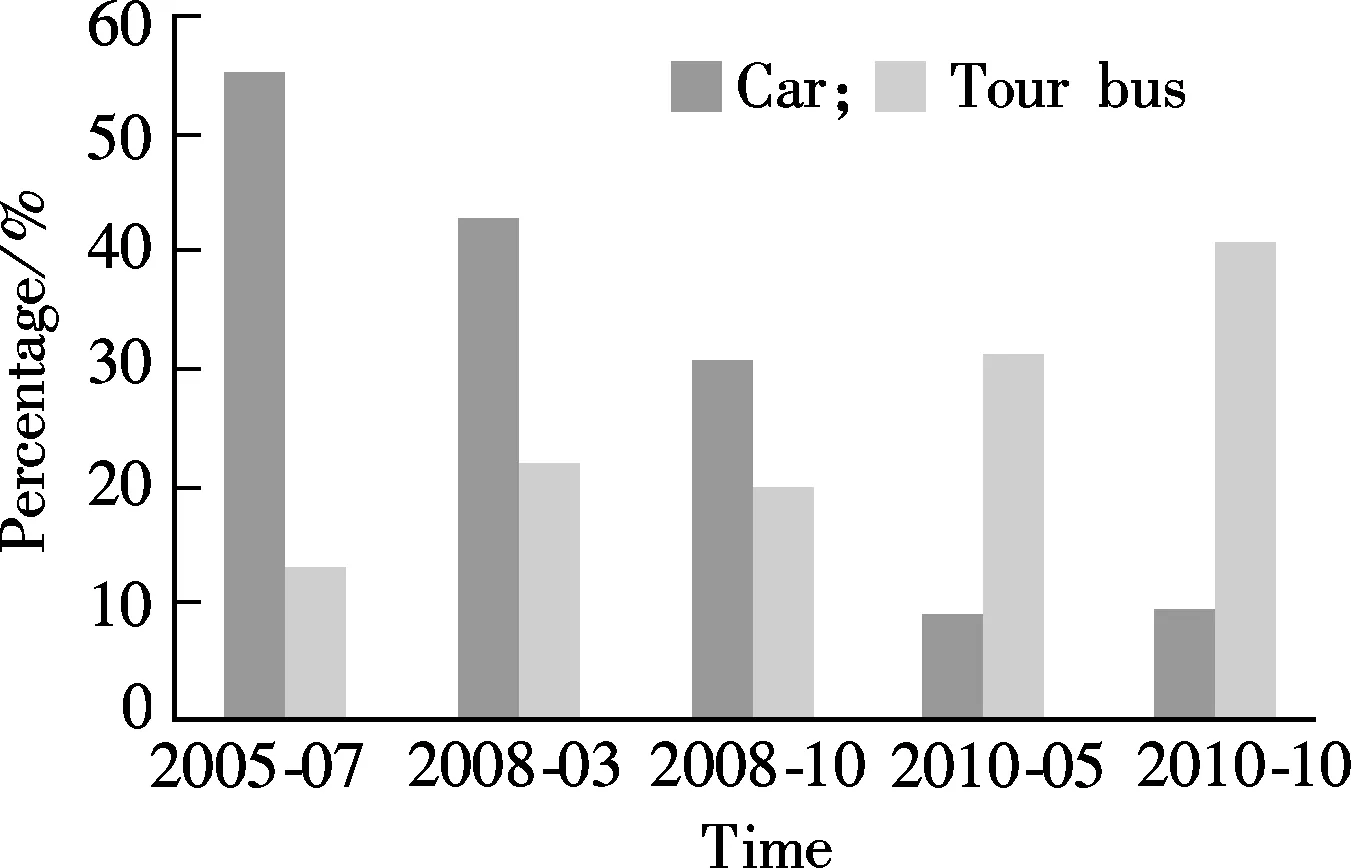
Fig.8 Tendency of the proportion of nonlocal visitors’ trip modes
4.2 Impact of companion attributes
Traveling in groups is a more prominent feature for trips to attend a planned special event. As a group, visitors traveling together may be sensitive to the change in transport mode or vehicle. Hensher[17]showed that the overall mean VTTS (vehicle travel time savings) varied across the number of passengers (from $19.99 to $13.22 per person per hour) and declined as the number of passengers increased. The sensitivity to walking time, waiting time and transfer numbers in the trip process might rise as the number of companions increases. The SP surveys in the duration from 2005 to 2008 indicate that the visitors’ travel behavior is mainly impacted by personal travel habits and travel purposes. The analysis of the SEM based on SP survey data shows that the impact of companion attributes was weakened at the first three stages. However, the analysis of the SEM based on RP survey data in 2010 indicates that the companion attributes have the most significant effect on visitors’ trip mode choices (The path coefficient is -0.25). Thus, it can be seen that travel decisions are often subject to the number of companions and the relationships between the respondent and the companions in attending the planned special events.
With the increasing number of companions, the visitors are insensitive to travel time increasing because the members of companions groups may kill the travel time by talking about interesting things with each other. In addition, the accommodating passengers of the vehicles used in different modes can range from 3 or so to dozens of passengers and more. Consequently, the increasing number of companions would make some of the visitors prefer to choose public transportation rather than private cars. On the other hand, the relationship between the respondent and companions can also affect travel decisions. For example, if there is a leader of the group, the travel behavior of the group will be strongly influenced by the preference of the leader. If the companions are relatives, the leader will usually pay the overall travel costs in China.
4.3 Survey feedback and the impact of transport management policy relevance analysis
The outcome of the first SP survey in July 2005 indicates that visitors’ trip mode choice patterns are of significantly different from the set objective values. The proportion of traveling by car is as high as 52% in particular. In this case, the road saturation degree will be more than 1, which will cause severe congestion. Although the transport management conceptual plan proposed a hierarchical and regional transport management concept in 2005, it did not further explain its impact on individual travel mode choices in detail, which kept us from taking effective measures to guide the mode choice behavior. Whereas, the estimated coefficients of the SEM shown in Fig.4 suggest that the transport policies have a negative effect on the visitor travel choice behavior. Compared with the effects of transport policies revealed in the surveys taking place in March 2008 and October 2008 (The path coefficients for the models in March 2008 and October 2008 are respectively -1.203 and -0.466, as shown in Figs.5 and 6), the intervention effects of transport policy in 2005 on travel behavior are very limited (The path coefficient is -0.26). As the policies and management measures are uncertain, individual objective factors have a significant effect on visitors’ trip mode choices. For instance, individual socio-economic attributes have a prominent effect on visitors’ travel behavior (The path coefficient is 0.223). As a result, nonlocal visitors prefer transport modes that can reach the Expo site directly, especially by car. The feedback from the first survey suggests that a transportation management policy should be specified and its effects on individual travel behavior should be illustrated.
According to the development of the transport policy and facility from 2005 to March 2008, car use in the area designated for the Expo 2010 Shanghai was curbed by means of the command-and-control policy and there were five rail transit lines that reached the Expo site directly. At the next stage we add some questions into the SP surveys in order to measure the impacts of detailed command-and-control policies on car use. As shown in Fig.5, the effects of the transport policy on visitor trip mode choices are more significant than other factors (The path coefficient is -1.203). After this action is taken, the proportion of car use is reduced to 30%, which still has an obvious difference from the objective value. This might be due to the fact that some nonlocal visitors prefer to travel by tour bus instead of traveling by car because the tour bus is allowed to travel into the command-and-control area,as previously mentioned. And the tour bus share rose from 13.1% in 2005 to 20%. On the contrary, individual socio-economic attributes have a weak impact on visitors and the trip mode choice (The path coefficient is -0.159). The results indicate that the implementation of the transport policy measures plays a significant role, but the car share is still high and the road saturation degree is close to 1.The feedback from the second survey shows that it is necessary to continue implementing the policy that controls the car use and transportation organization measures to meet the great demand for nonlocal visitors’ tour bus trips.
In October 2008, the government optimized the layout of park and ride hubs, implemented public transportation transfer concessions, and ensured that the parking lots surrounding the command-and-control areas were not available for cars. In order to analyze the impacts of the adjustment, we add some extra questions about whether visitors will travel by public transportation mode instead of car (shown in Tab.2) to the Expo 2010 site. As shown in Fig.6, the command-and-control measures have a heavily negative effect on private car use (The path coefficient is -0.466). Further improvement in the public transport system enhanced the attractiveness of public transport modes. The survey result indicates that the public transportation takes 70.0% of the trips to the Expo 2010 site at this stage. However, the proportion of public transport still remains 17% lower than the set objective value. Since the visitors prefer the mode that has the fewer number of transfers, the public transportation service should be further improved. The feedback from the third survey is that car use should be further reduced by increasing the level of public transportation service.
At the beginning (May 2010) and at the end (October 2010) of the Expo 2010 Shanghai, we carried out two RP surveys, in which we added some questions assessing the effects of a few enhancements on the public transport service system. The results from the survey taking place in October 2010 indicate that the public transportation share is satisfactorily as high as 88.6% and the car share decreases to 9.0%, slightly better than the set objective values. Besides, 41% of nonlocal visitors traveled by tour bus. As shown in Fig.7, individual socio-economic attributes and companion attributes have a significant effect on trip mode choice. The path coefficient for individual socio-economic attributes is -0.25 and the path coefficient for companion attributes is -0.19. However, individual attributes have a weak effect on trip mode choice and the path coefficient is -0.01. During the Expo, the average saturation degree of border roads is about 0.6 and the vehicle speed reaches 20 km/h, which shows that the transportation management measures improve the traffic control efficiency.
5 Conclusion and Future Directions
Before the opening of a planned special event, it will be an effective way to guide the visitors’ travel behavior and lead the resulting demand pattern gradually to approximate the set objectives by means of a newly-proposed cyclic progression planning process. The process first seeks the differences between the mode share from the SP survey and the set objectives for the special event, then collects further feedback, identifies a set of potential adjustments and implements them. The structural equation models are used to analyze the impact of influencing factors on trip mode choice, which makes it possible to identify practicable adjustments on traffic policies. The survey data we collected in five different periods in Shanghai helps us to make clear the gaps between the set objectives and current statuses as well as calibrate the SEMs. The feedback-adjustment cycle suggests that the objective-oriented SP survey plays a great role in supporting the decision process of policy making, and the transportation management measures together with transport service level need to be adjusted and improved constantly. The proportion of Expo 2010 visitors who chose public transport was 43% in 2005 and gradually increased to 88.6% at the end of this event, while the car share decreased from 52.0% to 8.7%, which proves that the set objectives have actually been met, thus creating a friendly transportation environment for the Expo 2010.
This paper provides a theoretical decision-making method for the transportation management measures in guiding the transformation of trip mode choice during planned special events such as the Expo 2010 Shanghai and so on. The research process has been proved practical based on the analysis of the collected data and the difference between the final results and the original objectives during the Expo 2010 Shanghai, China. For future research, it is recommended that the impact of transportation infrastructure on trip mode choice should be studied further. Meanwhile, due to the differences of the types and locations of planned special events, the application of this method also needs further validation. In-depth conclusions will be reached by comparing multiple PSEs with a similar method.
[1]Federal Highway Administration. Managing travel for planned special events[R]. Washington DC, USA: Department of Transportation, 2003.
[2]Santos G, Behrendt H, Teytelboym A. Part Ⅱ: policy instruments for sustainable road transport [J].ResearchinTransportationEconomics, 2010,28(1): 46-91.
[3]Yagi S, Mohammadian A. Policy simulation for new BRT and area pricing alternatives using an opinion survey in Jakarta [J].TransportationPlanningandTechnology, 2008,31(5): 589-612.
[4]Caramia M, Storchi G. Evaluating the effects of parking price and location in multi-modal transportation networks [J].NetworkandHeterogeneousMedia, 2006,1(3): 441-465.
[5]Kalmanje S, Kockelman K M. Credit-based congestion pricing-travel, land value, and welfare impacts [J].TransportationResearchRecord, 2004,1864: 45-53.
[6]Mao Baohua,Guo Jinyi, Chen Zhenqi, et al. Research on traffic schemes for special important activities [J].JournalofTransportationSystemsEngineeringandInformationTechnology, 2007,1(7): 18-24.
[7]Chen Qian, Wang Wei. Application of fuzzy optimization method based on CTM for traffic trunk line control under special events [J].JournalofSoutheastUniversity:NaturalScienceEdition, 2008,38(5): 861-865. (in Chinese)
[8]Chen Qian, Li Wenquan. Influence range of emergency under special events based on CTM [J].JournalofSoutheastUniversity:EnglishEdition, 2009,25(2): 257-261.
[9]Guo Jifu, Sun Zhuangzhi, Yao Guangzheng, et al. Transportation characteristics research of spectators in big events [J].JournalofTransportationSystemsEngineeringandInformationTechnology, 2010,4(10): 172-178. (in Chinese)
[10]Limtanakool N, Dijst M, Schwanen T. The influence of socioeconomic characteristics, land use and travel time considerations on mode choice for medium- and longer-distance trips[J].JournalofTransportGeography, 2006,14(5): 327-341.
[11]Dissanayake D, Morikawa T. Investigating household vehicle ownership, mode choice and trip sharing decisions using a combined revealed preference/stated preference Nested Logit model: case study in Bangkok Metropolitan Region[J].JournalofTransportGeography, 2010,18(3): 402-410.
[12]Lee Yuhwa, Hickman M, Washington S. Household type and structure, time-use pattern, and trip-chaining behavior [J].TransportationResearchPartA, 2007,41(10): 1004-1020.
[13]Walle S V, Steenberghen T. Space and time related determinants of public transport use in trip chains [J].TransportationResearchPartA, 2006,40(2): 151-162.
[14]Gardner B. Modeling motivation and habit in stable travel mode contexts [J].TransportationResearchPartF, 2009,12(1): 68-76.
[15]Lee Ju-Yeon, Chung Jin-Hyuk, Son Bongsoo. Analysis of traffic accident size for Korean highway using structural equation models [J].AccidentAnalysisandPrevention, 2008,40(6): 1955-1963.
[16]Golob T F. Structural equation modeling for travel behavior research [J].TransportationResearchPartB, 2003,37(1): 1-25.
[17]Hensher D A. Influence of vehicle occupancy on the valuation of car driver’s travel time savings: identifying important behavioral segments[J].TransportationResearchPartA, 2008,42(1): 67-76.
杂志排行
Journal of Southeast University(English Edition)的其它文章
- Price and retailer’s service level decision in a supply chain under consumer returns
- Research on development of urban taxi supply based on influence factors classification
- Fuzzy traffic signal control with DNA evolutionary algorithm
- Alcohol dehydrogenase coexisted solid-state electrochemiluminescence biosensor for detection of p53 gene
- Adjacent vertex-distinguishing total colorings of ∨Kt
- Aggregating metasearch engine results based on maximal entropy OWA operator
