Scale effects on non-cavitation hydrodynamicsand noise of highly-skewed propeller in wake flow
2013-01-08YangQiongfangWangYongshengZhangMingmin
Yang Qiongfang Wang Yongsheng Zhang Mingmin
(1 College of Marine Power Engineering, Naval University of Engineering, Wuhan 430033, China)(2College of Electronic Engineering, Naval University of Engineering, Wuhan 430033, China)
Under normal test conditions, the submarine propeller is far away from cavitation. It means that prediction and evaluation of propeller non-cavitation noise is essential to localize and identify the submarine main noise source at a low speed. In particular, the boundary layer flow and turbulent vortex of the full-appended submarine hull involved in the non-uniform incoming flow to the propeller should be taken into account for its noise prediction. However, the lack of theoretical models addressing this problem under a rigorous, physically-consistent recognized prediction approach leads to few successful research papers recently open-accessed. Seol et al.[1-3]made some valuable investigations on this point. They used a weak coupling method, e.g. the surface panel method based on velocity, to calculate the source flow field and the Farassat 1A integral equations in the frequency domain for sound propagation. Results show that the predicted sound pressure level at the blade passing frequency (BPF) and its harmonics just differs by less than 5 dB from the experimental data. This coupling method is usually called the hybrid two-step method, combining the computational fluid dynamics (CFD) with computational acoustics (CA). Regarding the CFD, large eddy simulation (LES) seems to be the most promising method to compute source fluctuations in the flow for aerodynamic noise prediction[4], but its application area is still limited in simple geometry until very recently. When the highly-skewed propeller blades are taken into account, the mesh spatial resolution and iterative temporal-scale required by the maximum efficient take-off frequency and the time cost are still embarrassing in marine engineering. As a basic application, Yang et al.[5]predicted non-cavitation noise of the propeller by the hybrid method of coupling LES with boundary element numerical acoustics in the frequency domain, including both the non-skewed DTMB 4119 propeller and the 7-bladed highly-skewed propeller. Note that the sound propagation algorithm in that paper is different from the one used by Seol et al[2]. Due to the long time consumption and lack of validation, its accuracy is still unknown and difficult to improve on. To overcome these limitations, according to Ref.[6], the unsteady Reynolds-averaged Navier-Stokes (URANS) simulation has become a good alternative nowadays, as long as every step is handled as carefully as possible.
Subsequently, in order to develop a convenient and robust method for propeller non-cavitation noise prediction beginning with the URANS simulation, both the time domain method and the frequency domain method are used to calculate the sound propagation of the propeller in the wake flow[7]. The time domain method is based on Carley’s time domain calculation of aerodynamic noise generated by a propeller in a steady flow. The fluctuated pressure distribution as an acoustic source is obtained by the URANS simulation. The mesh nodal normal generation is located in the center of the mesh element, not taking the cross-product of the vector from one node to its neighbors in one element[8]. Meanwhile, unlike simplifying the blade geometry into blade sections, a new description method is introduced into the calculation. Besides, the BEM numerical acoustics method in the frequency domain is used as a mutual comparison to determine the noise spectrum in the near and far acoustic fields. Results show that these two methods can give mutual validation to each other with 5 to 7 dB difference for the five measuring points in the propeller wake. Compared with the time domain method, the frequency domain prediction can not only include the axial passing frequency (APF) and the BPF harmonics line spectrum, but also present the interaction between the non-uniform inflow and the blade leading edges. On this point, the frequency domain method is considered to be more reasonable than the time domain method accounting for wake flow effect.
In recent applications, the propeller noise characteristics evaluation and low noise propeller design are mainly conducted by scaling the model-scale test to full-scale by certain scaling laws. The measurement uncertainty and the credibility of empirical formulae directly influence the noise precision of the big scaled propeller. However, what remains unknown is the effects of the Reynolds number on propeller non-cavitation noise, differing by two dimensions between the model propeller and the full-scale propeller. To obtain a better understanding of the scale effects, non-cavitation noise of three similar 7-bladed highly-skewed propellers in the same effective wake is undertaken by both the time and frequency domain methods first. Then, the scale effects on discrete line spectra and the total sound pressure level are discussed. Finally, the reasonability of the empirical scaling law applied recently is addressed.
1 Numerical Models for Radiated Noise
The general solving procedures and typical available hybrid methods for the flow noise and non-cavitation propeller noise are as follows: In the nonlinear unsteady flow domain, the local turbulent prediction is completed first by unsteady CFD, such as LES, detached eddy simulation (DES), scale-adaptive simulation (SAS), or direct numerical simulation (DNS); then the acoustic sources are interpolated from the fluid domain to acoustic propagation on the integral surface; finally, in order to reconstruct the far-field acoustic field, several surface integral methods in the time domain including the Lighthill formulation, the Curle formulation, the FW-H formulation and the Kirchhoff surface method, and the hybrid methods in the frequency domain including boundary element numerical acoustics, finite element numerical acoustics and the turbulence-wave number spectrum are all used in practical engineering.
Fig.1 presents the common flow chart of the flow-induced noise coupling algorithm in both the time and the frequency domains. The choice of any of these two methods depends on whether the acoustic propagation is solved in the time or in the frequency domain. As for the time domain, acoustic nodal sources are directly evaluated on the fine discretization of the fluid computation at each coupled time step. In contrast, if a harmonic acoustic computation is performed, a transient coupling is conducted between the fluid computation and the acoustic grid first, in which a dataset of the interpolated nodal sources is stored. Then, a fast Fourier transformation is performed to the transient dataset and the resulting sources in the frequency domain are subsequently used as input data for the acoustic computation in the harmonic mode.

Fig.1 Flow chart of fluid-induced noise coupling analysis
1.1 Farassat 1A equation in time domain
According to Ref.[8], the sound wave equation for a rigid body moving in an arbitrary steady uniform flow is derived from the sound Green function which is applied for noise radiation of a source moving in a uniform flow. It is expressed as
(1)
where the body surface is given byf(x)=0, andf>0 means the space outside the surface;vnis the surface normal fluid velocity;lis the force exerted by the surface on the fluid;Tijis the Lighthill stress tensor;δ(f) is the delta function;cis the sound speed;ρ′ andρ0are the fluid density with and without sound disturbance, respectively. Three terms on the right refer to the thickness, loading and quadrupole noise sources, respectively.
The solution of the wave equation for the thickness noise component is found by introducing the sound Green function in the unbounded field,

(2)
The solution of the loading noise equation is

(3)
whereGis the Green function andR′ is the distance from source (y,τ) to observer (x,t).
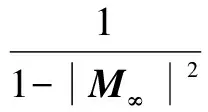
The retarded time calculation is completed using the Newton-Raphson method[8]

(4)
However, unlike the method of nodal normal generation in Ref.[8], which is calculated for each node by taking the cross product of the vector from one node to its neighbors, the element center rather than its nodes is treated as the calculation element, when the cell-centered finite volume CFD solver is used to calculate the flow field. It means that the element normal, with a positive orientation into the unbounded domain, lies at the center of an element but not a single node. In this case, the singularity of a blade tip point’s normal generation can be suppressed. Hence, there is no need to simplify the propeller blade tip from a real point to a small section again, which was recently adopted by Carley et al[9]. It is supposed to be more reasonable to adapt its real flow characteristics for noise prediction. Furthermore, another simplification to manifest a blade surface with several sections and a certain number of mesh nodes on each section is not adopted. This simplification seems to be reasonable for the aero-propeller with many straight long-span blades. However, marine propellers with 5 or 7 blades are excepted due to their inconspicuous span-line characteristics with high skew and rake angles. The centralized force on blade sections differs a lot from their real distributed loadings under this simplification, and it will affect the noise prediction directly. To overcome this limitation, the mesh information on real blade geometries and their time-dependent fluctuating pressure signals are extracted from the URANS simulation, so the surface mesh tiny elements can map the geometry and obtain the distributed force components as realistically as possible. Beyond the factors above, another difference also exists in importing the source. According to Ref.[8], the pressure data were default-loaded in the form of spectra with the frequency, magnitude and phase of each component specified. However, this process is completed by introducing the derivation of the fluctuated pressure at timeτinto Eq.(2) in the present work, so the time-frequency transformation is omitted to get rid of the numerical error when not enough discrete data is used to carry out the fast Fourier transformation (FFT).

1.2 Farassat 1A equation in frequency domain
After the fluctuated pressure on blades extracted from the transient every time-step file, the scattered acoustic field of an arbitrary-shaped closed body can be solved by the numerical acoustics boundary element method (BEM) in the field of linear acoustics. It can easily handle problems with the unbounded acoustic domain. Since only the acoustic nodes on the boundary surface are needed, the node size is substantially smaller than that of the finite element model (FEM). When the BEM is used, the sound pressure at any observerroutside the boundary surfaceΩa, which satisfies the homogeneous Helmholtz equation and the Sommerfeld radiation condition, is uniquely defined, once the monopole distributionσand the dipole distributionμon the boundary surface are known[10]. The sound pressure is written as
(5)
whererais the source point;G(r,ra) is the Green kernel function; andnis the normal direction. The single layer potential is the difference in the normal pressure gradient between both sides of the boundary surface,
(6)
and the double layer potential is the pressure difference between both sides,
(7)
In the process of the BEM calculation, the modeling strategy of the continuous array of stationary dipoles is adopted to simulate the rotation of the sources of propeller radiated noise according to the validations proposed in Refs.[11-12]. Specifically, the circular distributions of an infinite number of but fixed phase-shifted dipoles are used to reproduce the rotation equivalently. The position of the blades at the last step in the fifth circle in the CFD calculation is used to build the acoustic meshes. The total number of discretized dipole sources is the number of acoustic nodes for the BEM calculation. The shifted phase is determined by the rotating speed and the FFT transformation of the fluctuating pressure under the calculation conditions. The resulting noise sources are extracted by interpolating every time-step pressure within three circles to the last step position. To perform this transfer correctly, the weighted interpolation transfer of the CFD nodes to the BEM acoustic nodes is formulated to map the input data. In order to improve the accuracy as much as possible, the one-to-one method is chosen in the present work.
2 Hydrodynamics Similarity Checking
2.1 Open water performances
All the simulations are undertaken on three similar 7-bladed propellers with diameters of 250, 500 and 1 000 mm, respectively. Each propeller’s single passage domain and its block-structured hex meshes are completed by procedural operations along with the validation presented in Refs.[13-15] to insure the same volume grid topology. In this case, the mesh-independent analysis can be guaranteed by a validated mother-propeller’s grid topology and mesh density. However, the densities of the mesh nodes in the leading edge region, the trailing edge region, the tip section area and the blade surfaces should be locally gradually refined as the diameter increases (see Fig.2). In order to remove the effect of mesh quality discrepancy, the minimum mesh determinant indices of three propellers are all above 0.2 associated with the close mesh density and the average Yplus distribution on the blade surfaces. The mesh nodes in three single-passage domains are controlled by a grid refinement ratio of 1.7. The number of the mesh nodes of the small propeller is 201 978. To control the numerical error induced by variable interpolations between periodic interfaces and un-matching grid nodes distribution, the full-passage numerical domains are involved in the calculation. The numerical domain and boundary conditions in the non-cavitation single-phase RANS simulation are the same as those in Ref.[16]. The calculated open water characteristics are shown in Fig.3. The calculation results are in excellent agreement with the experimental data. In Fig.3, the variables are defined as
(8)
whereTandQare the thrust and the torque, respectively. Subscript 0 stands for the uniform inflow. The rotating speeds of three propellers arens=20 r/s,nm=15 r/s,nb=10 r/s to match the tunnel tests. So the Reynolds numberRen, based on the rotating speed and the diameter, differs by one dimension between the small and the big propellers. It can be enlarged to the full-scale propeller with a two-dimensional increment next.
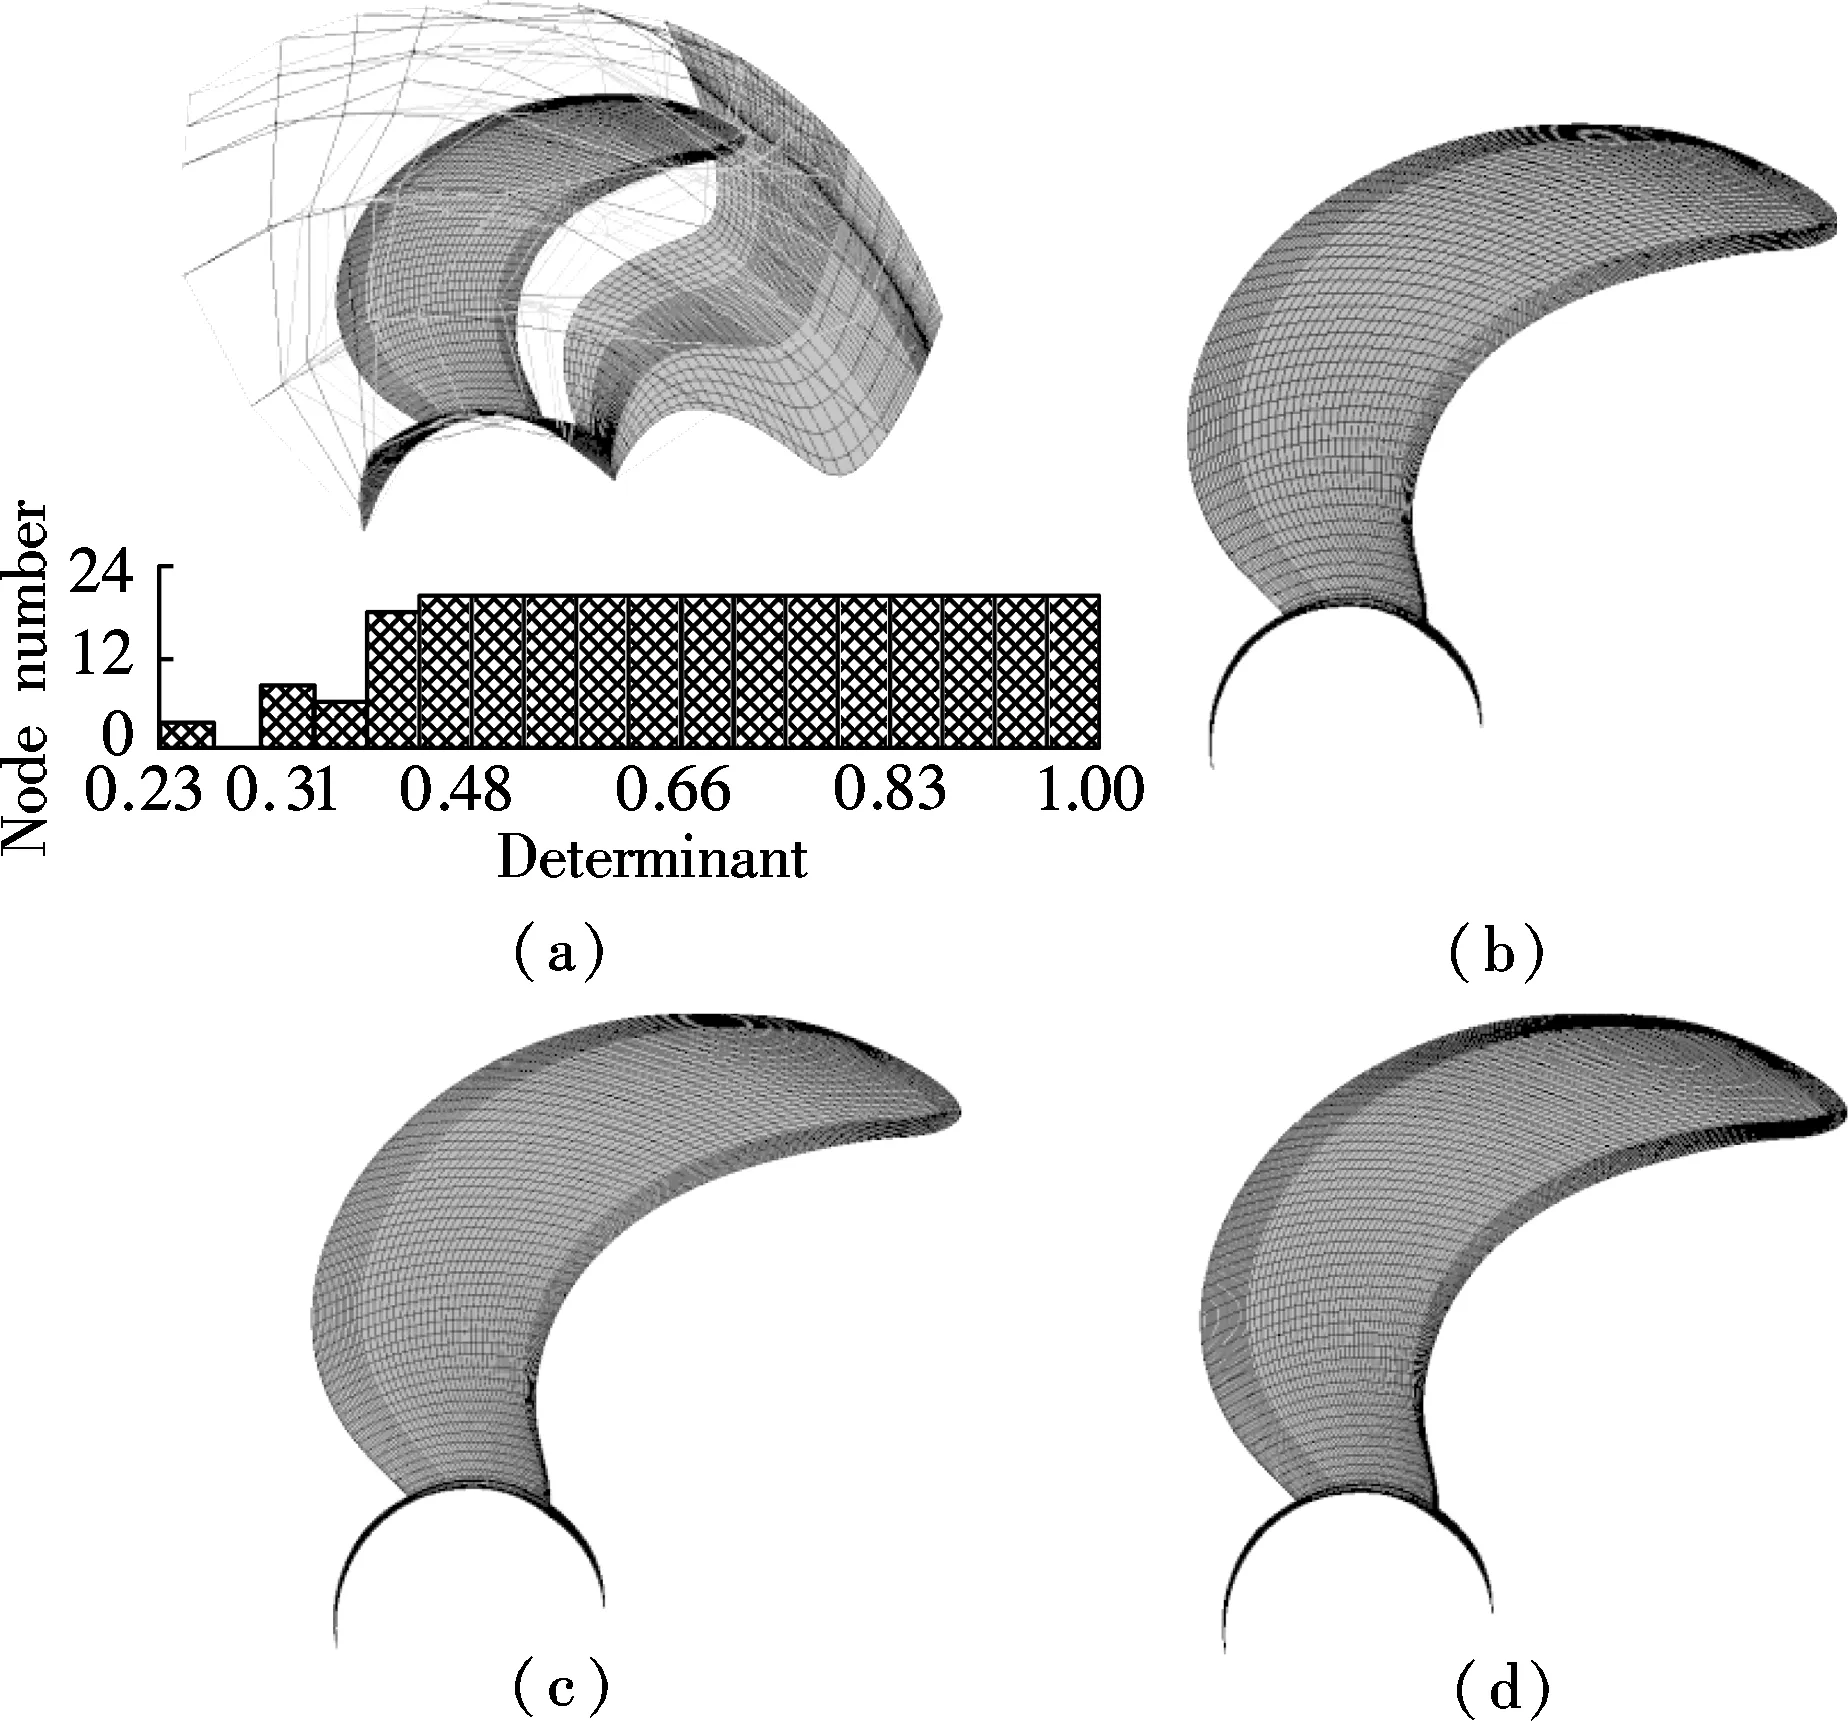
Fig.2 Common grid topology and surface meshes of three propellers. (a) Grid topology; (b) Small propeller; (c) Middle propeller; (d) Big propeller

Fig.3 Open water characteristics of all scaled propellers
As depicted in Fig.3, the Reynolds number increases with the increase in the diameter; the thrust coefficientKtincreases but the torque coefficientKqdecreases. So the derived open water efficiency obviously increases. Within the region of the advance ratio from 0.4 to 0.6, if we predict the big propeller’s open water performance directly from the small one with no corrections, the maximum and minimum discrepancies ofKtreach 6.1% and 3.5%, respectively. Meanwhile, the error bounds ofKqare 3.5% to 5.1%. Based on the results, the pressure coefficient distributions around the 0.7Rblade section of all the scales underJ=0.6 are calculated. It is seen that there exists a perfect superposition in the series of curves. Note that the pressure peak differs a little at the leading edge and the trailing edge of the chord.
2.2 Hydrodynamics in submarine wake flow
To get rid of the discrepancy of interactions between the non-uniform inflow and the leading edge of different scaled propellers, the non-dimensional nominal wake of a full-appended SUBOFF submarine model is imported as the incoming flow. The velocity profile is imported following these steps. First, both the plane geometry coordinates with a radius of 1.1Dsand three velocity components are extracted and stored as a profile file. Then, the variables are transferred and smoothed by conservative extrapolation to the same area on the inlet boundary of the small propeller. There still exists uniform flow on the outer region of the inlet. It means that the affected radial region by the boundary layer flow of submarine appendages is limited. When changing the advance ratio, scaling the corresponding velocity components in the profile file is the only necessity. Regarding the middle and big propellers, the use of the boundary profile is divided into two steps. The first is scaling the original profile’s geometry coordinates with a scale ratio to the larger inlet boundary with the same relative area. The second is multiplying the original profile’s velocity components with a ratio corresponding to the same advance ratio to ensure the close loadings on the three propellers. Besides, the left region on the inlet surface is still set as a uniform inflow boundary condition, and its velocity is determined by the analyzed advance ratio.
Using the same computational method, the propulsive performances of three propellers can be obtained by post-processing of the result files. A good superposition is presented at a given advance ratio once again. The tendency of global force with the increasing diameter is the same as that with the uniform inflow. At this moment, within the region of the advanced ratio from 0.209 to 0.403, the maximum and minimum discrepancies ofKtbetween the big and small propellers are 3.5% and 2.9%, respectively, and 3.2% to 3.8% forKqwithout correction. It means that the required correction for the global variables is smaller than that for the uniform inflow.
Fig.4 shows three propellers’ pressure coefficient distribution on the 0.7Rsection behind the SUBOFF submarine wake withJp=0.403. Compared to that behind uniform inflow, it is seen that the non-uniform inflow significantly elevates the local low pressure on the face side. It is beneficial to shift the cavitation inception later. However, it will result in a peak pressure on the back side at the same time, and the negative peak will be more severe with the increase in loading. This change will in turn weaken the suction side cavitation inception. As expected, the pressure coefficient distributions of all scales superpose once at a time, and a slight discrepancy at the trailing edge is still presented. That is to say, the classical scaling law is valuable to hydrodynamics of different scaled propellers. In Fig.4, the pressure coefficient is defined as

Fig.4 Pressure coefficient on 0.7R with submarine nominal wake
(9)
wherepoutis the pressure on the outlet surface of the numerical domain.
3 Non-Cavitation Noise Similarity Checking
The non-cavitation noise prediction method involved here is the same as that in Ref.[7]. Specifically, the fluctuated pressure distribution and the nodal normal velocity on blades and the hub surface are first extracted by the URANS simulation. Then, both the frequency domain and the time domain methods are applied to predict the sound propagation. So the observer’s discrete line spectrum and the total sound pressure level can be obtained. In the transient numerical test, the iterative time steps of three propellers are Δts=2.78×10⁻⁴s, Δts=2.78×10⁻⁴s and Δtb=5.56×10⁻⁴s corresponding to a rotation of 2°. The corresponding maximum effective frequencies are 1 800, 1 350 and 900 Hz, respectively. All the output flow variables for noise analysis are limited in the fifth revolution. Fig.5 shows the thrust fluctuation in one revolution for different scale propellers under the condition ofJp=0.403. Due to the interactions between the submarine tailing wake and the blade leading edges, both the APF and the BPF line spectra exist obviously. The amplitude of thrust fluctuationTincreases with the increasing diameter, and a bigger increment of the amplitude from the small to the middle propeller than that from the middle to the big one is presented.
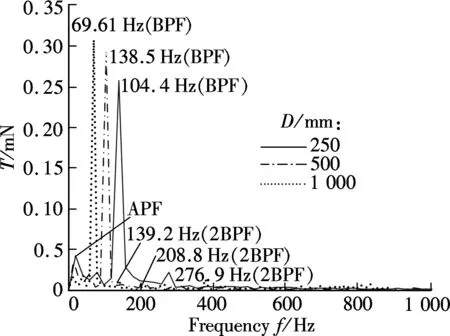
Fig.5 Thrust fluctuation of different scale propellers in wake
The frequency domain method is first used to predict the noise spectrum of pointP1of the three propellers, positioned at axial downstream with a distance of 4Dfrom the propeller disk plane (see Fig.6). SL is the spectrum level to 1 Hz bandwidth in dB reference to 1 μPa. As depicted in Fig.6, APF and BPF harmonics line spectra of three propellers and the 4BPF and 4APF frequencies identified interactions of wake with the blade leading edges are all precisely captured in the numerical test, which can in turn prove a comparative precision of the transient simulations for all the scales. On some level, it qualifies the further analysis of the noise spectrum curves based on these results. In addition, there is no obvious increment of the sound pressure spectrum level at a given frequency band from the small to the middle propeller, while a sharp increase exists from the small to the big propeller. Tab.1 shows the calculated tonal components and the total sound pressure spectrum level in 1 kHz of the three propellers. The increment of tonal noise from the small to the middle propeller is greater than that from the middle to the big propeller, which is consistent with the tendency of thrust fluctuation, especially at the first three discrete line spectra. Corresponding to this, the total sound pressure level increment is 8.36 dB from the small to the middle propeller and 7.25 dB from the middle to the big propeller, respectively.
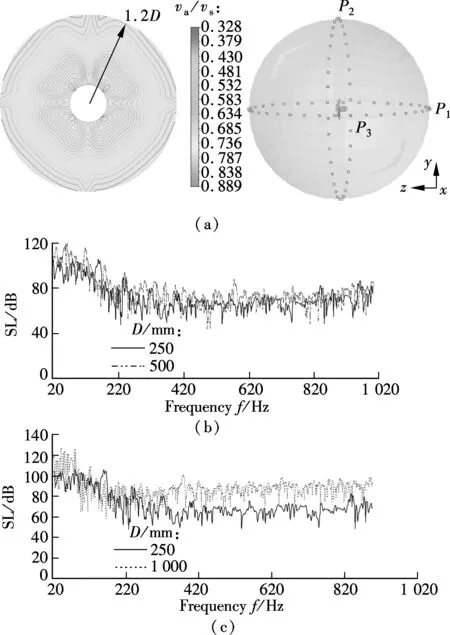
Fig.6 Noise spectrum of three propellers with non-uniform inflow. (a) Non-uniform inflow profiles and hydrophones; (b) Noise spectrum of small and middle propellers; (c) Noise spectrum of small and big propellers

Tab.1 Tonal component and total sound pressure spectrum level of all scales in wake by frequency domain method
Recently, there is still no popular-recognized scale effect on propeller non-cavitation noise. The empirical scaling law with standardization for spectrum levels proposed by experts in the former Soviet Union is nationally used, which is expressed as
SL*=SL(f′)-70lgD-50lgn
(10)
where the non-dimensional frequencyf′=f/n; SL*is the standardized spectrum level. And the effect of the relative measurement distance from the model and from the full-scale is considered. Applying Eq.(10), the standardized spectrum level for the tonal noise in Tab.1 is given in Fig.7. At the first three discrete line spectra, the increment of SL*is about 7 dB from the small to the big propeller, while it is about 12 dB at the remaining two frequencies. Fig.8 shows the comparison of the standardized noise spectrum of all the scales in the whole frequency band. It is obvious that a good consistency exists in the low frequency, which to some extent qualifies the application of the empirical scaling law for non-cavitation primary tonal noise. However, the scale effects are enlarged with the increasing frequency, which results in a bigger error in the scaling law. To overcome this shortcoming, a bigger model scale and a smaller scale ratio should be chosen to control the prediction error; for instance, the middle propeller is used as the model scale in this paper.

Fig.7 Standardized spectrum level of discrete line spectrum obtained by frequency domain method
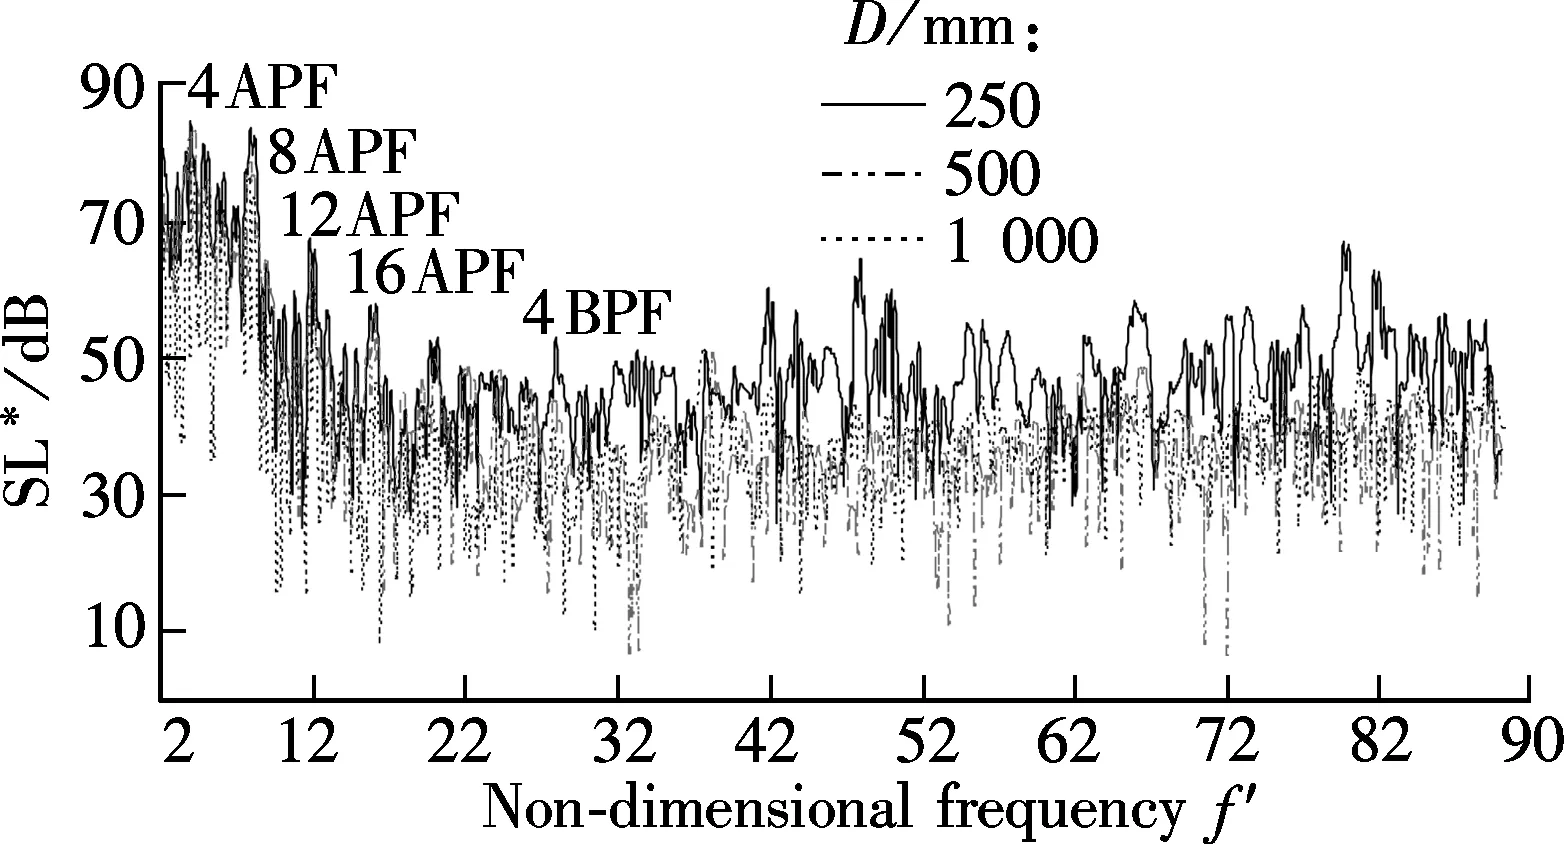
Fig.8 Standardized spectrum level curves of all scales obtained by frequency domain method
In order to verify the reasonability of the conclusions above, the time domain method is conducted. The distributed fluctuating pressure noise source and blades surface geometrical information are exported from URANS simulations again. The observerP1is still positioned at the same relative distance. From the calculated time-depended noise spectra of both the small and the middle propellers, the APF, BPF and their harmonic discrete signals are presented, which is the same as those for the 7-bladed propeller proposed in Ref.[7]. The tonal noise spectrum level and total sound pressure level of the three propellers in the 1 kHz frequency band are shown in Tab.2. In this case, the increment of the total sound pressure level from the small to the middle propeller is 3.96 dB, which is 4.4 dB smaller than that by the frequency domain method. However, the increment from the middle to the big propeller is 14.14 dB, which is 6.89 dB bigger than that using the frequency domain method. It is difficult to comment on these results and draw firm conclusions. We can refer these phenomena to the interactions between the incoming flow and the blade leading edges in some respects. Under the same advance ratio, the incoming velocity of the big propeller is double that of the small one. Compared with the frequency domain method, the fluctuating pressure distribution with non-uniform inflow is used to account for the effects of the incoming flow on sound propagation in the time domain method. It is more difficult to present the strong axial flow effect, and the interactions are weakened a lot from the source term. Using Eq.(9) again, the standardized spectrum level curves of the three scale propellers are shown in Fig.9. It is seen that at the first three BPF harmonics, the increment of spectrum level from the small to the middle propeller is about 6 dB, while the maximum increment from the small to the big propeller reaches 10.11 dB, and the minimum is 8.10 dB. Furthermore, at the APF frequency, the spectrum level increases the most by 14.69 dB while the minimum increment is located at 4BPF with only 8.01 dB. It is still 4.97 dB smaller than that by the frequency domain method. It is concluded that, choosing the middle propeller as the model scale, the precision of the empirical scaling law is obviously higher than that applied for the small one, which is consistent with the conclusion from the frequency domain method.

Tab.2 Tonal component and total sound pressure spectrum level of three propellers in wake by time domain method
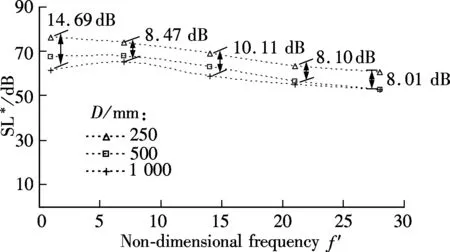
Fig.9 Standardized spectrum level of discrete line spectrum obtained by time domain method
To clearly present the scale effects on tonal line spectrum and total sound pressure level, both the increment of tonal components and total sound pressure levels from the small to the middle propeller and from the small to the big propeller by both the time and the frequency domain methods are shown in Fig.10. In which the subscripts s, m and b refer to small, middle and big propellers, respectively. It is seen that, at the second and third line spectra, the scale effects on the spectral level behaves consistently with a certain increment. In addition, on the one hand, the two methods both suggest a bigger prediction error of the non-cavitation noise of full scale from the small propeller with a bigger scale ratio. On the other hand, they show that the total spectrum level increment from the small to the big propeller only differs by 2.49 dB, which can be used to give a good mutual verification. Accounting for the total sound pressure level, the comparison of its increment for the three propellers by the two methods can be obtained from Tabs.1 and 2. It is obvious that the difference of the calculated value pointing to one propeller is nearly the same, which can be roughly used to prove the credibility and reproduction of the numerical tests.
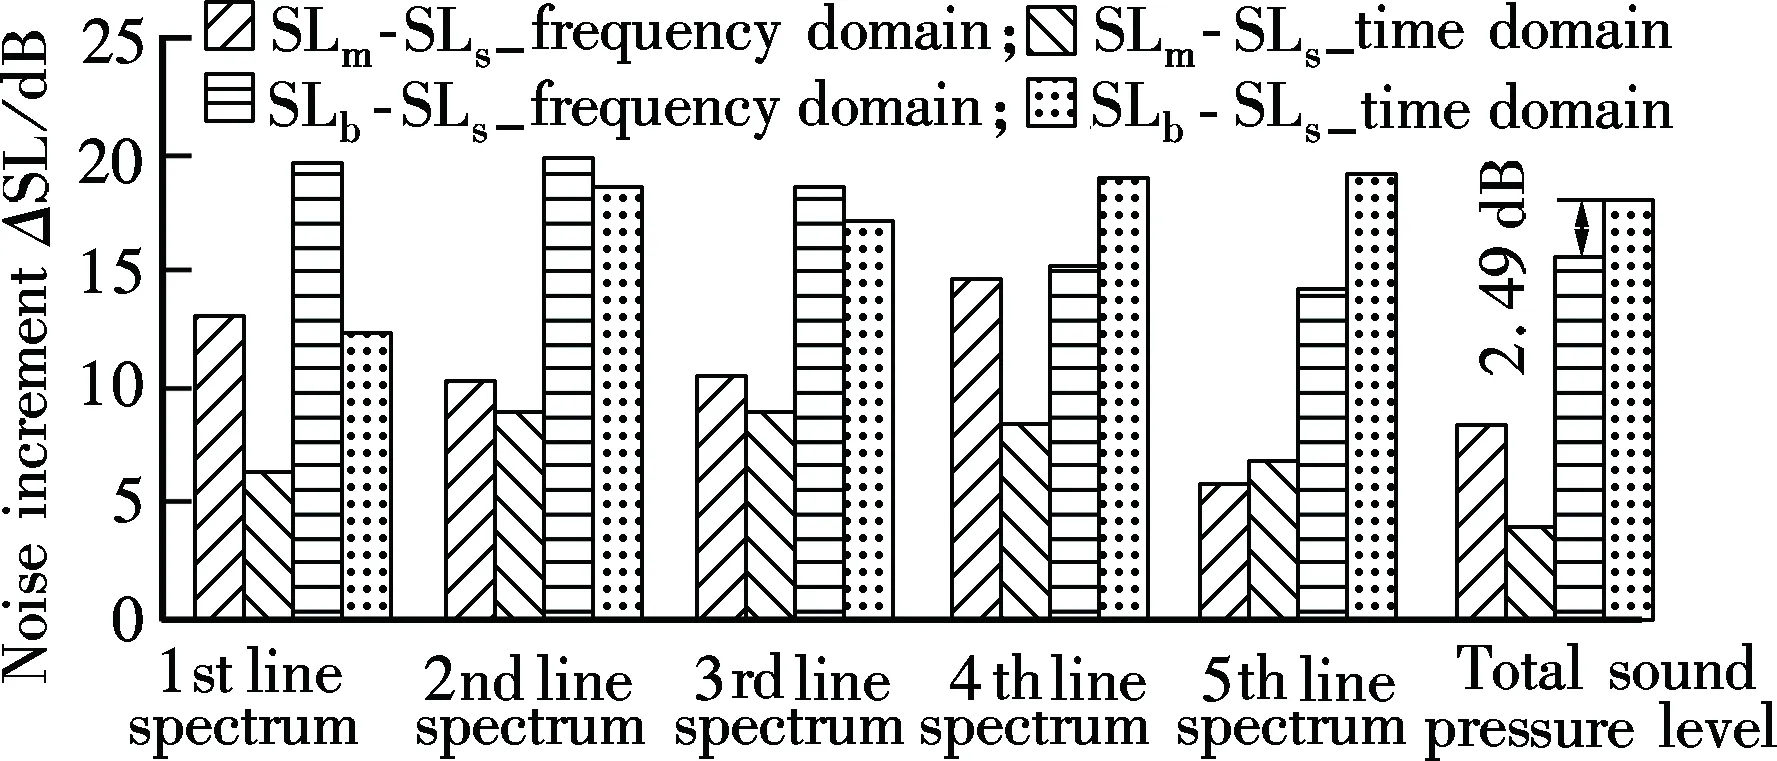
Fig.10 Comparison of increment of tonal components and total sound pressure spectrum level
4 Conclusions
1) With the same advance ratio, the pressure coefficient distribution of three propellers around a certain blade section shows a good supposition. The thrust coefficient increases with the diameter, but the torque coefficient decreases with the increase in the Reynolds number, and a derived high efficiency follows. Ignoring the scale effect on submarine wake, the predicted thrust coefficient of the big propeller differs by 2.9% to 3.5% to that directly scaled from the small propeller without correction, and the torque coefficient error bound is from 3.2% to 3.8%.
2) The fluctuated thrust coefficients of all the scales well represent both the APF and the BPF line spectra, and the amplitude enhancement at the BPF from the small to the middle propeller is greater than that from the middle to the big propeller. Pointing to an observer with a similar reference axial distance, the frequency domain and the time domain noise prediction methods present the increment of the total sound pressure level from the small to the big propeller differing by only 2.49 dB.
3) Both increments in the tonal noise and the total sound pressure level obtained by the two methods show strong scale effects with a large scale ratio. The standardized spectrum level curves of the middle propeller obtained from the frequency domain method approximate those of the big propeller, while a sharp discrepancy exists compared to the small one. According to the numerical tests, the precision of the empirical scaling law increases inversely with the scale ratio.
[1]Seol H, Jung B, Suh J C, et al. Prediction of non-cavitation underwater propeller noise[J].JournalofSoundandVibration, 2002,257(1): 131-156.
[2]Seol H, Suh J C, Lee S. Development of hybrid method for the prediction of underwater propeller noise[J].JournalofSoundandVibration, 2005,288(2): 345-360.
[3]Seol H, Cheolsoo P. Numerical and experimental study on the marine propeller noise[C]//19thInternationalCongressonAcoustics. Madrid, Spain, 2007: 1-4.
[4]Wagner C.Large-eddysimulationforacoustics[M]. New York: Cambridge University Press, 2007.
[5]Yang Qiongfang, Wang Yongsheng, Zeng Wende, et al. Calculation of highly-skewed propeller’s load noise using BEM numerical acoustic method in frequency domain [J].ActaArmamentarii, 2011,32(9): 1118-1125. (in Chinese)
[6]Caridi D. Industrial CFD simulation of aerodynamic noise[D]. Inedito: Università Degli Studi Di Napoli Federico Ⅱ, 2008.
[7]Yang Qiongfang, Wang Yongsheng, Wei Yinsan, et al. Non-cavitation noise prediction of highly-skewed propeller in wake flow by both time and frequency domain methods based on URANS simulation[C]//Proceedingsofthe13thShipandSubmarineUnderwaterNoiseForm. Wuxi, China, 2011: 325-338.
[8]Carley M. Time domain calculation of noise generated by a propeller in a flow [D]. Ireland: Department of Mechanical Engineering, Trinity College, 1996.
[9]Marretta R M A, Orlando C, Carley M. Adaptive BEM for low noise propeller design[J].TheOpenAcousticsJournal, 2009,2(1): 20-30.
[10]LMS International. Numerical acoustics [R]. LMS Virtual Lab, 2006.
[11]Kucukcoskun K. Prediction of free and scattered acoustic fields of low-speed fans[D]. Sint-Genesius-Role: Von Karman Institute for Fluid Dynamics, Avenue Guy de Collongue, 2012.
[12]Turkdogru N. Validity of the point source assumption of a rotor for far-field acoustic measurements with and without shielding[D]. Atlanta: School of Aerospace Engineering, Georgia Institute of Technology, 2010.
[13]Yang Qiongfang, Guo Wei, Wang Yongsheng, et al. Procedural realization of pre-operation in CFD prediction of propeller hydrodynamics[J].JournalofShipMechanics, 2012,16(4): 25-32. (in Chinese)
[14]Yang Qiongfang, Wang Yongsheng, Zhang Zhihong. Research on scale effects on propeller cavitating hydrodynamic and hydroacoustic performances with non-uniform inflow [J].ChineseJournalofMechanicalEngineering, 2013,26(2): 414-426.
[15]Yang Qiongfang, Wang Yongsheng, Zhang Mingmin. Propeller cavitation viscous simulation and low frequency noise prediction with non-uniform inflow[J].ChineseJournalofAcoustics, 2013,32(2): 1-19.
[16]Yang Qiongfang, Wang Yongsheng, Zhang Zhihong. Numerical simulation of tip vortex local flow of controllable pitch propeller [J].ChineseJournalofHydrodynamics, 2012,27(2): 131-140. (in Chinese)
杂志排行
Journal of Southeast University(English Edition)的其它文章
- Price and retailer’s service level decision in a supply chain under consumer returns
- Investigation on transformation process of trip mode choicefor planned special events
- Fuzzy traffic signal control with DNA evolutionary algorithm
- Alcohol dehydrogenase coexisted solid-state electrochemiluminescence biosensor for detection of p53 gene
- Adjacent vertex-distinguishing total colorings of ∨Kt
- Aggregating metasearch engine results based on maximal entropy OWA operator
