A Cell Formation Method Using Principal Component Analysis
2012-08-16ZHOUJin
ZHOU Jin
( School of Electronic and Electrical Engineering, Shanghai Second Polytechnic University, Shanghai 201209, P. R. China )
A Cell Formation Method Using Principal Component Analysis
ZHOU Jin
( School of Electronic and Electrical Engineering, Shanghai Second Polytechnic University, Shanghai 201209, P. R. China )
A computerized two-stage cell formation method for cellular layout design is proposed. In the first stage, a similarity/dissimilarity measure based on sequence comparison is calculated for each pair of part routings. In the second stage, Principal Component Analysis is applied to a dataset to identify part families and form cells. Finally a case study illustrates the approach in details and compares three similarity/dissimilarity measures: Jaccard similarity coefficient, Levenshtein Distance and Merger coefficient. The results show that out of three similarity/dissimilarity coefficient, Merger coefficient outperforms the others.
Principal Component Analysis; cell formation; edit distance measure; sequence comparison
0 Introduction
Cellular manufacturing is one of the applications of Group Technology principles to manufacturing. In Group Technology, similar parts are grouped into families, associate machines are organized into groups and each part families can be processed within a single machine group. This idea of Group Technology leads to simplified materials, reduced material handling, reduced work-in-progress inventory, reduced throughput time, and improved scheduling. In a Cellular Layout, each cell is a group of machines co-located in a dedicated section of the shopfloor. However, each cell is capable of producing some subset (also referred to as a Part Family) of the complete product mix produced in the facility.
The cell formation is an NP-hard problem[1]well known in layout planning. A number of researchers have studied the cell formation problem with different techniques: 0-1 machine-part matrix permutation, hierarchical clustering, evolutionary algorithm, etc[2-3]. Among these techniques, those based on similarity/dissimilarity measures are most widely used. This paper proposes a computerized two-stage cell formation method for cellular layout design. In the first stage, a similarity measure based on sequence comparison is calculated which is important for streamlining material flow network. In the second stage, Principal Component Analysis is applied to find part families and form cells. Finally a case study illustrates the approach in details. The results show that Principal Component Analysis works well with Merger Coefficient in context of cell formation.
1 Similarity/dissimilarity Measures
Generally there are two types of similarity/dissimilarity measures, binary matrix based or operation comparison based. A typical example of former is Jaccard similarity, which considers only assignment information, that is, a part need or need not a machine to perform an operation. A typical example of the latter is Levenshtein distance. Both measures have been widely accepted in part grouping. Levenshtein distance is defined as the minimum number of inserts, deletes and substitutions needed to change source operation sequence into target one. The editing of an operation sequence based on one of the three operations is called an edit operation. The shorter the distance between two operation sequences, the more similar they are; and vice versa. The distance between two operation sequences that have the highest similarity, namely two identical sequences, would be zero.
Merger coefficient uses the same set of elementary edit operations for transformation between two operation sequences, i.e. substitutions, deletes and inserts. However, it overcomes the disadvantage of other edit distance measure — ignoring common substrings or common subsequences. A detailed discussion on Merger coefficient canbe found in literature [4]. Merger coefficient is a similarity measure ranging from 0 to 1.
2 Principal Component Analysis
Principal Component Analysis[5]is a useful statistical technique that has found application in fields such as face recognition and image compression, and is a common technique for finding patterns in data of high dimension. Principal Component Analysis requires having data in form of correlations and extracts a small number of factors from the correlation matrix. In this application of Principal Component Analysis, the similarity/dissimilarity coefficient matrix is used as the correlation matrix. Principal Component Analysis attempts to model the total variance of the original data set via new uncorrelated variables called principal components. These components are linear combinations of the original variables. The objective of this Principal Component Analysis is clustering parts in families. At the end of analysis, the similarity/dissimilarity coefficients can be represented by a two dimensional scatter plot, where each part is represented by a “+”. The neighbor parts with less angle distance could form a part family and the machines needed by the part family form a cell. However, whether Principal Component Analysis result can lead to a good cell formation depends on the choice of similarity/dissimilarity coefficient. The following case study shows that out of the three similarity/dissimilarity coefficients abovementioned, Merger coefficient outperforms the others.
3 Case Study
Table 1 lists the routings of the products in a hypothetical jobshop environment. Tables 2, 3 and 4 show the pairwise similarity/dissimilarity coefficient matrix of part routings based on Jaccard similarity measure, Levenshtein distance and Merger coefficient.
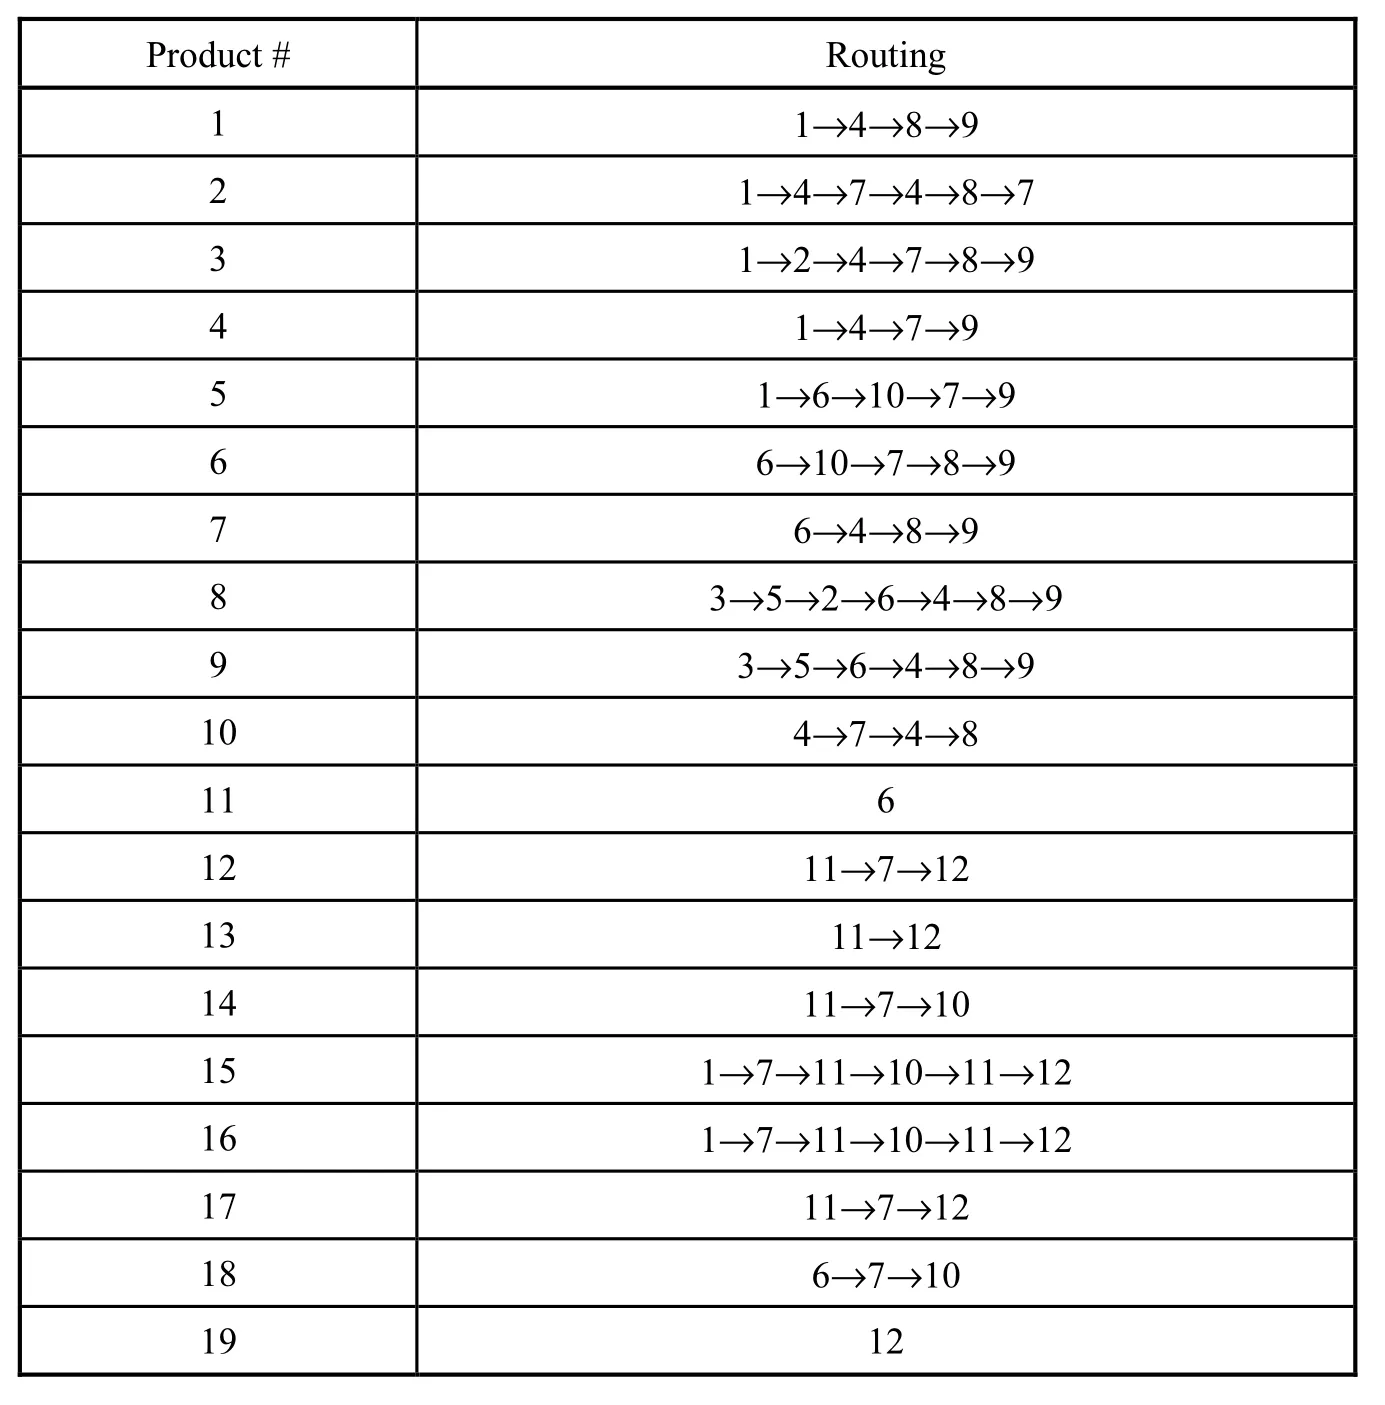
Tab. 1 Routings and production quantities of products produced in the jobshop

Tab. 2 Jaccard similarity matrix
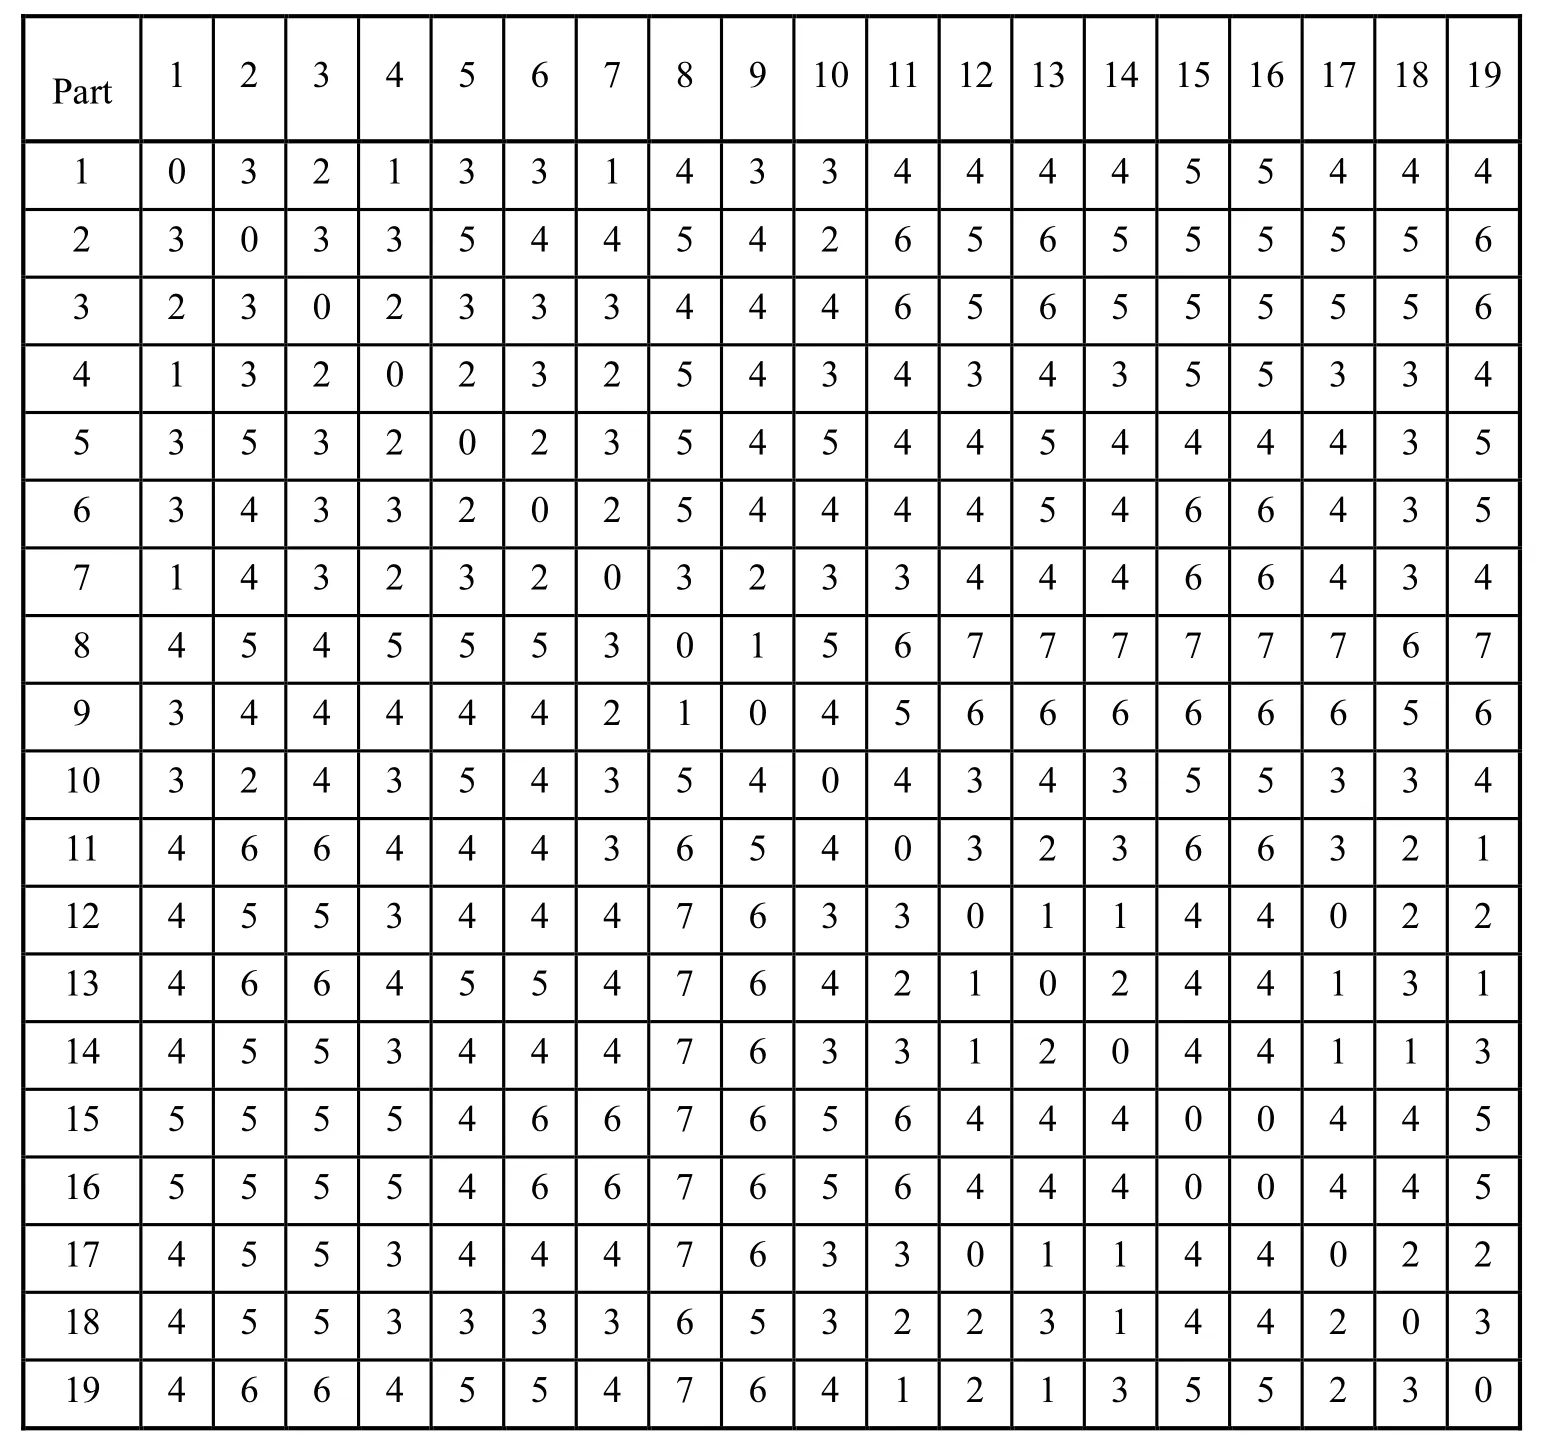
Tab. 3 Levenshtein distance matrix

Tab. 4 Merger coefficient matrix
With the help of Matlab, Scatter Plots for each similarity/dissimilarity measures are shown in Figures 1, 2, and 3. Based on the Jaccard similarity coefficients of Parts, Principal Component Analysis result does not show a clear partition. In Figure 2, the dotted line shows a partition of part families. The partition separates Parts 15, 16 from the rest. Part family {1, 2, 3,4,5,6, 7, 8, 9, 10} contains so many parts with distinctly different routings. Clearly this is not a good partition. Figure 3 shows a better partition, as all 19 parts are partitioned into 3 part families {1, 2, 3, 4, 10}, {5, 6, 7, 8, 9, 11, 18} and {12, 13, 14, 15, 16, 17, 19}. The scree plot of Principal Component Analysis based on Merger Coefficient Matrix (Figure 4) also shows that the first three components capture most information of the matrix, therefore 3 is the best as the number of part families. Table 5 concludes the adjacency graphs of the 3 part families abovementioned. Each has a branched flowline structure.
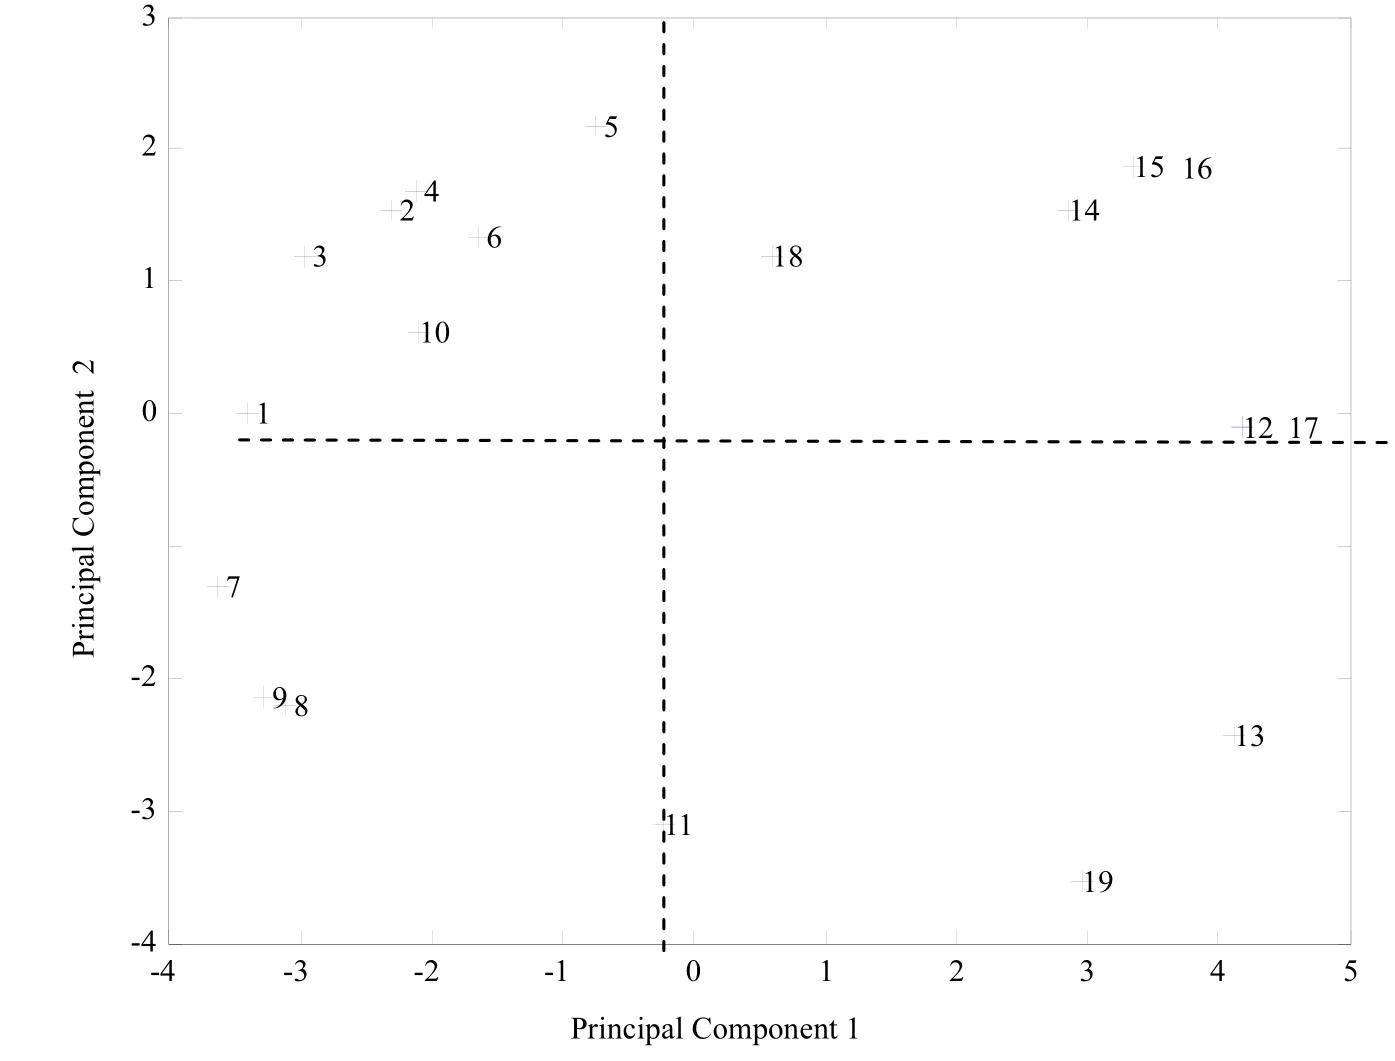
Fig. 1 Principal component analysis based on jaccard similarity coefficient

Fig. 2 Principal component analysis based on levenshtein distance matrix
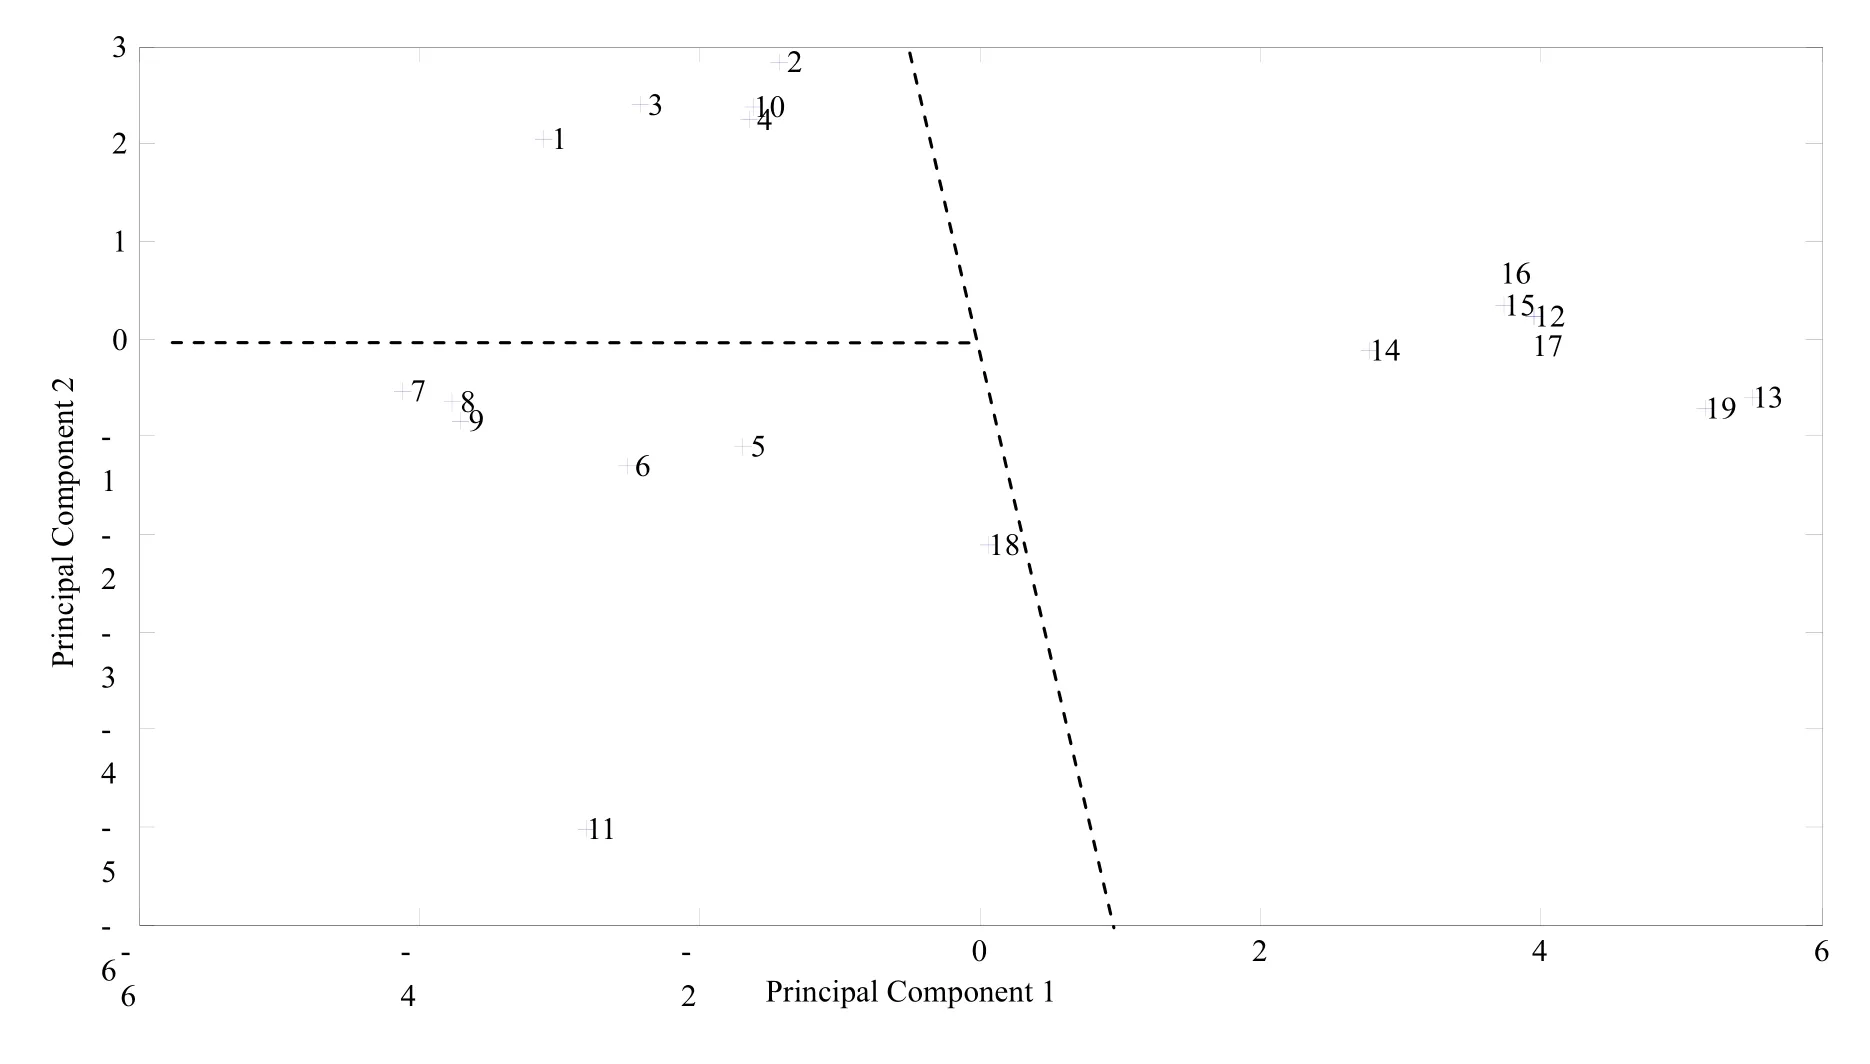
Fig. 3 Principal component analysis based on merger coefficient matrix
4 Conclusion
This paper introduced a new cell formation method using Principal Component Analysis combined with sequence comparison based similarity/dissimilarity measures for design of cellular layouts. A case study was discussed in details. It also shows that the Principal Component Analysis works differently with similarity/dissimilarity measures. Further, the research needs to be done to investigate whether Principal Component Analysis can be utilized to evaluate similarity/dissimilarity measures’ grouping efficiency.
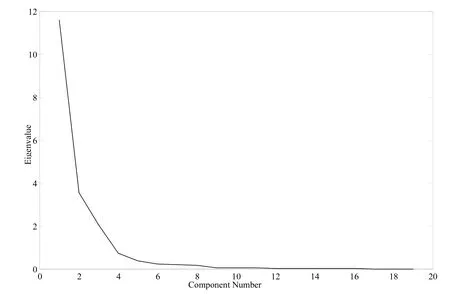
Fig. 4. Scree plot of principal component analysis based on merger coefficient matrix
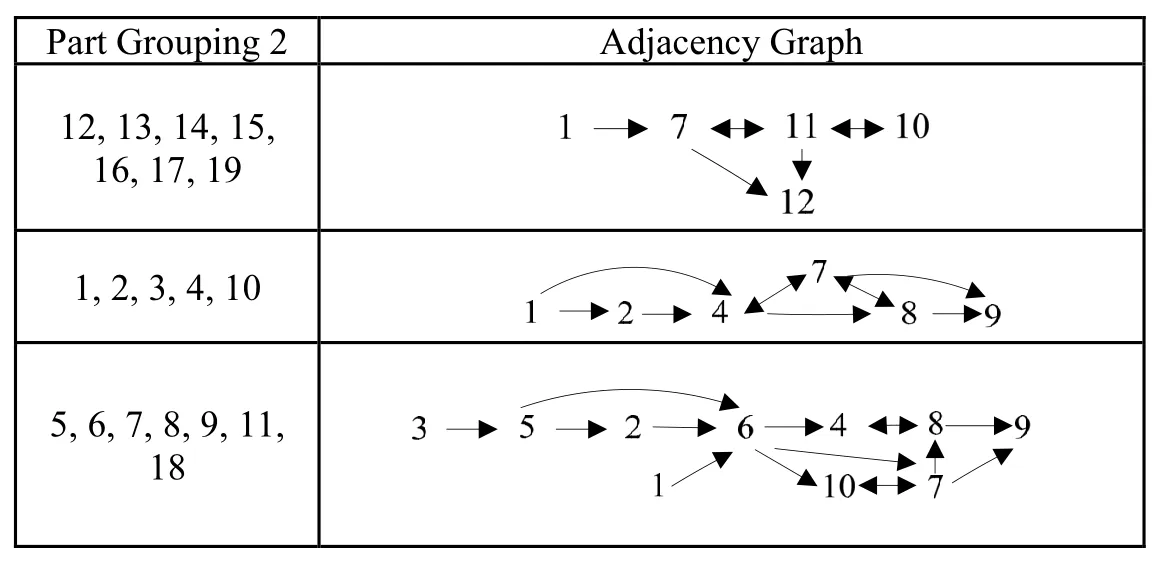
Tab. 5 Adjacency graphs of part families
[1] SAEEDI S, SOLIMANPUR M, MAHDAVI I, et al. Heuristic approaches for cell formation in cellular manufacturing[J]. J. Software Engineering & Applications, 2010, 3: 674-682.
[2] VAKHARIA A J, WEMMERLÖV U A. A comparative investigation of hierarchical clustering techniques and dissimilarity measures applied to the cell formation problem[J]. Journal of Operations Management, 1995, 13: 117-138.
[3] ELBENANI B, FERLAND J A, BELLEMARE J. Genetic algorithm and large neighborhood search to solve the cell formation problem[J]. Expert Systems with Applications. 2012, 39: 2408-2414.
[4] HUANG H. Facility layout using layout modules[D]. Columbus, OH: Department of Industrial, Welding and Systems Engineering, The Ohio State University, 2003.
[5] GNANADESIKAN R. Methods for Statistical Data Analysis of Multivariate Observations[M]. Wiley, New York, 1997.
基于主成分分析的制造单元形成方法
周 瑾
(上海第二工业大学电子与电气工程学院,上海201209)
提出一种用于制造单元布局的两阶段制造单元形成方法。在第一阶段,计算每对工序之间的相似/相异度。在第二阶段,使用主成分分析将零件分组,形成制造单元。在此特采用一实例详细讨论了如何使用这种方法并且比较了三种相似/相异度(Jaccard相似度,Levenshtein 距离和合并系数)的效果。结果表明在这三种相似/相异度中,合并系数法效果最好。
主成分分析;制造单元形成; 编辑距离;序列比较
TP39
A
1001-4543(2012)04-0277-06
2012-09-11;
2012-12-12
周瑾(1973-),女,浙江人,副教授,博士,主要研究方向为计算机辅助工程设计、应用软件研究,电子邮箱zhoujin@ee.sspu.cn。
