Vapor-Liquid Equilibrium of Ethyl Acetate + CnH2n+1OH (n=1,2,3)Binary Systems at 0.3 MPa
2012-02-14SUSIALRODRIGUEZHENRIQUEZSOSAROSARIOandRIOSSANTANA
SUSIAL P. *, RODRIGUEZ-HENRIQUEZ J.J., SOSA-ROSARIO A. and RIOS-SANTANA R.
School of Industrial and Civil Engineering, University of Las Palmas de Gran Canaria, Canary Islands, Spain
1 INTRODUCTION
In previous work [1, 2] we presented vapor-liquid equilibrium (VLE) data for binary systems at moderate pressures, in which the influence of pressure on the composition of azeotropic point was verified. In this paper we present VLE data in the ethyl acetate +methanol, ethyl acetate + ethanol, and ethyl acetate +1-propanol binary systems at 0.3 MPa. These mixtures were described in the literature [1-3] under isothermal and isobaric conditions. In addition, the ethyl acetate +ethanol system were studied at 100 kPa by Orchilles et al. [4] and at 101.32 kPa by Calvar et al. [5], Chein-Hsiun et al. [6], Ortega et al. [7] and Topphoff et al. [8], while at 101.32 kPa the ethyl acetate + 1-propanol system was investigated by Ortega and Peña [9].
The singular points in the ethyl acetate + methanol and ethyl acetate + ethanol systems have been described [1, 2, 10], but for the ethyl acetate + 1-propanol binary system no azeotropic data has been found. This is why we consider the investigation on the relation between the behavior of azeotropic points and alcoholic chain.
The VLE experimental data of the previously indicated systems are verified with the point-to-point test of van Ness et al [11]. All data presented in this work agree with the consistency criteria proposed by Fredenslund et al [12]. The contribution models UNIFAC [12-15] and ASOG [16] are verified with the experimental data of this work.
2 EXPERIMENTAL
2.1 Materials
Table 1 gives the physical properties, normal boiling temperature, density at 298.15 K, and refractive index at 298.15 K, determined for the ethyl acetate, methanol, ethanol and 1-propanol, all from Panreac Química S.A., and their comparison with values in literature. These materials were used without further purification.
2.2 Apparatus and procedure
The VLE experiments in this study were performed using a dynamic recirculation still equipped with a Cottrell pump, which has been described in previous paper [20]. Temperature was measured with±0.05 K of uncertainty using Termocouples of Termocoax (1073 K range) with 0.1% precision.
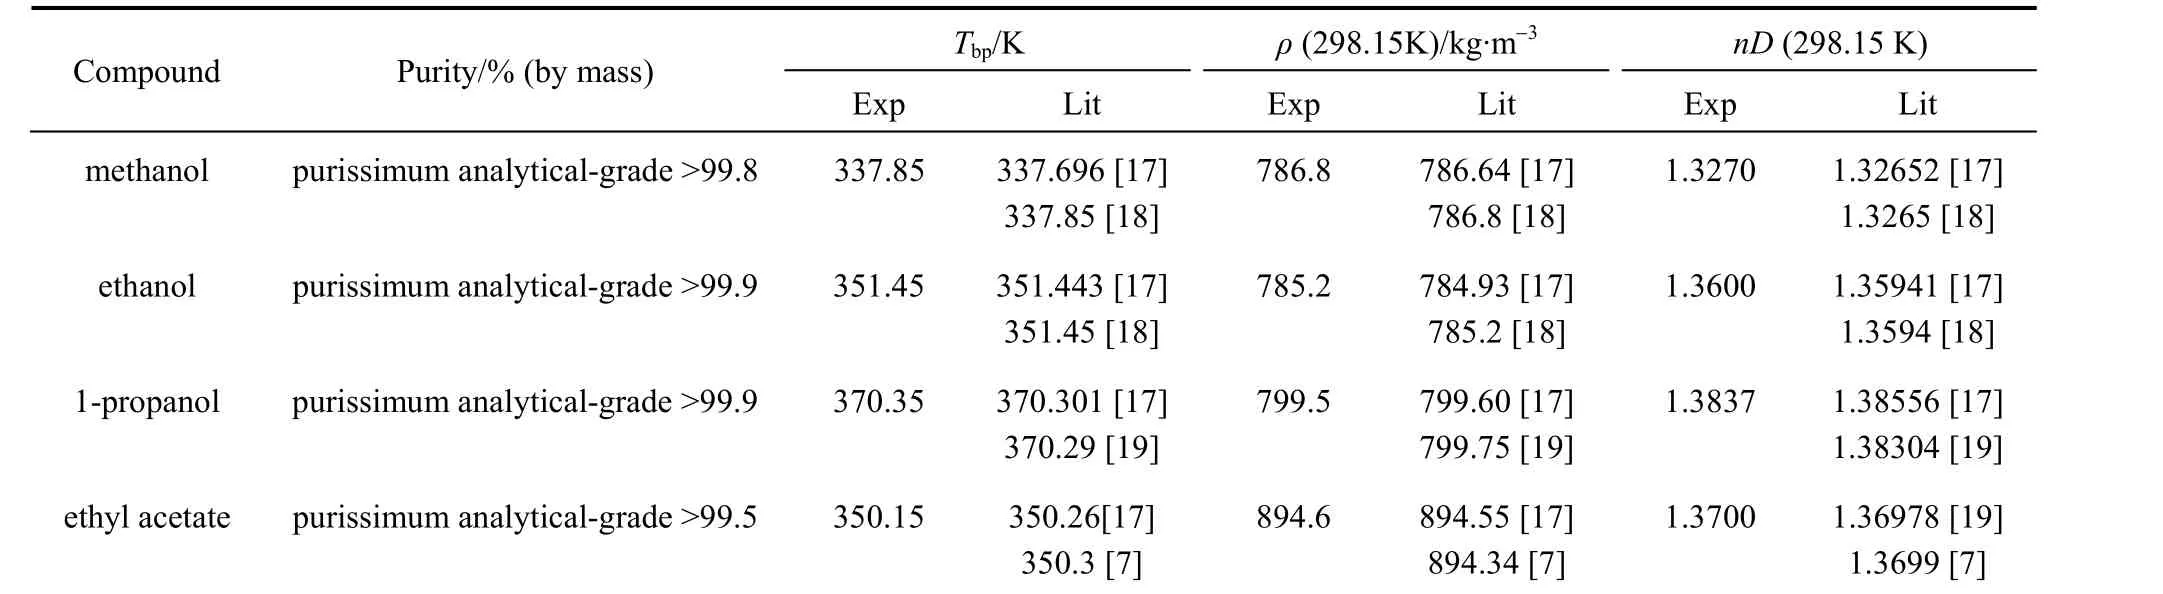
Table 1 Physical properties of pure compounds at atmospheric pressure
Working pressure was measured using a pressure transmitter from Wika Instrument Co. with a 0.0 to 4.0 MPa range (uncertainty of ±0.005 MPa). A controller valve (Binks MFG Co.) was included in order to regulate the flow of dry nitrogen into the equipment for obtaining the VLE data in continuous operation. The system was kept under boiling conditions for 90 min to ensure the stationary state, and then samples of liquid and vapor were extracted in external sealed recipients.
The compositions of the liquid and vapor samples for the binary systems were determined by measuring their densities at 298.15 K with a vibrating-tube density meter (Kyoto Electronics DA-300) with a ±0.1 kg·m-3precision. The composition dependence of densities was previously determined. The accuracy of the composition analysis was better than 0.002 mole fraction units.
3 RESULTS
The VLE data T-x1-y1of ethyl acetate (1) +methanol (2), ethyl acetate (1) + ethanol (2) and ethyl acetate (1) + 1-propanol (2) at 0.3 MPa are shown in Table 2. An assessment of the thermodynamic consistency of these data has been made. The binary data of all the systems pass the consistency test of Fredenslund et al. [12], with the deviation between the calculated and experimental data less than 0.01 mole fraction in the vapor phase.
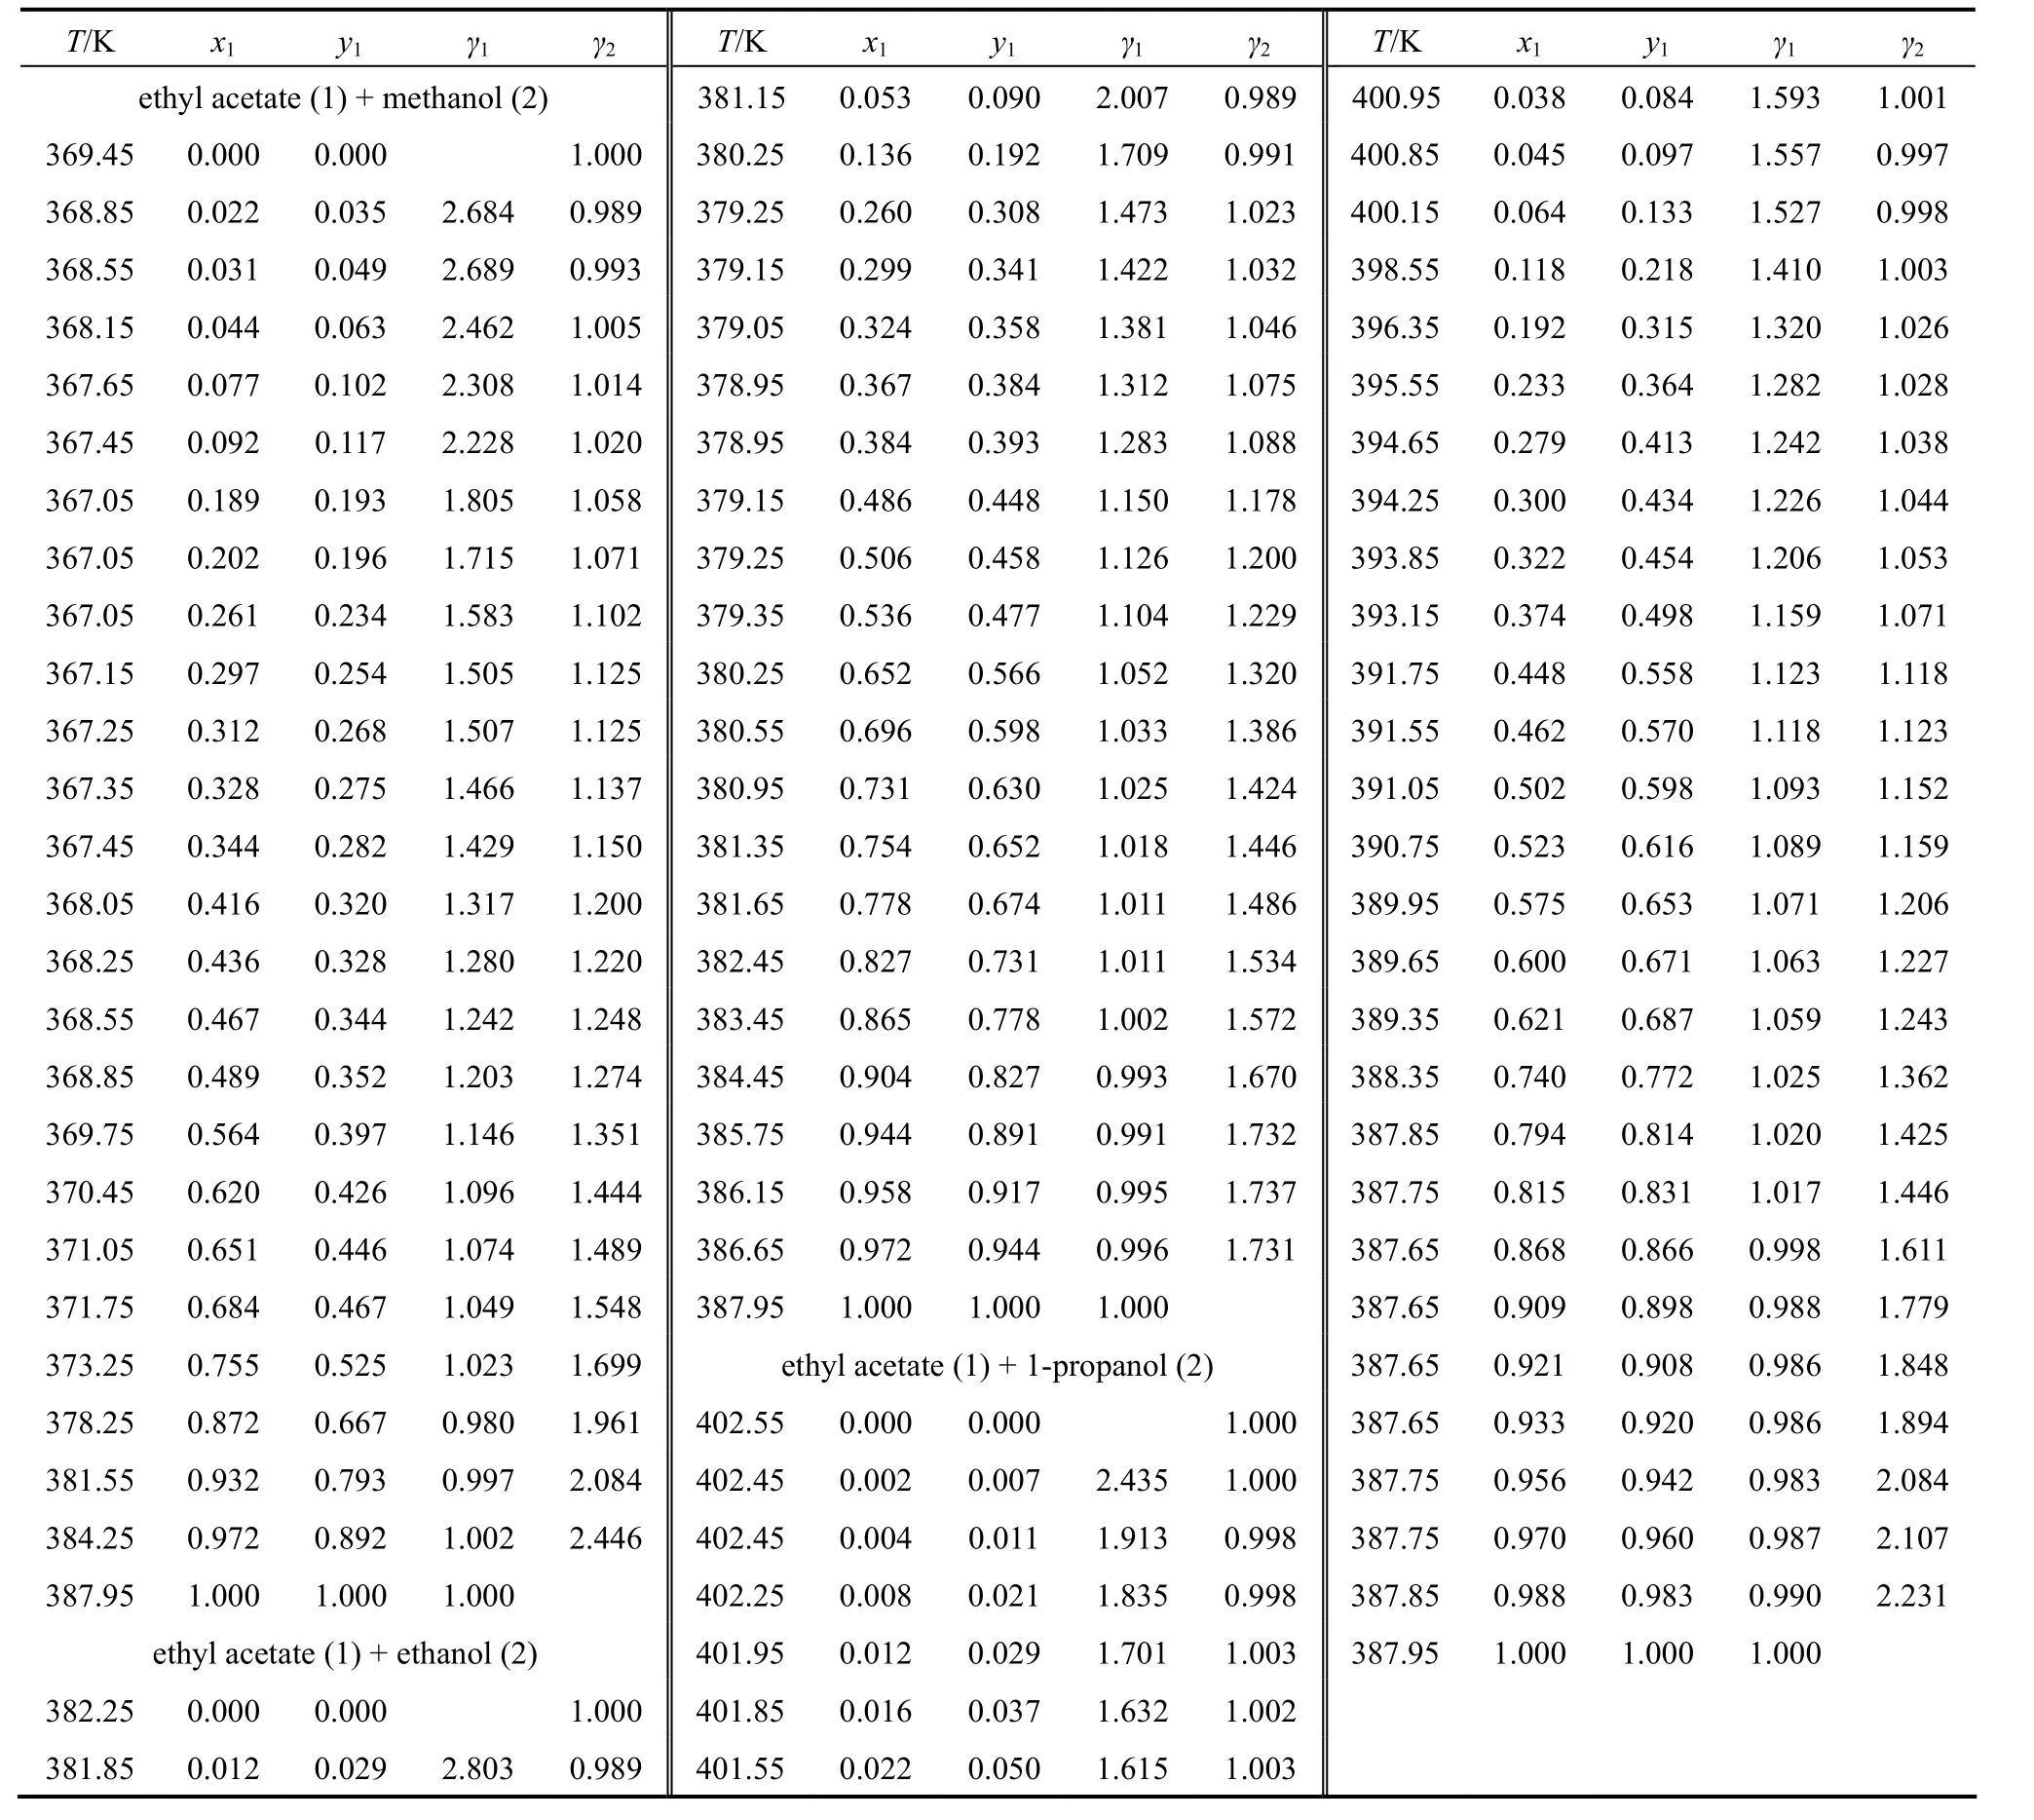
Table 2 VLE experimental data and calculated liquid phase activity coefficients (0.3 MPa)
3.1 Data treatment
The activity coefficients of the liquid phase for every system are determined by using the following equation:
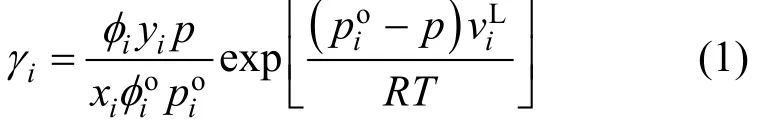
The fugacity coefficients are calculated by using the virial state equation truncated at the second term,from the following equation:
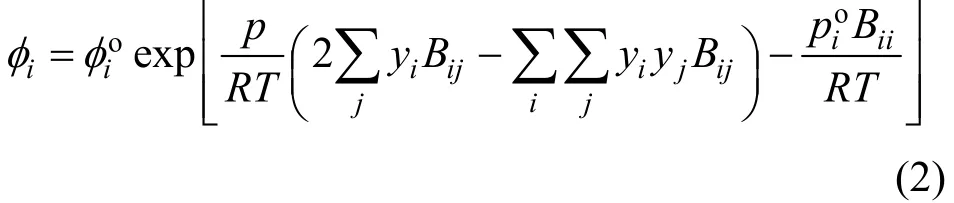
The second virial coefficients,BiiandBij, are obtained by means of the Hayden and O’Connell [21]method. The liquid molar volumes of pure compounds are estimated by the equation of Yen and Woods [22].
The activity coefficients of the liquid phase, calculated from the VLE data (see Table 2) show a positive deviation from ideal behavior probably due to a molecular association by hydrogen bonding. The negative deviation observed is possibly a consequence of experimental errors in temperature and pressure measurements.
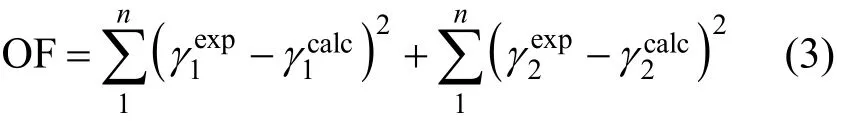
After the point-to-point test is verified for the experimental data of this study, the calculated activity coefficients are correlated using the relationGE/RTvs.x1in the following thermodynamic models: Redlich-Kister,van Laar, Margules, Wilson, NRTL and UNIQUAC.The simplex method is applied, with the minimization of the objective function (OF) as follows:
Good correlations are obtained with the thermodynamic models (see Table 3), and acceptable deviationsare observed in the vapor phase prediction. Globally,the best correlations for these systems are given by the Wilson, NRTL and UNIQUAC models.

Table 3 Correlation parameters for activity coefficients with average and standard deviations (0.3 MPa)

Table 4 Fittings coefficients for FF equations and standard deviations (0.3 MPa)
3.2 Correlation of data
All data processing is performed using the simplex method. Results from the treatment of experimental data with the polynomic equation (FF) used in previous papers [1, 20] are shown in Table 4. The same process is applied to literature data [1, 2, 9] (see Fig. 1).The experimental results at 0.3 MPa presents a good correspondence with literature data at 0.1 MPa.
On the other hand, these systems, for low ester mole fractions, show a decrease in the difference between y1-x1as pressure increases, while the y1-x1difference increases at constant pressure with increasing chains of carbon in the alcohol. At high ester mole fractions this behavior is reversed. For more asseveration,the evolution of different experimental data obtained for every alcohol at 0.3 MPa is presented in Fig. 2.
Furthermore, in previous work [1, 2] the systems ethyl acetate/methanol and ethyl acetate/ethanol were analyzed by considering literature data [3]. In this study, the influence of pressure is also verified for both systems (see Figs. 3 and 4). It is observed that the azeotrope moves towards lower compositions in the ethyl acetate mole fraction with increasing pressure.Therefore, the appearance of the azeotrope in the ethyl acetate/1-propanol system at 0.3 MPa can be a result of the above (see Fig. 5).
3.3 Prediction
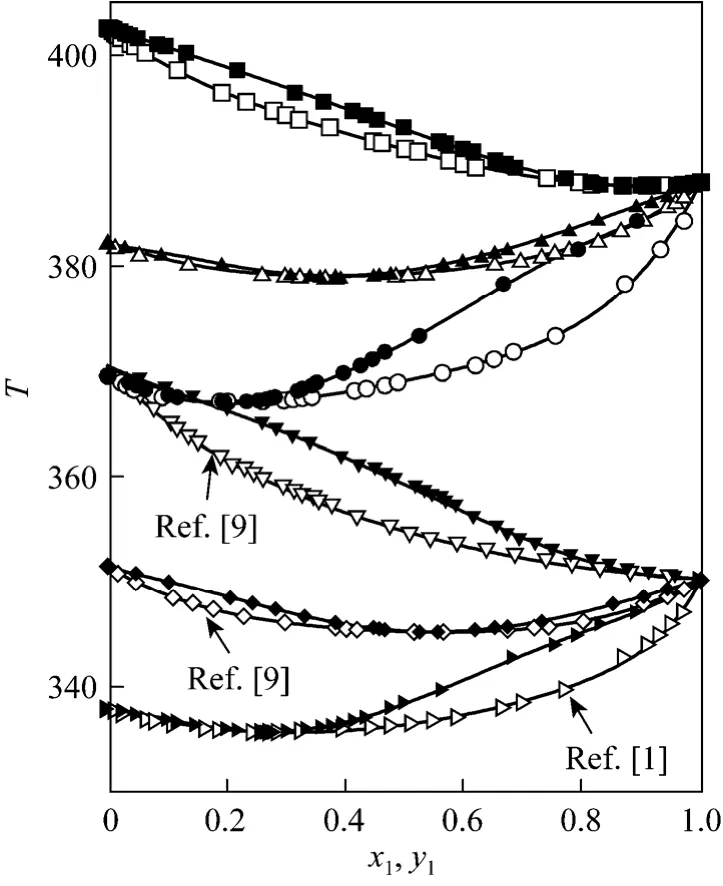
Figure 1 Vapor-liquid equilibrium and fitting curves at 0.3 MPa[(1) ethyl acetate with (2) methanol (○, ●) or with (2) ethanol(△, ▲) or with (2) 1-propanol (□, ■); the literature values and fitting curves at 0.1 MPa: for (1) ethyl acetate + (2) methanol[1] (, ), for (1) ethyl acetate + (2) ethanol [2] (◇, ◆) and for (1) ethyl acetate + (2) 1-propanol [9] (▽, ▼)]
The UNIFAC [13-15] and ASOG [16] group contribution models are useful for the development of separation processes, which are used for prediction of binary VLE data. The experimental data in this paper are compared with those obtained with the UNIFAC and ASOG models.
The overall results are presented in Table 5. It should be noted that, globally, the ASOG and UNIFAC-1993 version provide the best results in the prediction of the activity coefficients. However, the best version of UNIFAC to predict the ethyl acetate +methanol system at 0.3 MPa is UNIFAC-1991. Fig. 2 shows the best results in the VLE prediction for the binary systems studied in this work.
3.4 Azeotropic data
The azeotropic data of ethyl acetate (1) + methanol (2) and ethyl acetate (1) + ethanol (2) at different pressures have been described in literature [1, 2, 10].The experimental study of this paper reports the azeotrope in the system of ethyl acetate (1) +1-propanol (2) at 0.3 MPa, which is not described in the bibliography. Tables 3 and 5 show the results of singular points for these systems, determined through the polynomial equations (see Table 4) that correlate the experimental dataT-x1-y1.
Figure 6 displays the singular points in literature[1, 2, 10] and this work at 0.3 MPa for the binary systems ethyl acetate (1) + methanol (2) or + ethanol (2),or + 1-propanol (2) (see C1, C2 and 1C3, respectively),using reduced properties for temperature (Tr) and pressure (pr).
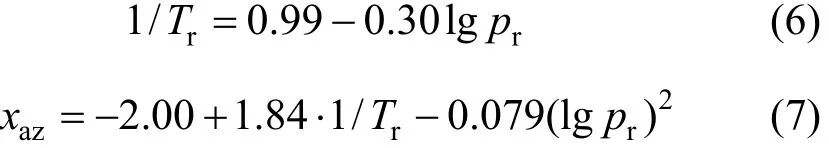
All azeotropic data are correlated in a way indicated previously [1, 2], using a multiple linear regression routine. The procedure is as follows:Trvs.prdataare first correlated and then the data are fitted for thexazvs(Tr,pr) function. The results for azeotropic data in the systems ethyl acetate (1) + methanol (2) and ethyl acetate (1) + ethanol (2) are Eqs. (4), (5) and Eqs.(6), (7), respectively:

Table 5 Results in the prediction of VLE data using ASOG and UNIFAC models (at 0.3 MPa)

Figure 2 Representation points of (y1-x1) vs. x1 at 0.3 MPa[(1) ethyl acetate with (2) methanol (●) or with (2) ethanol (▲)or with (2) 1-propanol (■); curves for the prediction models]
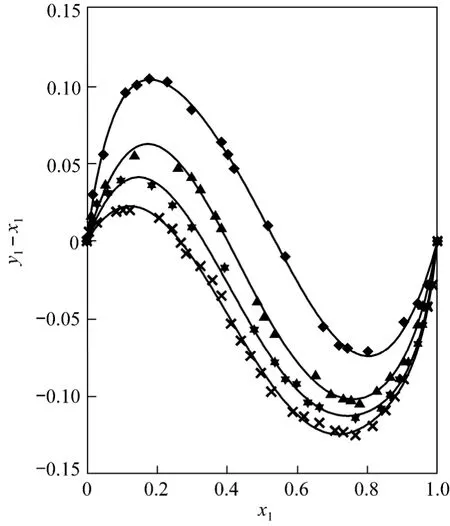
Figure 4 Experimental values and FF curves for ethyl acetate/ethanol system at different pressures[this work at 0.3 MPa (▲) and literature data [2] at 0.1 MPa(◆), at 0.5 MPa () and at 0.7 MPa (×)]


Figure 3 Plot of VLE points and FF curves for ethyl acetate/methanol system at different pressures[this work at 0.3 MPa (●) and literature data [1] at 0.1 MPa (),at 0.5 MPa (★) and at 0.7 MPa (+)]
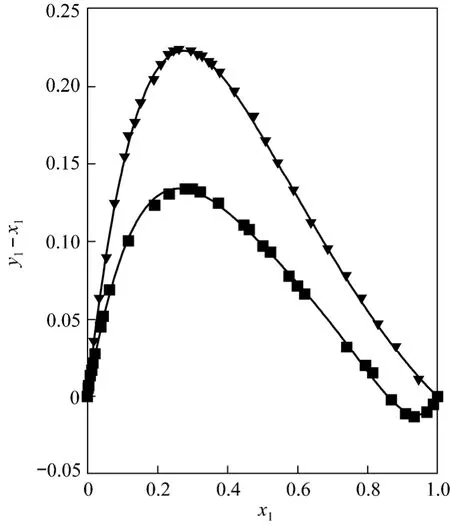
Figure 5 Equilibrium diagram and FF curves for ethyl acetate/1-propanol system at different pressures[this work at 0.3 MPa (■) and literature data [9] at 101.32 kPa (▼)]
The fitting curves for Eqs. (4)-(7) are plotted in Fig. 6. It can be observed that with increasing alcohol chains the azeotrope composition moves towards rich compositions of ester, while with increasing pressure,azeotropes move to high mole fractions of alcohol,which justifies the presence of the azeotrope at 0.3 MPa in the ethyl acetate (1) + 1-propanol (2) system.
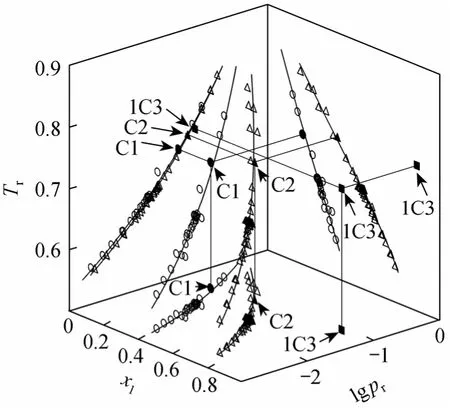
Figure 6 Representation of azeotropic data in reduced coordinates[(1) ethyl acetate with (2) methanol (●) or with (2) ethanol (▲)or with (2) 1-propanol (■) at 0.3 MPa and bibliografic data [1,2, 10] for ethyl acetate/methanol (○) or ethyl acetate/ethanol(△) with fitting curves]
On the other hand, in Table 3 we can see that the thermodynamic models have average errors less than 10% in the prediction of the azeotrope in the binary systems of methanol (2), ethanol (2) and 1-propanol (2)with ethyl acetate (1), while the Margules model shows an average error close to 15% in the prediction of the azeotrope composition for the ethyl acetate (1) +1-propanol (2) system. However, with the group contribution models, globally the UNIFAC-1991 and ASOG models returns better predictions for singular point,with a mean error close to 6% and 7% respectively when considering all three systems, although the UNIFAC-1993 version has a 5% error in the prediction of the azeotrope at 0.3 MPa of the ethyl acetate (1) +ethanol (2) system.
4 CONCLUSIONS
The VLE data for the binary systems of ethyl acetate with methanol or with ethanol or with 1-propanol at 0.3 MPa are determined and verified with the point-to-point test, which agree with the Fredenslund validation criterion.
New azeotropic data for these systems obtained at 0.3 MPa are appropriately positioned with literature data in the xaz-Tr-prplot and justifies the presence of the new singular point in the system ethyl acetate + 1-propanol.
With several thermodynamic mathematical models, the ASOG and different versions of the UNIFAC group contribution models, applied, the predictions are verified and discussed with respect to the experimental data of this study.
NOMENCLATURE
Bijcross second virial coefficient, m3·mol-1
e average error, %
F property [F=y1; F=(y1-x1); F= γ1; F= γ2; F=T; F=GE/(RT)]
GEexcess free energy, J·mol-1
m number of equation parameters
n number of experimental data
nD refractive index
p total pressure, kPa
povapor pressure for pure substance, kPa
R universal gas constant, J·K-1·mol-1RTparameter
T temperature, K
vLmolar volume, m3·mol-1
x liquid-phase mole fraction
y vapor-phase mole fraction
ZTactive fraction of vapor phase or liquid phase
γ activity coefficient
δ mean deviation
ρ density, kg·m-3
σ standard deviation
φ fugacity coefficient
Subscripts
az azeotrope
bp normal boiling point
cal calculated
exp experimental
i, j chemical substances 1 ester
1 Susial, P., Sosa-Rosario, A., Rios-Santana, R., “Vapor-liquid equilibria for ethyl acetate + methanol at (0.1, 0.5, and 0.7) MPa. Measurements with a new ebulliometer”, J. Chem. Eng. Data, 55, 5701-5706 (2010).
2 Susial, P., Sosa-Rosario, A., Rodriguez-Henriquez, J.J., Rios-Santana,R., “Vapor pressure and VLE data measurements on ethyl acetate/ethanol binary system at 0.1, 0.5, and 0.7 MPa”, J. Chem. Eng.Jpn, 44, 155-163 (2011).
3 Gmehling, J., Onken, U., Arlt, W., Grenzheuser, P., Weidlich, U.,Kolbe, B., Rarey, J., Vapor-Liquid Equilibrium Data Collection, Vol.1, Part 2, Dechema, Frankfurt, Germany (1986).
4 Orchillés, A.V., Miguel, P.J., Vercher, E., Martinéz-Abreu, A., “Isobaric vapor-liquid equilibria for ethyl acetate + ethanol + 1-ethyl-3-methylimidazolium Trifluoro-methane-sulfonate at 100 kPa”, J.Chem. Eng. Data, 52, 2325-2330 (2007).
5 Calvar, N., Domínguez, A., Tojo, J., “Vapor-liquid equilibria for the quaternary reactive system ethyl acetate + ethanol + water + acetic acid and some of the constituent binary systems at 101.3 kPa”, Fluid Phase Equilib., 235, 215-222 (2005).
6 Chein-Hsiun, T., Yuh-Shen, W., Feng-Chao, O., “Effect of 1,2-Propanediol on the vapor-liquid equilibria of the ethyl acetate +ethanol system at 101.3 kPa”, Fluid Phase Equilib., 130, 243-252(1997).
7 Ortega, J., Peña, J.A., de-Afonso, C., “Isobaric vapor-liquid equilibria of ethyl acetate + ethanol mixtures at (760 ± 0.5) mmHg”, J. Chem.Eng. Data, 31, 339-342 (1986).
8 Topphoff, M., Kiepe, J., Gmehling, J., “Effects of lithium nitrate on the vapor-liquid equilibria of methyl acetate + methanol and ethyl acetate + ethanol”, J. Chem. Eng. Data, 46, 1333-1337 (2001).
9 Ortega, J., Peña, J.A., “Isobaric VLE for the ethyl acetate + n-propanol and n-butanol”, Rev. Lat. Am. Ing. Quim., 16, 317-321 (1986).
10 Gmehling, J., Menke, J., Krafczyk, J., Fischer, K., Azeotropic Data,Part 1, 2nd, edition, Wiley-VCH Verlag, Weinheim, Germany (2004).
11 van Ness, H.C., Byer, S.M., Gibbs, R.E. “Vapor-liquid equilibrium (I)An appraisal of data reduction methods”, AIChE J., 19, 238-244 (1973).
12 Fredenslund, A., Gmehling, J., Rasmussen, P., Vapor-Liquid Equilibria Using UNIFAC. A Group Contribution Model, Elsevier, Amsterdam (1977).
13 Larsen, B.L., Rasmussen, P., Fredenslund, A., “A modified UNIFAC group-contribution model for prediction of phase equilibria and heats of mixing,” Ind. Eng. Chem. Res., 26, 2274-2286 (1987).
14 Hansen, H.K., Rasmussen, P., Fredenslund, A., Schiller, M., Gmehling, J., “Vapor-liquid equilibria by UNIFAC group-contribution. 5.Revision and extension”, Ind. Eng. Chem. Res., 30, 2355-2358 (1991).
15 Gmehling, J., Li, J., Schiller, M., “A modified UNIFAC model. 2.present parameter matrix and results for different thermodynamic properties”, Ind. Eng. Chem. Res., 32, 178-193 (1993).
16 Kojima, K., Tochigi, K., Prediction of Vapor-Liquid Equilibria by the ASOG Method, Kodansha Ltd., Tokyo (1979).
17 Riddick, J.A., Bunger, W.B., Sakano, T.K. Organic Solvents,Wiley-Interscience, New York (1986).
18 Nagata, I., Ohta, T., Nakagawa, S., “Excess Gibss free energies and heats of mixing for binary alcoholic liquid mixtures”, J. Chem. Eng.Jpn., 9, 276-281 (1976).
19 Resa, J.M., Gonzalez, C., Goenaga, J.M., “Density, refractive index,speed of sound at 298.15 K, and vapor-liquid equilibria at 101.3 kPa for binary mixtures of propanol + 2-methyl-1-butanol and propanol +3-methyl-1-butanol”, J. Chem. Eng. Data, 51, 73-78 (2006).
20 Susial, P., Sosa-Rosario, A., Rios-Santana, R., “VLE with a new ebulliometer. ester-alcohol systems at 5.0 bar”, Chin. J. Chem. Eng., 18,1000-1007 (2010).
21 Hayden, J.G., O’Connell, J.P., “A generalised method for predicting second virial coefficients”, Ind. Eng. Chem. Process Des. Dev., 14,209-216 (1975).
22 Yen, L.C., Woods, S.S., “A generalized equation for computer calculation of liquid densities”, AIChE J., 12, 95-99 (1966).
杂志排行

Chinese Journal of Chemical Engineering的其它文章
- Phenol Oxidation by Combined Cavitation Water Jet and Hydrogen Peroxide*
- Venting Design for Di-tert-butyl Peroxide Runaway Reaction Based on Accelerating Rate Calorimeter Test
- Effect of Return Sludge Pre-concentration on Biological Phosphorus Removal in a Novel Oxidation Ditch*
- Separation of α-Tocopherol with a Two-Feed Simulated Moving Bed*
- Experimental and CFD Studies on the Performance of Microfiltration Enhanced by a Turbulence Promoter*
- Pervaporation of Aqueous Solution of Acetaldehyde Through ZSM-5 Filled PDMS Composite Membrane*