Effect of Return Sludge Pre-concentration on Biological Phosphorus Removal in a Novel Oxidation Ditch*
2012-02-14LIUWei刘巍YANGDianhai杨殿海XULi徐立JIAChuan贾川LUWenjian卢文建BOSIREOmosaIsaiahandSHENChangming沈昌明
LIU Wei (刘巍), YANG Dianhai (杨殿海),**, XU Li (徐立), JIA Chuan (贾川), LU Wenjian(卢文建), BOSIRE Omosa Isaiah and SHEN Changming (沈昌明)
1 State Key Laboratory of Pollution Control and Resources Reuse, College of Environmental Sciences and Engineering, Tongji University, Shanghai 200092, China
2 UNEP-TONGJI Institute of Environment for Sustainable Development, College of Environmental Sciences and Engineering, Tongji University, 200092 Shanghai, China
1 INTRODUCTION
As the effluent standards become more and more stringent, discharging wastewater with low levels of phosphorus and nitrogen requires further upgrade of the existing wastewater treatment plants (WWTPs).For combined nitrogen and phosphorus removal processes, the competition for organic carbon source between denitrifiers and phosphorus accumulation organisms (PAOs) may be a critically important factor affecting their removal efficiencies. When the influent readily biodegradable chemical oxygen demand(rbCOD) is sufficient, both nitrogen and phosphorus can be removed efficiently; otherwise incomplete denitrification may result in high levels of3NO--N in the effluent, since the return activated sludge (RAS)will increase the competition between denitrifiers and PAOs in anaerobic zone and deteriorate the enhanced biological phosphorus removal (EBPR) process in the system severely. Recently, many investigations have focused on the competition for available carbon source in the anaerobic phase between denitrifiers and PAOs in order to lessen this adverse effect.
It is widely acknowledged that the remaining-N brought by the RAS changes the anaerobic zone into an anoxic zone, which in turn damages the anaerobic process of EBPR system [1-4]. Nitrate in the anaerobic zone leads to the competition for available carbon source between denitrifiers and PAOs and inhibits the anaerobic phosphorus release severely, especially when the system is under the “initial substrate limited” condition [5]. Peng et al. [6] showed that a remaining3NO--N content below 6 mg·L-1was the necessary condition to achieve 80% total phosphorus(TP) removal efficiency. Zou et al. [7] found that anaerobic phosphorus release rate declined as soon as-N was added to the anaerobic zone, resulting in low phosphorus removal efficiency. Kazmi et al. [8]modeled the remaining3NO--N shock on phosphorus removal, and showed that with the increase of remaining-N from 10 mg·L-1to 20 mg·L-1, the low phosphorus release in the anaerobic zone would be inhibited completely and the TP content in the effluent was much higher than before. Chang and Hao [9] observed that when the nitrate content in effluent reduced from 10.9 mg·L-1to 5.6 mg·L-1, phosphorus removal efficiency increased from 80% to 98%. However, Hayakawa et al. [10] showed that less than 1 mg·L-1effluent3NO--N was helpful in maintaining TP of 0.8 mg·L-1in the effluent. Comeau et al. [11] claimed that anaerobic environment with less nitrate was required to stimulate the phosphorus release with carbon source uptake by PAOs in order to achieve high phosphorus removal efficiency. The above-mentioned results are different from each other because of different COD contents in the influent in these studies, but the same conclusion is obtained that the remaining3NO--N in the RAS would deteriorate biological phosphorus removal processes.
For maintaining high phosphorus removal efficiency, it is necessary to eliminate nitrate in the RAS[12]. In order to protect the anaerobic conditions for sufficiently available carbon source uptake and phosphorus release by PAOs, pre-denitrification and post-denitrification are always adopted to remove the remaining nitrate in the effluent and the RAS [4]. In the former process, the RAS is first denitrified in a separate anoxic tank and then transferred into the anaerobic zone; while in the latter, the mixed liquor of the system is finally denitrified in an anoxic tank for further reduction of remaining nitrate. However, these processes always require exogenous carbon source.
In this study, municipal wastewater with limited carbon source is treated by a novel oxidation ditch (OD)system, which is modified with an additional pre-anoxic zone and a RAS pre-concentration tank. The anaerobic zone is divided into two sections to enhance the driving force of reaction for improving the utilization of anaerobic carbon source. The presence of the pre-anoxic zone will enhance3NO--N elimination efficiency in the RAS before it enters the anaerobic zone for protecting the strict anaerobic condition. The RAS pre-concentration tank will enhance the3NO--N removal efficiency in the pre-anoxic zone and improve the phosphorus removal efficiency of the system. In the study, the effect of RAS pre-concentration on eliminating the remaining NO3-N by endogenous denitrification, biological phosphorus removal efficiency and the sludge characteristics are investigated by varying the RAS pre-concentration ratio. The experiments will demonstrate how RAS pre-concentration is adopted as an effective method for enhancing biological phosphorus removal without adding external carbon source.
2 MATERIALS AND METHODS
2.1 Pilot-scale plant
A pilot-scale OD system shown in Fig. 1 was specially designed and operated at Chaohu Wastewater Treatment Plant (WWTP), Anhui Province. The whole process consists of a pre-anoxic zone, anaerobic zone I, anaerobic zone II, an OD bioreactor, a secondary clarifier and a pre-concentration tank with working volumes of 0.96, 1.53, 1.53, 28.8, 8.2 and 1.36 m3,respectively. The influent of 2 m3·h-1is pumped into the anaerobic zone I, giving a hydraulic retention time(HRT) of 1.53 and 14.4 h respectively in the anaerobic zone (I+II) and the OD before it enters the secondary clarifier. The RAS is pumped into the pre-concentration tank for sludge pre-concentration. Then, the supernatant fluid generated in the pre-concentration process flows back into the OD bioreactor by gravity, and the pre-concentrated RAS is pumped into the pre-anoxic zone for eliminating NO3-N by endogenous denitrification. Three mixers are set up for preventing sludge settling in the pre-anoxic zone, anaerobic zone I and aerobic zone II, and a disc aerator is employed for supplying oxygen while a liquid propeller is equipped for mixing in the OD bioreactor. Waste sludge is removed from the system by discharging some RAS twice a day in order to control the solid retention time(SRT) at 18-20 d. Dissolved oxygen (DO), pH, oxidation-reduction potential (ORP), and mixed liquor suspended solid (MLSS) are measured on-line by probes.Programmable logic controller (PLC) is adopted to adjust the rotating speed of disc aerator according to the DO value monitored by the DO probe in the aerobic zone of the OD bioreactor. RAS pump and pre-concentrated RAS pump are controlled by PLC for different operational conditions.
The experiment was carried out from June 2010 to October 2010 (132 d). All the experiments were conducted at water temperatures between 17 °C and 24 °C. The operational period included four stages with different RAS pre-concentration ratios, as the operational conditions summarized in Table 1.
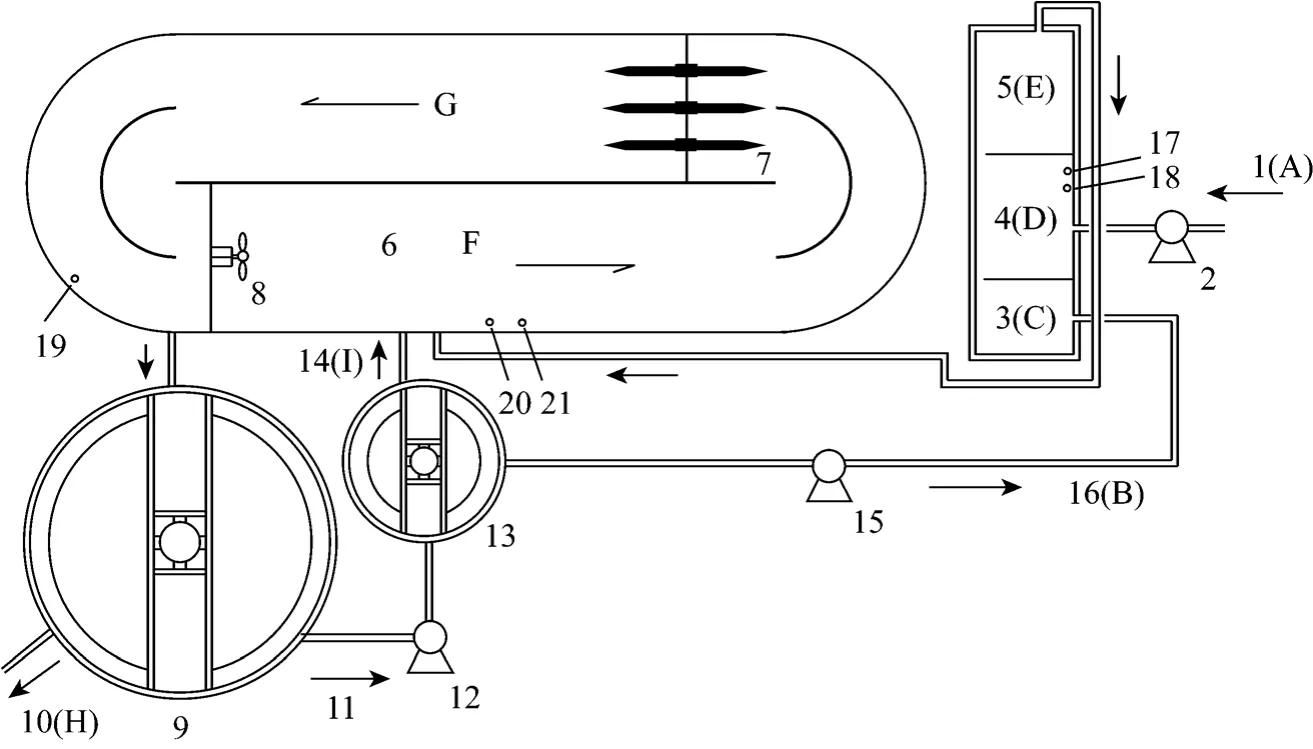
Figure 1 Schematic diagram of the novel pilot-scale OD system1—influent; 2—influent pump; 3—pre-anoxic zone; 4—anaerobic zone I; 5—anaerobic zone II; 6—OD; 7—disc aerator; 8—liquid propeller; 9—secondary clarifier; 10—effluent; 11—RAS; 12—RAS pump; 13—pre-concentration tank; 14—supernatant fluid;15—pre-concentrated RAS pump; 16—pre-concentrated RAS; 17—pH probe; 18—ORP probe; 19, 20—DO probe; 21—MLSS probe; A—influent; B—pre-concentrated return activated sludge; C—pre-anoxic zone; D—anaerobic zone I; E—anaerobic zone II;F—anoxic zone in OD; G—aerobic zone in OD; H—effluent; I—supernatant of pre-concentration tank
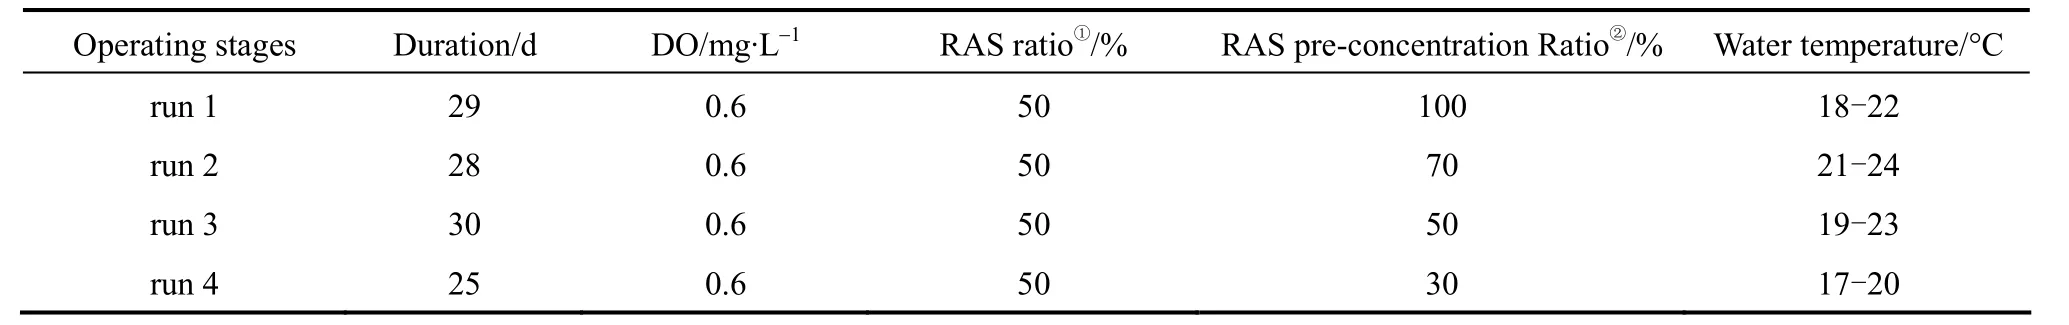
Table 1 Operation conditions for each stage
2.2 Sludge and wastewater
Both the sludge and the wastewater were taken from the OD process of the Chaohu Gangling Wastewater Treatment Plant. The MLSS was controlled to 1400-1600 mg·L-1. The wastewater was fetched from the grit removal tank by influent pump. The major characteristics of the influent with carbon source limited are shown in Table 2.
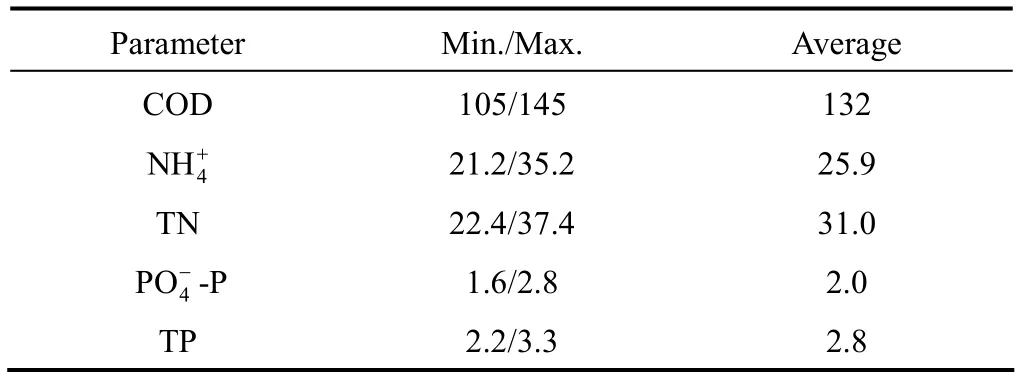
Table 2 Major characteristics of the influent (mg·L-1)
2.3 Batch tests
2.3.1Batch test I
In order to investigate the effect of operating conditions on P release or uptake rate of the sludge,batch tests were adopted to simulate the anaerobic,anoxic and aerobic processes. 5 L of the sludge from the aerobic zone of the OD bioreactor was put into a laboratory sequence batch reactor (SBR) for settling,and then 4 L of the supernatant liquid was removed from the SBR. Afterwards, the concentrated sludge was washed with tap water to remove3NO--N and settled again. 4 L of the simulated wastewater containing 330 mg acetic acid and 15 mg SOP was added for a total volume of 5 L mixed liquor in the SBR reactor. The SBR was kept under anaerobic condition for 2 h by stirring only, then the mixed liquor was divided into two equal parts: one was exposed to aerobic conditions for 4-5 h (aerobic period was initiated by sparging compressed air though a diffuser at the bottom of the reactor), and the other was exposed to anoxic condition for 4-5 h after potassium nitrate was added to obtain a concentration of 15 mg·L-13NO--N in the reactor (anoxic period was kept by stirring and nitrogen gas injection to prevent oxygen penetration).During the test process, samples were taken at certain intervals for COD,-P and-N analysis.
2.3.2Batch test II
二是基于生产效率人工智能技术应用。近年来,重庆已经建立了数十个数字内容资源库,在2018年及更长时间,企业会着手数据资源的挖掘和应用,会带动人工智能技术在数字出版领域的应用,通过挖掘相关内容资源,实现内容快速生成和聚合,人工智能技术在城市文化传播、传统文化传承等领域将得到广泛应用,对提升数字出版业创新能力和经济效益具有重要支撑作用。
4 L of pre-concentrated RAS from the inlet of the pre-anoxic zone was put into a 5 L laboratory SBR and stirred for 3 h. During the process, samples were taken from the SBR every 15 min for-P,-N, and-N analysis, while pH and ORP were measured by online probes .
2.4 Analytical methods
Wastewater samples from the reactor for the analysis of dissolved substances were filtered using 0.45 mm filter papers to separate the bacterial cells from liquid column and immediately cooled in order to prevent further reaction. CODcr, MLSS, MLVSS,wastewater samples were measured according to the standard methods (APHA, 1995) [13] while sludge TP was analyzed by the persulfate digestion followed by the vanado-molybdate colorimetric method. The DO,pH, ORP, and temperature were measured continuously by on-line probes (HACH, U.S.).
3 RESULTS AND DISCUSSION
3.1 Effects of RAS pre-concentration on phosphorus removal
Phosphorus release and uptake profile in the modified OD system during four different operational stages are shown in Fig. 2.content in the influent of all stage conditions was around 1.8 mg·L-1except that of run 3, which was 2.1 mg·L-1. However,the effluentcontent of 1.1 mg·L-1in run 3 was the lowest among the four stages. The phosphorus release in the anaerobic zone increased from run 1 to run 3, but it decreased in run 4. Compared with 3.5 and 3 mg·L-1of the anaerobic phosphorus release in run 3 and run 4 respectively, those in run 1 and run 2 were negligible (0.2 and 0.3 mg·L-1respectively). In run 1 or run 2, there was phosphorus uptake in the pre-anoxic zone, whereas in run 3 or run 4 there was phosphorus release in the pre-anoxic zone. Furthermore,run 4 had more phosphorus release in pre-anoxic zone than run 3. The results illustrated that the RAS pre-concentration enhanced the phosphorus release in the anaerobic zones and the phosphorus uptake in the OD bioreactor, but excessive pre-concentration of RAS resulted in phosphorus release without COD uptake in the pre-anoxic zone, which was adverse to phosphorus removal.
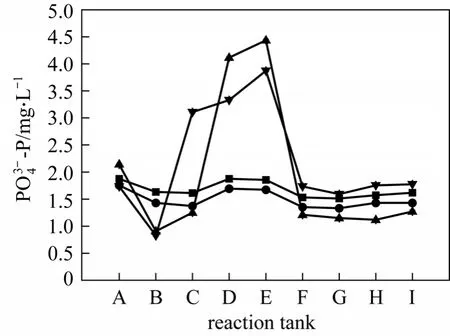
Figure 2 SOP profiles in the novel pilot-scale OD system in different operational stages■ 100% pre-concentration; ● 70% pre-concentration; ▲ 50%pre-concentration; ▼ 30% pre-concentration
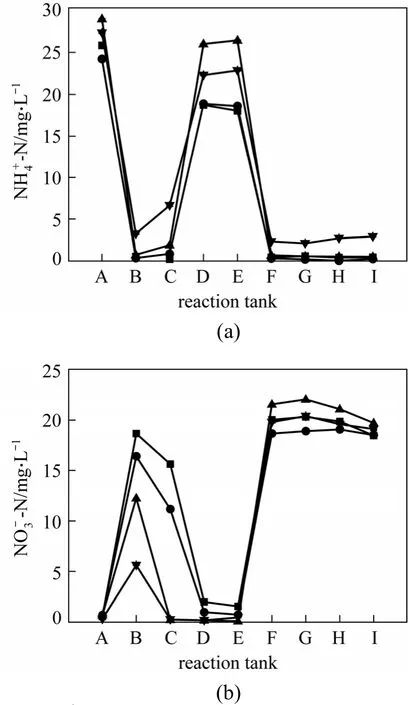
Figure 3 4NH+ (a) and 3NO- (b) profiles in the novelpilot scale OD system in different operational stagesA—influent; B—pre-concentrated return activated sludge;C—pre-anoxic zone; D—anaerobic zone I; E—anaerobic zone II; F—anoxic zone in OD; G—aerobic zone in OD; H—effluent; I—supernatant of pre-concentration tank■ 100% pre-concentration; ● 70% pre-concentration; ▲ 50%pre-concentration; ▼ 30% pre-concentration
Figure 3 shows4NH+and3NO-profiles in different operational stages.4NH+in anaerobic zone was brought by the influent and the pre-anoxic effluent,with the addition of organic nitrogen ammonification in itself. As shown in Fig. 3 (a),4NH+was higher in anaerobic zones of run 3 and run 4, 26.5 and 22.8 mg·L-1, respectively, while that of run 1 and run 2 was 18.1 and 18.6 mg·L-1, respectively. The reasons are less dilution effect by the effluent mixture from the pre-anoxic zone and more ammonification effect owing to higher MLSS content in anaerobic zones of run 3 or run 4 than that of run 1 or run 2 due to further RAS pre-concentration. In addition, more4NH+was released in the pre-anoxic zone of run 3 or run 4 than in that of run 1 or run 2 because of endogenous digestion. However, pre-concentration ratios did not affect nitrification process in the OD bioreactor although 2.7 mg·L-1effluent4NH+of run 4 was higher than that of the others, which were all below 0.5 mg·L-1because of the low temperature.
Figure 3 (b) shows that with the decrease of preconcentration ratio, the nitrate in the pre-concentrated RAS, the pre-anoxic zone and the anaerobic zone I are 18.7, 15.6 and 2.0 mg·L-1in run 1, 16.4, 11.2 and 1.0 mg·L-1in run 2, 12.2, 0.2 and 0.2 mg·L-1in run 3, and 5.6, 0.2 and 0.2 mg·L-1in run 4. The results indicate that the lower the RAS pre-concentration ratio, the less nitrate is found in the pre-concentrated RAS,pre-anoxic zone and anaerobic zone I. However, RAS pre-concentration is adverse to nitrogen removal because some supernatant of the RAS pre-concentration tank returned to the OD without further denitrification will increase the nitrate loading rate.
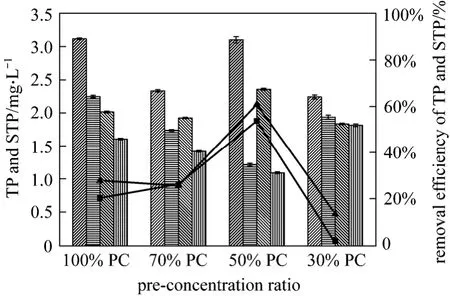
Figure 4 TP and STP removal efficiencies in different operational stagesinfluent TP;effluent TP;influent STP;effluent STP■ removal efficiency (STP); ▲ removal efficiency (TP)
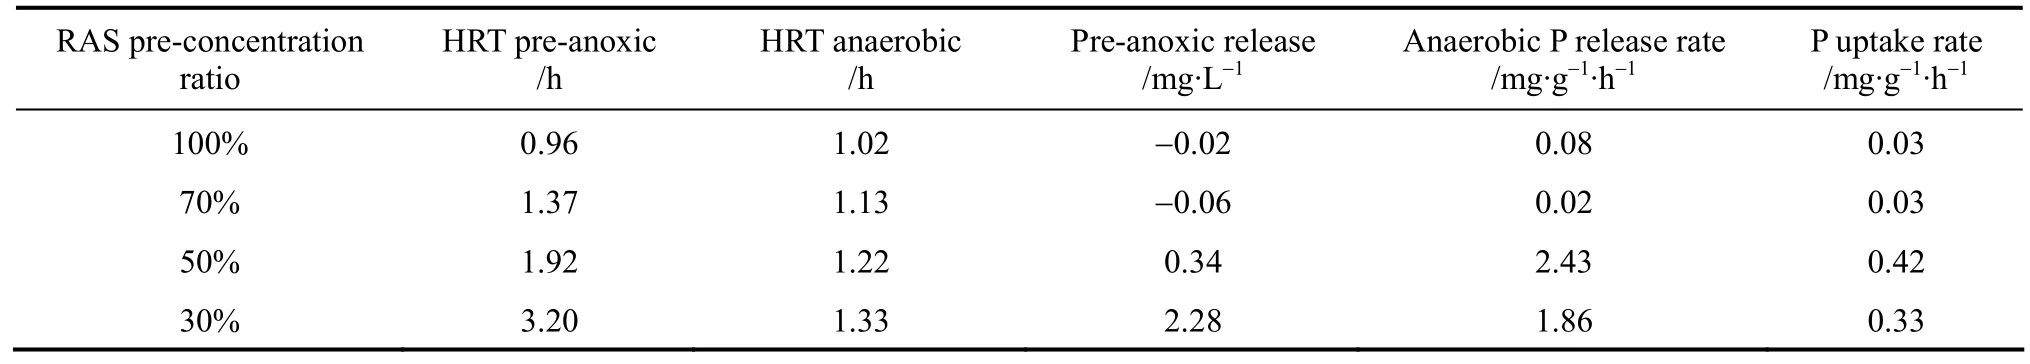
Table 3 Phosphorus release and uptake rates in pre-anoxic, anaerobic and OD zones at different RAS pre-concentration ratios
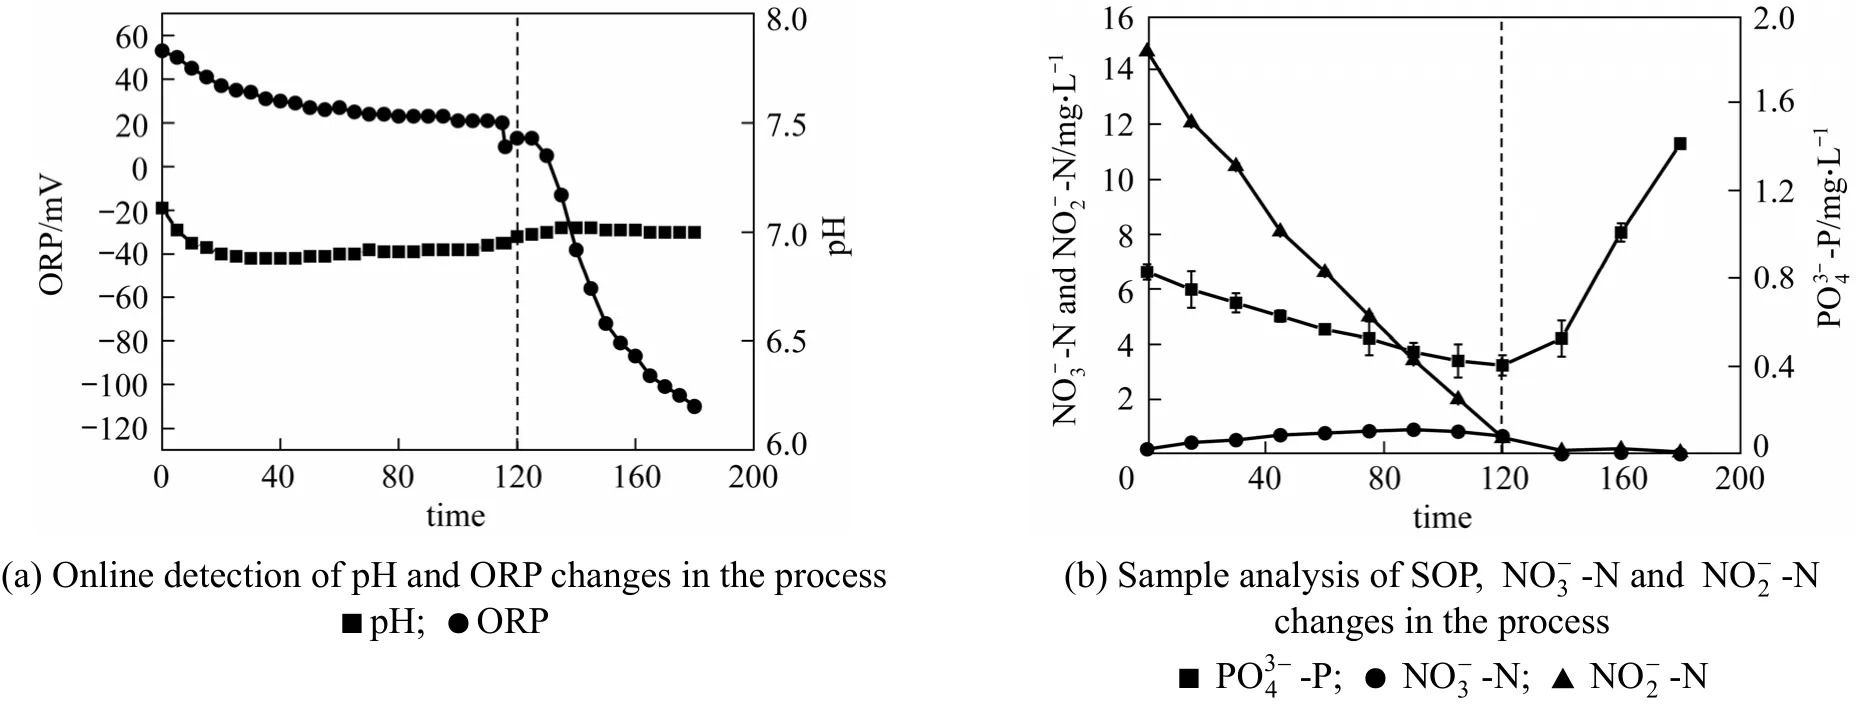
Figure 5 Phosphorus uptake and release profile of the return activated sludge under pre-anoxic condition in batch test II
The TP and STP removal efficiencies in four operational stages are shown in Fig. 4. The TP and STP contents in the effluent are 2.2 and 1.6 mg·L-1for run 1, 1.7 and 1.4 mg·L-1for run 2, 1.2 and 1.1 mg·L-1for run 3, and 1.9 and 1.8 mg·L-1for run 4. The removal efficiencies of TP and STP exhibit similar trends.From run 1 to run 3, the TP and STP removal efficiencies increases from 27.9% to 60.1% and from 20.4%to 53.8%, respectively, whereas they decline to 13.6%and 1.1% in run 4. Table 3 shows the phosphorus release rate and the phosphorus uptake rate in different operational stages. It is evident that the rates of phosphorus release and uptake in run 3 are 2.43 and 0.42 mg·g-1·h-1(based on VSS), respectively, which are the highest among the four. With the increase of HRT in the pre-anoxic zone and the anaerobic zone by further pre-concentration of the RAS, the changes of phosphorus release and uptake rate from run 1 to run 4 have similar trend for the TP and STP removal efficiencies.However, there is also some phosphorus release in the pre-anoxic zone of run 3.
The ratios COD/TN and COD/TP in the influent of the novel OD system were around 4 and 45, respectively, which was characterized with carbon source limited and inadequate for both efficient nitrogen and phosphorus removal [8, 14-16]. Thus, according to some reports focused on the competition between denitrification and phosphorus release under anoxic condition, the advantage in carbon source competition determines the role of the novel oxidation system [17].The results mentioned above indicate that enhancing the RAS pre-concentration will improve the nitrate removal efficiency of the pre-anoxic zone so that the mixed liquid flowing into the anaerobic zone I contains less nitrate. The pre-concentrated RAS has higher MLSS than the RAS, which results in lower sludge-N loading rate in the pre-anoxic zone. Furthermore, the flow rate of the RAS is reduced through pre-concentration so that the HRT for reactions in the pre-anoxic zone and the anaerobic zones is prolonged.As a result, available carbon source uptake and phosphorus release by PAOs in the anaerobic zone will be promoted, which are favorable for phosphorus removal.In addition, the phosphorus uptake with nitrate removal in the pre-anoxic zone implies that there are denitrifying phosphorus accumulation organisms (DPAOs) in the activated sludge. However, excessive pre-concentration of the RAS will cause secondary phosphorus release in the pre-anoxic zone because of electron acceptor exhaustion and the energy demand for endogenous process, which is detrimental to phosphorus removal process [18]. Thereby, excess RAS pre-concentration in run 4 reduced the phosphorus removal efficiency.
3.2 Control strategy for anoxic phosphorus removal in the pre-anoxic zone
In order to evaluate the optimum RAS pre-concentration ratio for promoting phosphorus removal, the endogenous denitrification and phosphorus removal processes of the pre-concentrated RAS in pre-anoxic zone were investigated by batch test II.According to the results obtained from the analysis of the samples taken from the SBR in batch test process shown in Fig. 5, there were “phosphorus knee point”and “ORP knee point” in the reaction process. Interestingly, the two points appeared at 120 min simultaneously when3NO--N and2NO--N were 0.6 and 0.7 mg·L-1respectively after the reaction started. Before the “knee point”,-P and3NO--N decreased from 0.8 and 14.6 mg·L-1to 0.4 and 0.6 mg·L-1respectively, while2NO--N increased gradually from 0.2 mg·L-1to 0.9 mg·L-1in the initial 90 min and then decreased to 0.7 mg·L-1in the subsequent 30 min.After the “knee point”,3NO--N and2NO--N continuously decreased to zero while-P increased drastically to 1.4 mg·L-1in 60 min to the end of the reaction. In the entire process, ORP declined all the time.Before the “knee point”, ORP decreased gradually from 53 mV to 13 mV, while after the “knee point”,the declining trend intensified instantly. At the end of the reaction, ORP finally decreased to -110 mV. There was almost no change of pH before the “knee point”,but after the “knee point”, a slight increase appeared.However, the change of pH was inconspicuous in contrast to those of ORP. The results indicated that in order to reduce nitrate content and restrain secondary phosphorus release in the pre-anoxic zone, it is better to control the pre-anoxic reaction before the “ORP knee point” or the “phosphorus knee point”.
According to other studies, nitrate of 1-1.5 mg·L-1could inhibit secondary phosphorus release effectively because nitrate could be used as electron acceptor for PHA or glycogen oxidation, which could restrain secondary phosphorus release and supply the energy demanded for the endogenous process [19-21]. Since controlling the ORP in the pre-anoxic zone at 13 mV at different influent organic and nutrient loading rates was exceedingly difficult, the RAS pre-concentration ratio was controlled by keeping ORP between 21 and 13 mV in the pre-anoxic zone. Under this condition,phosphorus removal was improved in the pre-anoxic zone and the nitrate concentration was controlled between 1 and 3 mg·L-1, which had no detrimental effects in the anaerobic zones.
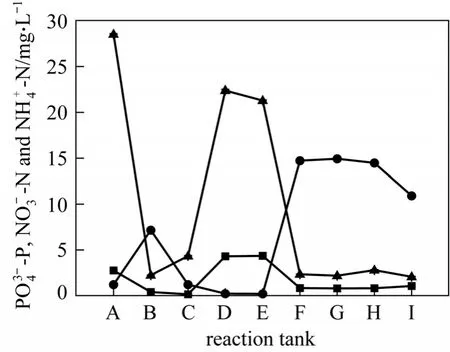
Figure 6 profiles in the novelpilot scale OD system under optimum pre-concentration operational conditionA—influent; B—return activated sludge; C—pre-anoxic zone;D—anaerobic zone I; E—anaerobic zone II; F—anoxic zone in OD; G—aerobic zone in OD; H—effluent; I—supernatant of pre-concentration tank
ORP in the pre-anoxic zone. Secondary phosphorus release was restrained in the pre-anoxic zone and the nitrate was 1.2 mg·L-1, which did not affect the phosphorus release in the anaerobic zone. The effluent-P was almost 0.8 mg·L-1. The removal efficiencies of TP and STP were 63.9% and 58.9%, respectively.
3.3 Effects of RAS pre-concentration on PAOs
In the novel OD system, wastewater first flew into the anaerobic zone and carbon source could be selectively taken up by PAOs to store as polyhydroxyalkanoates (PHAs) simultaneously with the degradation of ply-P and glycogen. In the following OD system, PHAs was utilized by PAOs as electron donor in order to supply energy and substrate for phosphorus uptake, ply-P and glycogen synthesis. For investigating the effect of RAS pre-concentration on system sludge, batch tests were carried out to compare the phosphorus release and uptake characteristics of the sludge under 100% RAS pre-concentration ratio and the optimum pre-concentration ratio operational conditions.
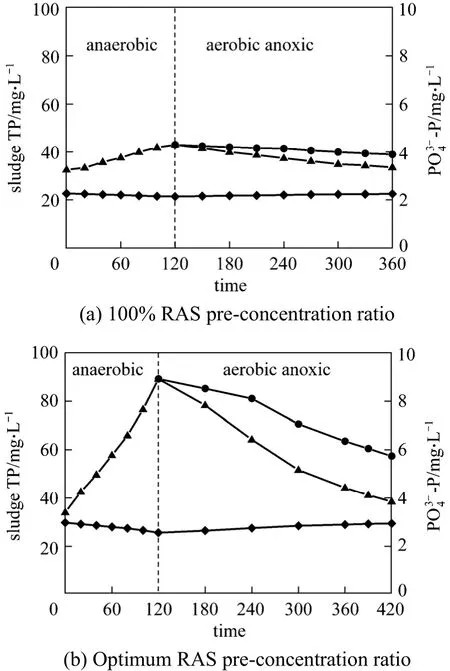
Figure 7 Phosphorus release and uptake under anaerobic-aerobic and anaerobic-anoxic conditions▲ P O34--P (aerobic); ● P O34--P (anoxic); ◆ sludge TP
As shown in Fig. 7, the phosphorus release and uptake phenomena of the sludge under the optimum RAS pre-concentration ratio operational condition was far more conspicuous than that of the other one. Compared to 0.61, 0.21 and 0.12 mg·g-1·h-1under 100%RAS pre-concentration ratio operational condition, the anaerobic phosphorus release rate, anoxic and aerobic phosphorus uptake rates of the sludge under optimum RAS pre-concentration ratio operational condition were 2.07, 0.76 and 0.48 mg·g-1·h-1, respectively, indicating that more PAOs accumulated in the system sludge [22]. Furthermore, the TP of system sludge increased from 22.6 mg·g-1(based on VSS) under 100%RAS pre-concentration ratio operational condition to 29.7 mg·g-1under the optimum RAS pre-concentration ratio operational condition, which also indicated that much more PAOs accumulated in the system sludge[23, 24]. The relative proportion of denitrifying dephosphation activity in the PAOs increased from 0.57 under the former operational condition to 0.63 under the latter operational condition, indicating an increase of DPAOs in the novel OD system. These results are comparable to the investigations carried out in the UCT wastewater treatment system [25].
The possible reason for the changes in the sludge is that under the optimum RAS pre-concentration ratio operational condition, nitrate is completely removed in the pre-anoxic zone with endogenous substrate and secondary phosphorus release is strictly controlled so that anaerobic phosphorus release and carbon source uptake, which are extremely important for the accumulation of PAOs, are fully satisfied. Moreover, under the optimum RAS pre-concentration ratio operational condition, the time for denitrifying phosphorus removal in the pre-anoxic zone is appropriate so that DPAOs can metabolize naturally and grow fully.
4 CONCLUSIONS
The RAS pre-concentration was beneficial for phosphorus removal in the novel OD process. The competition for carbon source from denitrifiers in the anaerobic zone was avoided by RAS pre-concentration so that the anaerobic phosphorus release, carbon source uptake and the aerobic phosphorus uptake by PAOs were improved. ORP was proved to be feasible for RAS pre-concentration control in order to eliminate remaining nitrate and restrain secondary phosphorous release in the pre-anoxic zone. It was also found that much more PAOs accumulated in the system after adopting of RAS pre-concentration.
1 Kuba, T., Wachtmeister, A., Van Loosdrecht, M.C.M., Keijnen, J.J.,“Effect of nitrate on phosphorus release in biological phosphorus removal systems”, Water Sci. Technol., 30 (6), 263-269 (1994).
2 Boswell, C.D., Dick, R.E., Macaskie, L.E., “The effect of heavy metals and other environmental conditions on the anaerobic phosphate metabolism of Acinetobacter johnsonii”, Microbiology, 145,1711-1720 (1999).
3 Mulkerrins, D., Dobson, A.D.W., Colleran, E., “Parameters affecting biological phosphate removal from wastewaters”, Environ. International., 30 (2), 249-259 (2004).
4 Oehmen, A., Lemos, P.C., Carvalho, G., Yuan, Z.G., Keller, J.,Blackall, L.L., Reis, M.A.M., “Advances in enhanced biological phosphorus removal: From micro to macro scale”, Water Res., 41(11), 2271-2300 (2007).
5 Chuang, S.H., Ouyang, C.F., Wang, Y.B., “Kinetic competition between phosphorus release and denitrification on sludge under anoxic condition”, Water Res., 30 (12), 2961-2968 (1996).
6 Peng, Y.Z., Hou, H.X., Wang, S.Y., Cui, Y.W., Yuan, Z.G., “Nitrogen and phosphorus removal in pilot scale anaerobic anoxic OD system”,J. Environ. Sci. China, 20 (4), 398-403 (2008).
7 Zou, H., Du, G.C., Ruan, W.Q., Chen, J. “Role of nitrate in biological phosphorus removal in a sequencing batch reactor”, World J.Microbiol. Biotechnol., 22 (7), 701-706 (2006).
8 Kazmi, A.A., Fujita, M., Furumai, H., “Modeling effect of remaining nitrate on phosphorus removal in SBR”, Water Sci. Technol., 43 (3),175-182 (2001).
9 Chang, C.H., Hao, O.J., “Sequencing batch reactor system for nutrient removal: ORP and pH profiles”, J. Chem. Techno. Biotechnol.,67 (1), 27-38 (1996).
10 Hayakawa, N., Tsuji, J., Hamamoto, Y., “Simultaneous nitrogen and phosphate removal by the intermittent cyclic process”, Water Sci.Technol., 18 (7/8), 319-326 (1986).
11 Comeau, R., Hall, K.J., Hanock, R.E.W., Oldham, W.K., “Biochemical models for enhanced biological phosphorus removal”, Water Res., 20 (12), 1511-1521 (1986).
12 Chen, X., Fujiwara, T., Ohtoshi, K., Inamori, S., Nakamachi, K.,Tsuno, H., “Evaluation of a novel oxidation ditch system for biological nitrogen and phosphorus removal from domestic sewage”,Water Sci. Technol., 62 (8), 1745-1754 (2010).
13 APHA, AWWA, Standard Methods for the Examination of Water and Wastewater, 19th ed., American Public Health Association/American Water Works Association/Water Environment Federation, Washington DC (1995).
14 Randall, C.W., Barnard, J.L., Stensel, H.D., Design and Retrofit of Wastewater Treatment Plants for Biological Nutrient Removal, Technomic Publishing Co. Inc., Lanscaster, 25-78 (1992).
15 Kuba, T., Van Loosdrecht, M.C.M., Heijnen, J.J., “Phosphorus and nitrogen removal with minimal COD requirement by integration of denitrifying dephosphatation and nitrification in a two-sludge system”, Water Res., 30 (7), 1702-1710 (1996).
16 Peng, Y.Z., Ma, Y., Wang, S.Y., “Denitrification potential enhancement by addition of external carbon sources in a pre-denitrification process”, J. Environ. Sci. China, 19 (3), 284-289 (2007).
17 Peng, Z.X., Peng, Y.Z., Gui, L.J., Liu, X.L., “Competition for single carbon source between denitrification and phosphorus release in sludge under anoxic condition”, Chin. J. Chem. Eng., 18 (3), 472-477(2010).
18 Mikola, A., Rautiainen, J., Vahala, R.. “Secondary clarifier conditions conducting to secondary phosphorus release in a BNR plant”,Water Sci. Technol., 60 (9), 2413-2418 (2009).
19 Rensink, J.H., van der Ven, J., van Pamelen, G., Fedder, F., Majoor,E., “The modified Renphosystem: A high biological nutrient removal system”, Water Sci. Technol., 35 (10), 137-146 (1997).
20 Meinhold, J., Arnold, E., Issacs, S., “Effect of nitrite on anoxic phosphate uptake in biological phosphorus removal activated sludge”, Water Res., 33 (8), 1871-1883 (1999).
21 Coats, E.R., Mockos, A., Loge, F.J., “Post-anoxic denitrification driven by PHA and glycogen within enhanced biological phosphorus removal”, Bioresour. Technol., 102 (2), 1019-1027 (2010).
22 Chen, Y.G., Chen, Y.S., Xu, Q., Zhou, Q., Gu, G.W., “Comparison between acclimated and unacclimated biomass affecting anaerobic-aerobic transformations in the biological removal of phosphorus”,Process Biochem., 40 (2), 723-732 (2005).
23 Liu, W., Mino, T., Matsuo, T., Nakamura, K., “Biological phosphorus removal processes-effect of pH on anaerobic substrate metabolism”, Water Sci. Technol., 34 (1/2), 25-32 (1996).
24 Hesselmann, R.P.X., Von Rummell, R., Resnick, S.M., Hany, R.,Zehnder, A.J.B., “Anaerobic metabolism of bacteria performing enhanced biological phosphate removal”, Water Res., 34 (14),3487-3494 (2000).
25 Kuba, T., Van Loosdrecht, M.C.M.. “Occurrence of denitrifying phosphorus removal bacteria in modified UCT-type waste water treatment plants”, Water Res., 31 (4), 777-786 (1997).
猜你喜欢
杂志排行

Chinese Journal of Chemical Engineering的其它文章
- Phenol Oxidation by Combined Cavitation Water Jet and Hydrogen Peroxide*
- Venting Design for Di-tert-butyl Peroxide Runaway Reaction Based on Accelerating Rate Calorimeter Test
- Separation of α-Tocopherol with a Two-Feed Simulated Moving Bed*
- Experimental and CFD Studies on the Performance of Microfiltration Enhanced by a Turbulence Promoter*
- Pervaporation of Aqueous Solution of Acetaldehyde Through ZSM-5 Filled PDMS Composite Membrane*
- Effects of CO2 Dilution on Methane Ignition in Moderate or Intense Low-oxygen Dilution (MILD) Combustion: A Numerical Study*