Oncofetal antigen glypican-3 as a promising early diagnostic marker for hepatocellular carcinoma
2011-06-11
Nantong,China
Introduction
Hepatocellular carcinoma (HCC) is a major cause of morbidity and mortality; it is the seventh most common cancer worldwide,and the third leading cause of cancer-related deaths.[1,2]Its prognosis is poor and early detection is of utmost importance.[3-5]Glypican-3 (GPC-3) is a membrane-anchored heparin sulfate proteoglycan normally expressed in fetal liver and placenta,but not in normal adult liver.[6,7]The GPC-3 gene is located on human chromosome X26.10 and consists of 8 exons.Its promoter region has multiple transcription factor binding sites,and it has a transcript length of 2130bp,encoding 580 amino acids.[8]As an oncofetal antigen,GPC-3 is a useful molecular marker for HCC diagnosis,especially in poorly-differentiated or small HCC.[9]However,the expression features and the dynamic changes of GPC-3 and GPC-3 mRNA at early stages of HCC formation are not yet clear.In the present study,a hepatoma model was made with 2- fluorenylacetamide (2-FAA),and the dynamic changes of GPC-3 and GPC-3 mRNA were investigated in rat hepatocarcinogenesis in order to explore its early diagnostic value for HCC.
Methods
Preparation of hepatoma model
Hepatoma models were made according to the previously reported method.[10]In brief,48 male Sprague-Dawley rats provided by the Experimental Animal Center of Nantong University (Nantong,China),weighing 120-160 g,were randomly divided into 8 groups (8×6 rats),two of which served as control groups.The control rats were fed with standard grains while the others were also given 2-FAA (0.05%,Sigma,USA).One group of the experimental rats and 2 control rats were sacrificed every 2 weeks.Part of the liver tissue was used for pathological examination and preparation of homogenate,and the rest was stored at -85 ℃ until required.All procedures were conducted in accordance with the Guidelines for Experimental Animals approved by the Animal Care and Use Committee of Nantong University,China.
Liver total RNA isolation
Rat liver tissue (50 mg) was homogenized in an RNase-free homogenizer with 1.0 mL trizol reagent(MRC,USA),mixed with chloroform and run at high speed.An equal volume of isopropanol was added to the supernatant.After mixing,RNA was pelleted by centrifugation,washed with cold 70% ethanol,resuspended in RNase-free water and incubated in a 60 ℃ water bath for 10 minutes.The concentration of total RNA and A260/280ratio were measured with a SmartSpecTMPlus Spectrophotometer (Bio-Rad,USA).
Synthesis of GPC-3 cDNA
For synthesis of cDNA,2 μg of total RNA was denatured in the presence of random hexamers (100 pmol/L,Promega,USA) at 95 ℃ for 5 minutes and reversetranscriptase (Gibco BRL,USA) at 23 ℃ for 10 minutes,42 ℃ for 60 minutes,95°C for 10 minutes,on ice for 5 minutes,and then stored at -20 ℃ for PCR amplification.
Primer design and gene amplification
Primers were designed according to the GPC-3 GenBank sequence (NM_012774) fragment (nt974-1675)and synthesized by Sangon Bioscience and Technology Co.,Ltd.,Shanghai,China.The outside primers were:GPC-3-1:5'-GTG TGG TAG AGA TCG ACA AG-3'(nt974-993) and GPC-3-2:5'-AGC GCA GTT GGT TCT TCA CT-3' (nt1656-1675) and the amplified product was 702bp.The inside primers were:GPC-3-3:5'-TAT GTG CAG AAG AAC GGA GG-3' (nt1108-1127) and GPC-3-4:5'-CTC AGG GCC CTT CAT TTT CA-3'(nt1460-1479),and the amplified fragment was 372bp.The internal control primers were GAPDH-P1:5'-GGC TGC CAT TTG CAC TGG CAA-3' and 5'-TGC CDT GAG TGG AGT CAT ACT G-3',and the amplified size was 595bp.The first PCR was done using cDNA as template with the outside primers.The PCR cycles were:hot start at 94 ℃ for 5 minutes; 94 ℃,10 seconds; 50 ℃,30 seconds; 72 ℃,1 minute,for 38 cycles,and extended at 70 ℃ for 10 minutes and stored at 4 ℃.The second step PCR was done using the first step PCR product as template with inside primers and the same PCR protocol as the first step.The amplified products were separated by electrophoresis on 1.5% agarose gels,stained with ethidium bromide,and detected under 302 nm UV light.
DNA sequencing
The GPC-3 gene fragment was purified with Montage PCR centrifugalfilter devices (Millipore,USA) according to the protocol instructions.One microgram of DNA was used for preparation of sequencing reaction and directly sequenced using a MegaBACE DNA sequencer with the DYEnamic ET Dye Terminator Cycle Sequencing Kit(Amersham Biosciences,USA),following their protocol.The sequences were edited using the MegaBACE Version 3.0 program (Amersham Biosciences,USA) and aligned with the original sequence of the GPC-3 gene.
Western blotting
Protein (100 μg) was purified from rat liver tissue lysed in RIPA lysis buffer containing PMSF,separated on 10% SDS-acrylamide gel,and electrotransferred to PVDF membrane.After blocking with 5% nonfat dry milk in TBST buffer [10 mmol/L Tris-HCl (pH 8.0),150 mmol/L NaCl,0.05% Tween 20],the membrane was probed with anti-GPC-3 (1∶250; Abcam,UK),followed by incubation with HRP-conjugated anti-rabbit immunoglobulin G secondary antibodies (1∶1000,Beyotime Institute of Biotechnology,China),and then visualized with enhanced chemiluminescence reagent.The band images detected by the ChemiDoc XRS+ system (Bio-Rad,USA) were densitometrically analyzed using Quantity One (Ver.4.62)software.
Immunohistochemistry
An UltraSensitiveTMS-P (streptavidin-peroxidase) kit and monoclonal antibody of anti-GPC-3 (Abcam,UK)were from USCN Life Science,China.Liver specimens werefixed in 10% neutral formalin,embedded in paraffin,sectioned at 4 μm,deparaffinized in xylene,and dehydrated in a gradient of ethanol solutions.Finally,they were restained with hematoxylin and examined.The negative control used phosphate-buffered solution (0.01 mol/L) instead of primary and secondary antibodies,and S-P reagent.Liver GPC-3 expression was semiquantitatively evaluated on the basis of positive cell percentage,and classified as follows:diffuse positive staining (+++) of more than 50% of total cells;moderate staining (++),16%-50%; weak staining (+),5%-15%; and negative staining (-),<5%.The analysis of GGT protein in hepatocarcinogenesis was performed according to the previously published method.[10]
Quantitative serum GPC-3 by ELISA
The levels of serum GPC-3 were detected using a rat GPC-3 ELISA kit (R&D Subpackaged,USA) according to the manufacturer's instructions.Fifty microliters of diluted serum samples (1∶1000 in sample dilution solution) or standard solution were separately put into each well of a 96-well ELISA plate,incubated for 30 minutes at 37 ℃,and then 50 μl HRP-conjugate was added to the wells,and incubated for 2 minutes at 37 ℃.Substrate A (50 μl) and substrate B (50 μl) were added to each well for 15 minutes at 37 ℃.Then 50 μl of stop solution was added to each well and absorbance was read at 450 nm.During the procedure,the plate was washed according to the routine ELISA method.
Statistical analysis
Data were expressed as mean±SD.Statistical analyses were done using the SPSS 13.0 software package.Differences between groups were assessed using the Rank-Sum test or Student's t test.P≤0.05 was regarded statistically significant.
Results
Histological changes and HCC formation in the liver
The pathological changes in the livers of 2-FAA-treated rats were the same as in previous reports.Comparison of the morphological changes and hepatic GGT expression are shown in Fig.1.Based on pathological examination of the liver,the rats were divided into control (n=12),degenerating (n=18),precancerous (n=9),and HCC(n=9) groups (Fig.1 A1-A3).Corresponding liver GGT staining showed no positive expression in the control group (n=12),slight positive expression at the stage of hepatocyte degeneration (n=18),medium intensity at the precancerous stage (n=9),and overexpression at the stage of HCC formation (n=9) (Fig.1 B1-B3).
Hepatic GPC-3 level and HCC development
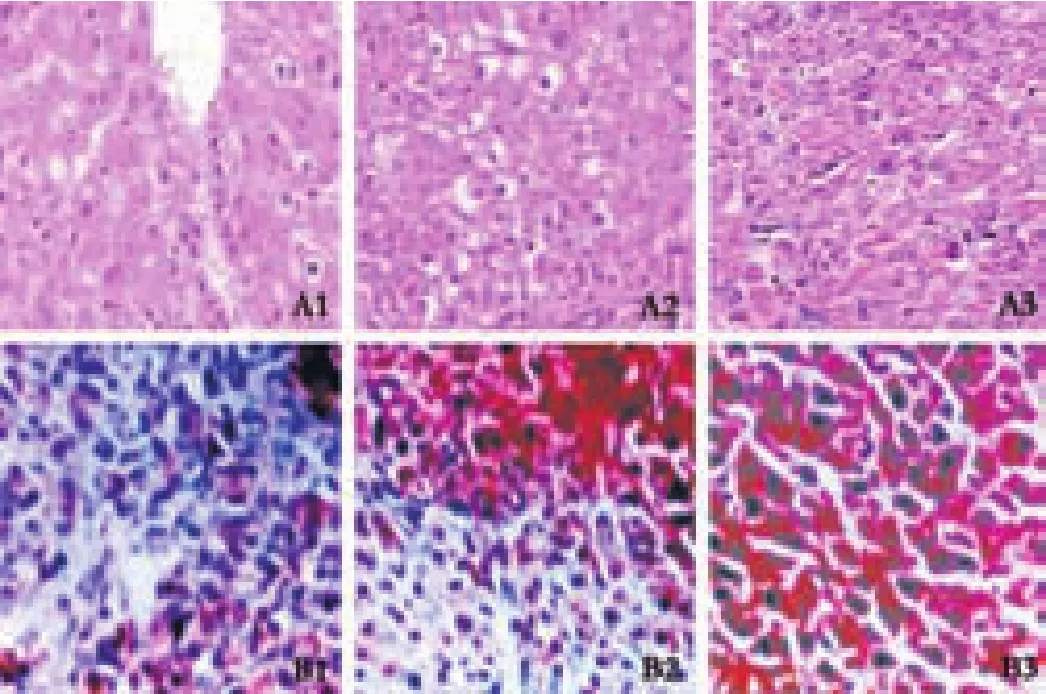
Fig.1.Morphological changes of hepatocytes and corresponding hepatic GGT expression in hepatocarcinogenesis.A1:section from the degenerating group; A2:the precancerous group; and A3:the HCC group (A1-A3,HE staining,original magnification ×100).Corresponding immunohistochemical staining for GGT:slight positive staining at the stage of hepatocyte degeneration (B1),medium intensity at the precancerous stage (B2),and overexpression at the HCC stage (B3) (B1-B3,original magnification ×200).

Fig.2.Immunohistochemical staining with anti-GPC-3 and positive GPC-3 in hepatocarcinogenesis.GPC-3 expression in cytoplasm and membrane of hepatocytes assessed by immunohistochemistry(original magnification ×100).A:Sections from the degenerating group; B:the precancerous group; and C:the HCC group; D:the incidence of GPC-3 expression at the different stages of HCC formation.
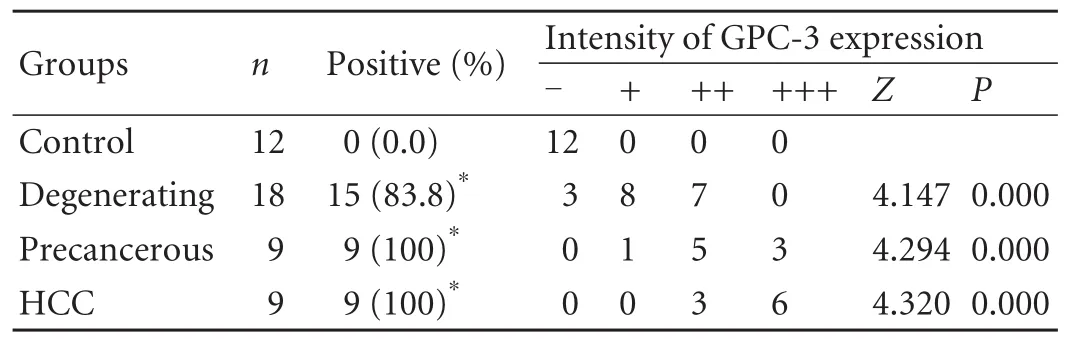
Table 1.Comparative analysis of liver GPC-3 expression intensity at different stages of hepatocyte malignant transformation
The hepatic GPC-3 staining and its positive index in hepatocarcinogenesis are shown in Fig.2.The positive liver GPC-3 protein showed brown staining,mainly distributed in cytosol and membrane,and the closer to the tumor,the stronger the GPC-3 expression.The incidence of liver GPC-3 expression and its intensity during malignant transformation are shown in Table 1.With hepatocyte carcinogenesis,the incidence of GPC-3 expression was increased (Fig.2A-C),with no positivity (0/12) in the control group,83.3% (15/18) in the degenerating group,100% (9/9) in the precancerous group,and 100% (9/9)in the HCC group (Fig.2D).The intensity of liver GPC-3 expression was significantly higher in the degenerating,precancerous and HCC groups than that in the control group.
Circulating GPC-3 level in hepatocarcinogenesis
The level of circulating GPC-3 expression at different stages of malignant transformation is shown in Table 2.The incidence of serum GPC-3 expression was zero in the control group,38.9% (7/18) in the degenerating group,66.7% (6/9) in the precancerous group,and 77.8% (8/9) in the HCC group.The level of circulating GPC-3 expression was higher in the degenerating(P<0.05),precancerous (P=0.001) and HCC (P<0.001)groups than that in the control group.
Quantitative analysis of liver GPC-3 protein
The dynamic changes in rat liver GPC-3 confirmed by Western blotting analysis are shown in Fig.3.Withthe changing morphology and the increasing liver GPC-3,significant differences were found between the intensity of GPC-3 expression and different stages of malignant transformation.The ratio of liver GPC-3 to β-actin expression and the dynamic changes of total RNA specific concentration (μg/mg wet liver) were measured in hepatocarcinogenesis (Table 3).The relative ratio of liver GPC-3 or total RNA expression was higher (P<0.001) in the degenerating,precancerous and HCC groups than that in the control group.There was a positive relationship between GPC-3 and total RNA expression.

Table 2.Quantitative analysis and dynamic changes in circulating GPC-3 expression in hepatocarcinogenesis
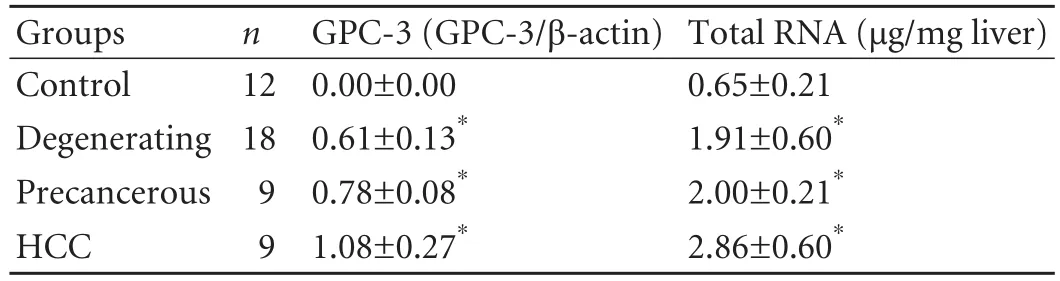
Table 3.Relative quantitative analysis of GPC-3 expression and dynamic changes of total RNA-specific concentration in hepatocarcinogenesis
GPC-3 mRNA expression in hepatocarcinogenesis

Fig.4.Amplification of GPC-3 mRNA fragment in hepatocarcinogenesis.The fragment (372bp) of GPC-3 mRNA was amplified by RT-PCR,separated on 1.5% agarose gel,and stained with ethidium bromide; GAPDH:rat glyceraldehyde-3-phosphate dehydrogenase as control gene (595bp); M:DNA molecular marker.
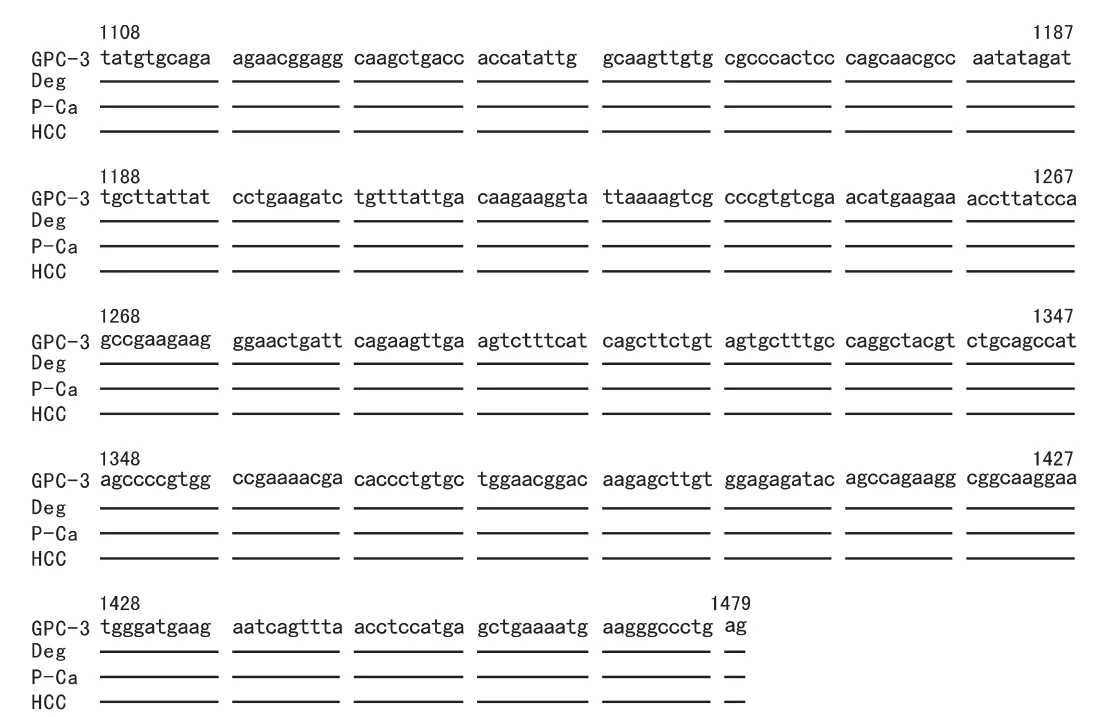
Fig.5.Alignment of nucleotide sequences of amplified GPC-3 gene fragments.GPC-3:original sequence (nt1108-1479,372bp) of rat GPC-3 from GenBank (NM_012774); Deg:degenerating liver;P-Ca:precancerous liver.
Amplification analysis of the GPC-3 mRNA fragment and its incidence in rat hepatocarcinogenesis are shown in Fig.4.The size of the GPC-3 amplified fragment was 372bp,as predicted and confirmed by sequencing.It was visible in the degenerating,precancerous and HCC groups but not the control group (Fig.5).The incidence of amplified GPC-3 mRNA dynamically increased as hepatocytes changed from normal to granule-like degeneration to precancerous and cancerous lesions.The induction of GPC-3 mRNA expression was detected in all liver tissues from the cancerous group and from precancerous lesions,and parts of the degenerating group,i.e.,0% in the control group,83.3% in the degenerating group,100% in the precancerous group,and 100% in the HCC group.It was significantly higher in the cancerous,precancerous and degenerating groups than in the control group.There was a positive correlation between hepatic GPC-3 mRNA and total RNA level (r=0.475,P<0.05),liver GPC-3 (r=1.0,P<0.001) and serum GPC-3 (r=0.994,P<0.001).
Discussion
GPC3 is a member of the glypican family of glycosylphosphatidylinositol-anchored cell-surface heparan sulfate proteoglycans.[11,12]Normally,GPC-3 plays a role in regulating cell proliferation and survival during embryonic development by modulating the activity of various growth factors.Under normal physiological conditions,the tissue GPC-3 protein resides in the endoplasmic reticulum and is transported into the nucleus under stress.[13]The dynamic expression and changes of GPC-3 in the development of HCC remain unclear.In this study,rat hepatoma models were successfully made and confirmed by pathological examination.The characteristics of dynamic changes in the liver were vacuole-like denaturation at early stages,dysplastic nodules appeared at intermediate stages,andfinally progressed to tubercles of cancerous nests (Fig.1).The changes in liver histology were consistent with hepatic GGT expression,which is a sensitive enzyme marker that contains the hepatoma-specific GGT subtype,suggesting that the use of a hepatoma model is an effective method to assess the dynamic changes of GPC-3 in hepatocarcinogenesis.
Most HCC patients have chronic HBV infection.The malignant transformation of hepatocytes may be induced by the disruption of liver function and the methylation of carcinogenesis-related genes.It is a long course from HBV-associated liver disease to HCC.[2,3]In the rat hepatoma models,the brown staining of GPC-3 was mainly distributed in the cytosol (Fig.2).The closer to the tumor,the darker was the brown staining,which might indicate its function as a molecular chaperon.Also,GPC-3 staining might have occurred in the endoplasmic reticulum and Golgi around the nuclei.There was an increasing tendency of liver GPC-3 and the circulating protein from control to degeneration to precancerous to cancerous tissue in the liver (Table 1) and circulating blood (Table 2),and the circulating GPC-3 was lower than that in the liver at the same stage.The intensity of GPC-3 and the ratio of GPC-3 to β-actin (Fig.3)increased significantly in parallel with the expression of specific liver RNA concentration (Table 3),indicating that GPC-3 might be involved in hepatocarcinogenesis.Although the mechanism is not yet clear,its overexpression could be a promising molecular marker for early diagnosis of HCC.
The activation of oncogenes and inactivation of tumor suppressor genes by carcinogens alter the regulation of gene expression.[14,15]It was reported that GPC-3 mRNA levels were increased in a large proportion of HCCs,but no over-expression was detected in focal nodular hyperplasia and cirrhotic liver.Based on these results,it was proposed that GPC-3 could be a useful marker to differentiate between benign and malignant liver diseases.[16]Recently,it has been suggested that GPC-3 can induce oncogenesis through activation of the insulin-like growth factor-II signaling pathway.[17,18]GPC-3 and GPC-3 mRNA are not detectable in normal tissues,except the placenta and fetal liver,and they are expressed in the majority of HCCs.[19,20]In the present study,the incidence of amplified GPC-3 mRNA dynamically increased as hepatocytes changed from normal to granule-like degeneration to precancerous and cancerous lesions.The induction of GPC-3 mRNA expression was detected in all the liver tissues of the cancerous group and precancerous lesions,and in parts of the degenerating group but not the control groups,indicating that the up-regulation of GPC-3 mRNA expression may be a sensitive and specific biomarker of HCC and can distinguish it from other benign and malignant hepatic lesions.
The dynamic expression and changes of GPC-3 along with its gene during HCC formation were consistent with changes in liver histology and GGT,suggesting that the over-expression of GPC-3 is an early molecular event in the malignant transformation of hepatocytes.The analysis of GPC-3 expression level and GPC-3 mRNA status in HCC formation may be helpful in the early detection of HCC.Further studies will permit us to analyze the mechanisms of human hepatocarcinogenesis and to learn how to target GPC-3 sites or use RNA interference-mediated suppression of GPC-3 expression for HCC therapy.[21,22]
Funding:The study was supported by grants-in-aid from the Projects of Medical Science (H200925) and the Natural Science Foundation of Jiangsu Province,China (BK2008187).
Ethical approval:Not needed.
Contributors:YM,YDF and BYZ proposed and wrote the first draft.BYZ and ZCG analyzed the data.All authors contributed to the design and interpretation of the study and further drafts.YDF is the guarantor.
Competing interest:No benefits in any form have been received or will be received from a commercial party related directly or indirectly to the subject of this article.
1 Yang JD,Roberts LR.Hepatocellular carcinoma:A global view.Nat Rev Gastroenterol Hepatol 2010;7:448-458.
2 Aravalli RN,Steer CJ,Cressman EN.Molecular mechanisms of hepatocellular carcinoma.Hepatology 2008;48:2047-2063.
3 Block TM,Marrero J,Gish RG,Sherman M,London WT,Srivastava S,et al.The degree of readiness of selected biomarkers for the early detection of hepatocellular carcinoma:notes from a recent workshop.Cancer Biomark 2008;4:19-33.
4 Yao DF,Dong ZZ,Yao M.Specific molecular markers in hepatocellular carcinoma.Hepatobiliary Pancreat Dis Int 2007;6:241-247.
5 Yao DF,Jiang DR,Huang ZW,Lu JX,Tao QY,Yu ZJ,et al.Abnormal expression of hepatoma specific gamma-glutamyl transferase and alteration of gamma-glutamyl transferase gene methylation status in patients with hepatocellular carcinoma.Cancer 2000;88:761-769.
6 Stigliano I,Puricelli L,Filmus J,Sogayar MC,Bal de Kier Joffé E,Peters MG.Glypican-3 regulates migration,adhesion and actin cytoskeleton organization in mammary tumor cells through Wnt signaling modulation.Breast Cancer Res Treat 2009;114:251-262.
7 Wang HL,Anatelli F,Zhai QJ,Adley B,Chuang ST,Yang XJ.et al.Glypican-3 as a useful diagnostic marker that distinguishes hepatocellular carcinoma from benignhepatocellular mass lesions.Arch Pathol Lab Med 2008;132:1723-1728.
8 Filmus J,Capurro M.The role of glypican-3 in the regulation of body size and cancer.Cell Cycle 2008;7:2787-2790.
9 Libbrecht L,Severi T,Cassiman D,Vander Borght S,Pirenne J,Nevens F,et al.Glypican-3 expression distinguishes small hepatocellular carcinomas from cirrhosis,dysplastic nodules,and focal nodular hyperplasia-like nodules.Am J Surg Pathol 2006;30:1405-1411.
10 Yao D,Jiang D,Wu X.Experimental study on value of carcino-embryonic gama-glutamyl transferase isoenzymes for monitoring carcinogenesis of hepatocytes.Zhonghua Gan Zang Bing Za Zhi 2000;8:30-32.
11 Jia HL,Ye QH,Qin LX,Budhu A,Forgues M,Chen Y,et al.Gene expression profiling reveals potential biomarkers of human hepatocellular carcinoma.Clin Cancer Res 2007;13:1133-1139.
12 Saffroy R,Pham P,Reffas M,Takka M,Lemoine A,Debuire B.New perspectives and strategy research biomarkers for hepatocellular carcinoma.Clin Chem Lab Med 2007;45:1169-1179.
13 Pang RW,Joh JW,Johnson PJ,Monden M,Pawlik TM,Poon RT.Biology of hepatocellular carcinoma.Ann Surg Oncol 2008;15:962-971.
14 Morford LA,Davis C,Jin L,Dobierzewska A,Peterson ML,Spear BT.The oncofetal gene glypican 3 is regulated in the postnatal liver by zincfingers and homeoboxes 2 and in the regenerating liver by alpha-fetoprotein regulator 2.Hepatology 2007;46:1541-1547.
15 Capurro MI,Xiang YY,Lobe C,Filmus J.Glypican-3 promotes the growth of hepatocellular carcinoma by stimulating canonical Wnt signaling.Cancer Res 2005;65:6245-6254.
16 Yamauchi N,Watanabe A,Hishinuma M,Ohashi K,Midorikawa Y,Morishita Y,et al.The glypican 3 oncofetal protein is a promising diagnostic marker for hepatocellular carcinoma.Mod Pathol 2005;18:1591-1598.
17 Zhu ZW,Friess H,Wang L,Abou-Shady M,Zimmermann A,Lander AD,et al.Enhanced glypican-3 expression differentiates the majority of hepatocellular carcinomas from benign hepatic disorders.Gut 2001;48:558-564.
18 Cheng W,Tseng CJ,Lin TT,Cheng I,Pan HW,Hsu HC,et al.Glypican-3-mediated oncogenesis involves the Insulin-like growth factor-signaling pathway.Carcinogenesis 2008;29:1319-1326.
19 Nakano K,Orita T,Nezu J,Yoshino T,Ohizumi I,Sugimoto M,et al.Anti-glypican 3 antibodies cause ADCC against human hepatocellular carcinoma cells.Biochem Biophys Res Commun 2009;378:279-284.
20 Kwack MH,Choi BY,Sung YK.Cellular changes resulting from forced expression of glypican-3 in hepatocellular carcinoma cells.Mol Cells 2006;21:224-228.
21 Llovet JM,Bruix J.Molecular targeted therapies in hepatocellular carcinoma.Hepatology 2008;48:1312-1327.
22 Thorgeirsson SS,Grisham JW.Molecular pathogenesis of human hepatocellular carcinoma.Nat Genet 2002;31:339-346.
杂志排行

Hepatobiliary & Pancreatic Diseases International的其它文章
- Borderline resectable pancreatic tumors: Is there a need for further re fi nement of this stage?
- Dose requirement and complications of diluted and undiluted propofol for deep sedation in endoscopic retrograde cholangiopancreatography
- Clinical features and treatment of sump syndrome following hepaticojejunostomy
- Current surgical management of pancreatic endocrine tumor liver metastases
- Liver transplantation for hepatocellular carcinoma:an update
- Cytokine and apoptosis gene polymorphisms influence the outcome of hepatitis C virus infection