Auditory-model-based Feature Extraction Method for Mechanical Faults Diagnosis
2010-03-01LIYungongZHANGJinpingDAILiZHANGZhanyiandLIUJie
LI Yungong, ZHANG Jinping *, DAI Li, ZHANG Zhanyi, and LIU Jie
1 School of Mechanical Engineering and Automation, Northeastern University, Shenyang 110004, China
2 School of Mechanical Engineering, Shenyang University of Chemical Technology, Shenyang 110142, China
1 Introduction
Feature extraction is one of the critical components of mechanical faults diagnosis, which is developed through vibration signal analysis and processing. From the viewpoint of identification of conditions and faults, a good feature extraction method should be capable to distinguish different conditions and faults effectively, and to be helpful to simplify the work of pattern recognition. There are many feature extraction methods, such as frequency spectrum analysis, time-frequency spectrum analysis, wavelet transform, and empirical mode decomposition, etc.Generally, these methods are based on some sense of mathematics or physics and have their specific objectives for signal decomposition. Intuitively, it would be beneficial to explore this topic from a whole new angle, with expectation of comparatively better performance for feature extraction of vibration signals.
The human auditory system possesses remarkable capabilities to analyze, process and recognize signals,which is far from the reach of current available signal analysis methods. Then its mechanism is worthy of being studied and simulated. As early as the 1960’s the studies on the mathematical auditory system modeling had been carried out, and gradually auditory modeling became a popular research issue since the 1980’s. In the past decades,some auditory models have been proposed and applied,such as early auditory(EA)[1], zero-crossings with peak amplitudes(ZCPA)[2], auditory image model(AIM)[3],binaural model[4], computational auditory scene analysis(CASA)[5], etc. Prior studies have shown that in speech recognition the auditory model performs better than conventional FFT-based methods, especially for noisy signals[1,6–8]. This is encouraging, but current applications of auditory model have been confined to the fields of speech and sonar signals analysis.
In this paper, for the first time the auditory model is introduced into the vibration signal analysis. EA model proposed by YANG, et al[1], is adopted here, which is robust under noisy environments and has excellent performance in audio classification[6–8]. In the following parts of this paper,section 2 and section 3 briefly introduce the human auditory system and EA model respectively. The selecting method of the parameter of inner hair cells model for mechanical vibration signal is proposed in section 4. The test results are shown in the section 5, which indicates that EA model can effectively distinguish different rotor faults and has satisfactory stability of feature extraction and capability to suppress noise.
2 Human Auditory System
The human auditory system includes auditory periphery and auditory center[1,7]. Auditory periphery consists of external ear, middle ear and cochlea. The function of cochlea is to transform the vibrations of auditory ossicles to the neural coding signals. Then the neural coding signals are transmitted via afferent nerves to the auditory center where the hearing is formatted.
In the above process, cochlea plays an important role in the sound signals analysis, which is composed of oval window, basilar membrane, organ of corti, and acoustic auditory nerve. In cochlea, the oval window receives the vibration from auditory ossicles and transmits the vibration to the basilar membrane to produce mechanical displacement vibration on the basilar membrane. The width of basilar membrane is 0.1 mm at the basal end and increase to 0.5 mm at the apical end. The stiffness of basilar membrane changes with the changes of width. As a result,signals with different frequency will produce resonance peaks at different positions. Therefore, basilar membrane can separate sound signal into frequency components.Stimulated by the vibrations of basilar membrane the inner hair cells in the organ of corti can generate electrical potentials corresponding to the vibratory velocity of basilar membrane. These electrical potentials are conveyed to the auditory nerve fibers. Between auditory nerve fibers and auditory center, there are three layers of fibers generally named as afferent nerves. In neural networks, i.e. the combinations of afferent nerves, the signals will be inhibited and compressed and then the features will be extracted. The outer hair cells in organ of corti can adjust the characteristics of strain of basilar membrane and the electrochemistry of inner hair cells to induce the nonlinearity of basilar membrane. That is why the human auditory system possesses powerful signal processing abilities, like frequency selecting and dynamic compressing.The basic principle of human auditory system is illustrated in the following Fig. 1.
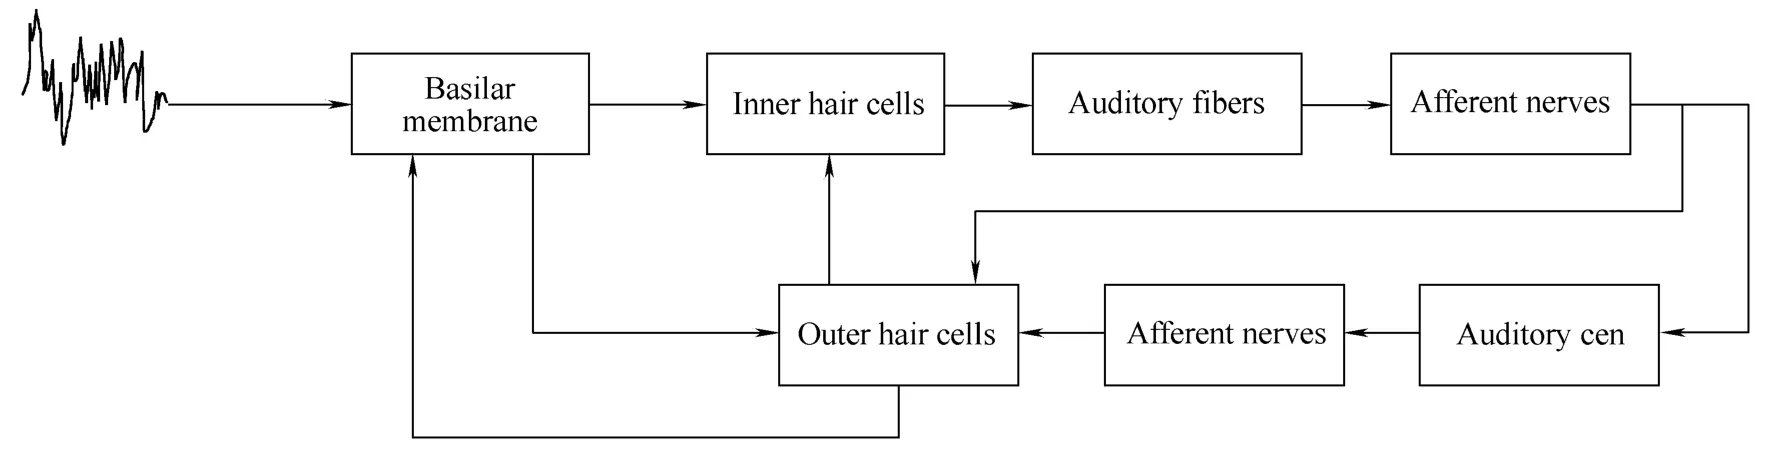
Fig. 1. Schematic description of human auditory system
3 EA Model
With EA model[1,7](shown in Fig. 2), human auditory system is composed of three functional parts in series,which include bandpass filtering with basilar membrane,transduction with inner hair cells, and feature extraction with auditory neural network. Therefore, EA model consists of three sub-models, i.e., basilar membrane model,inner hair cells model and auditory neural network model.In generally, the model of auditory neural network is called lateral inhibitory network(LIN). At the same time, EA model ignores the outer hair cells and afferent nerves.
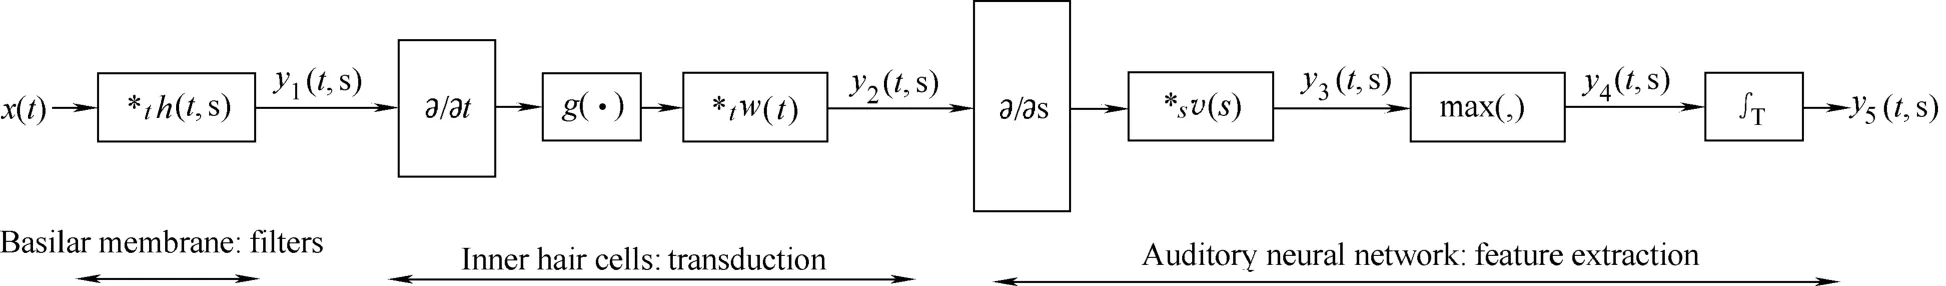
Fig. 2. Schematic description of EA model
3.1 Basilar membrane model
In EA model, the basilar membrane is modeled as a bandpass filterbank to simulate its characteristic of frequency decomposition. Let x(t) be the signal and h(t, s)be the filterbank, where t is the time index and s denotes a specific location on the basilar membrane, then the output of basilar membrane model is given by
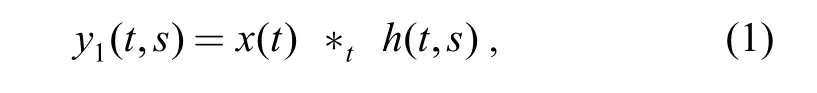
where y1(t ,s) is the response,*tdenotes the convolution in time domain.
In this paper, bandpass filtering is performed by Gammatone filterbank[9–10]. The resonance frequency at the location s of basilar membrane is described bywhich is called center frequency, the expression of Gammatone filterbank in time domain is
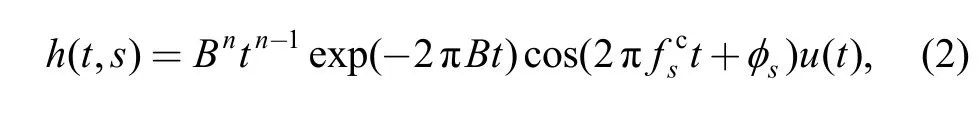
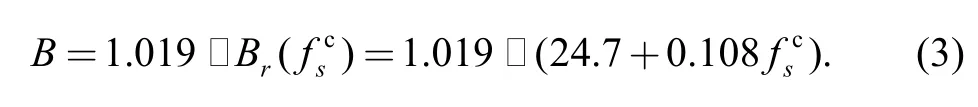
where u(t) is a unit step function; n is the order of the filter,for n=4, the basilar membrane can be simulated effectively;sφ is equal to zero in generally; B is given by
3.2 Inner hair cells model
The output y1(t ,s) of the model of the basilar membrane will be processed by the inner hair cells model. The response of this model can be described by
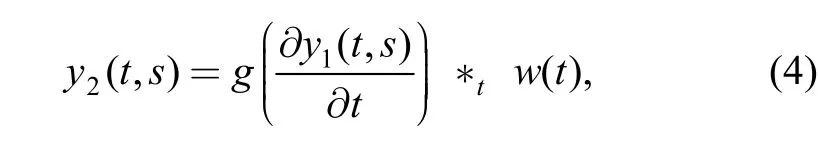
where w(t) is a lowpass filter and g(·) denotes the compressive nonlinearity function, which is a Sigmoidal function expressed as
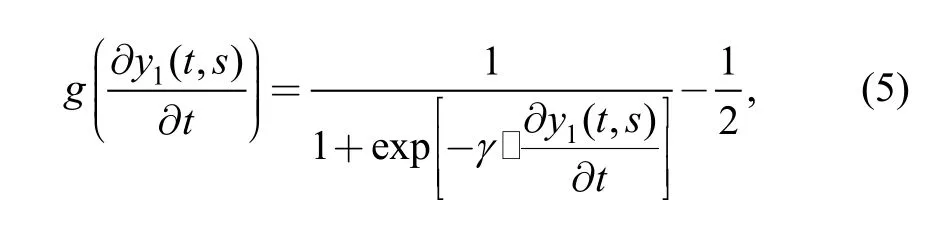
where γ is the gain at the input.
3.3 Lateral inhibitory network (LIN)
In LIN model, y3(t ,s), y4(t ,s) and y5(t ,s) can be obtained in turn. The operations of LIN can be described by
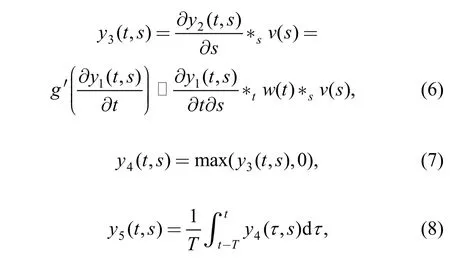
where v(t) is a lowpass filter and the derivative with respect to the axis s is to detect spatial discontinueties in y2(t ,s) along the axis s. In practical applications, v(t) and w(t) may be both ignored.
3.4 Auditory spectrum
The EA model output y5(t ,s) can be considered as one form of auditory spectrum. At the same time, there is slight difference between the usual auditory spectrum V5(t ,s)and y5(t ,s) in the calculation process. For y3(t ,s), retaining only its positively extreme values to obtain V4(t ,s), and then the auditory spectrum V5(t ,s) can be obtained from the following:
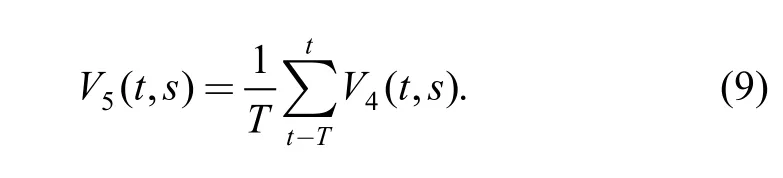
The auditory spectrum with variable t or not can be obtained by adjusting the time length T. Considering the importance of the frequency spectrum in vibration signal analysis, in this paper, the auditory spectrum without variable t will be used to test its performance in the feature extraction of mechanical faults.
The detailed development of EA model is complicated,and it will not be covered here. For further details on EA model and auditory spectrum, please refer to Refs. [1] and[7].
4 Mechanism Anatomy and Feasibility of EA Model
4.1 Mechanism anatomy of EA model
In EA model, the function of basilar membrane model is similar to that of wavelet transform, viz., band-pass filtering. In inner hair cells model, on calculating the derivative of y1(t, s) with respect to time t, we can obtain the variation rate y2(t, s)of each point of y1(t, s) along time axes. Supposing s=s′ and y1(t, s′)is a sine signal, the extrema of y2(t, s′) are the zero-crossings of y1(t, s′). Based on this characteristic and considering the other operations of EA model, one can drawn one conclusion: the most important information extracted and utilized by EA model is the extrema of variation rate of the waveform. This can be approximatively regarded as those zero-crossings, of each signal component in each filtering frequency band of a measured signal. Additional, Sigmoidal function can compress the largest amplitude of a signal and comparatively enhance the amplitude that is close to the largest amplitude. Then, for sine signal, on being processed by inner hair cells model, the output waveform may look more like a square wave, which can simplify the results of the subsequent derivative operation.
In LIN model, the first work is to calculate the derivative of y2(t ,s) with respect to s for y3(t ,s) . Because s is corresponding to the center frequency of a filter, obviously,y3(t ,s) represents the difference of the amplitude of signals in two neighboring filtering frequency bands.Therefore, some high peaks in amplitude spectrum will be more observably in auditory spectrum. On the other hand,in conventional frequency analysis, all frequency components are mutually independent. However, EA model extracts not only the amplitude information of signal, but also the difference of amplitude between two neighboring frequency bands. Then the information extracted by EA model is more than that of amplitude spectrum.
The process of calculating V4(t ,s) is a process of half-wave rectifying to avoid zero value in calculatingAt last, the auditory spectrum V5(t ,s )is mean amplitude of V4(t ,s) in every filtering frequency band.
Based on the above analyzing, it can be found that EA model is a synthetic representation about measured signal in some aspects, such as frequency structure, variation rate of waveform, amplitude distribution in each frequency band, and amplitude difference between two neighboring frequency band, etc.
4.2 Feasibility of EA model
Because EA model is designed for speech recognition and has not been applied in mechanical vibration signal analysis, it is necessary to discuss the feasibility of application of EA model in mechanical vibration signal analysis.
First, there are some differences between mechanical vibration signal and speech signal, but none of them is essential difference. The origin of speech signal is the vibration of vocal cords, and what is processed by cochlea is the vibration signal coming from auditory ossicles. These two kinds of vibration can both be regarded as mechanical vibration. Moreover, usually, there are high-order harmonic components in speech signal, which also exist in mechanical vibration signal, especially in vibration signal of machine with faults. Therefore, speech signal and mechanical vibration signal have some common peculiarity from the aspect of signal structure.
Second, many speech signal analysis methods are suitable for mechanical vibration signal, such as frequency spectrum analysis, self-correlation analysis, short time Fourier transform, wavelet transform, and so on. This also indicates that the speech signal analysis method is similar to mechanical vibration signal analysis method.
At last, there isn’t special requirement for signal analyzed by EA model. Moreover, the operation of band-pass filtering in EA model is similar to wavelet transform, which has been widely used in mechanical vibration signal analysis.
In sum, there has no essential impediment to apply EA model into mechanical vibration signal analysis, and it is necessary to test the effects of applications of EA model.
5 Method for Determining the Parameter of Inner Hair Cells Model
For EA model, γ remains to be determined. Obviously,the compressive nonlinearity of the inner hair cells model and the shape of auditory spectrum both greatly depend on the value of γ. When dealing with the issue of speech signals analysis, the parameters of EA model can be determined according to the actual properties of the human auditory system. However, it is well known that the mechanical vibration signal is different from speech signal in some aspects. For example, the amplitude of vibration signal is related to the type and operating condition of a machine. Especially there is not a common level for mechanical vibration signal as for speech signal.Therefore,it is necessary to determine γ according to the case of the measured machine or analyzed signals. The method is proposed as follows.
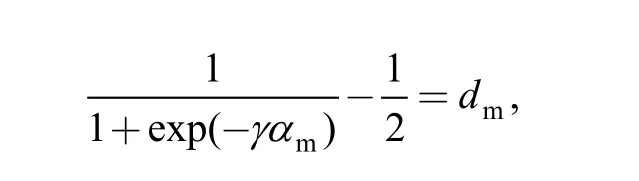
then
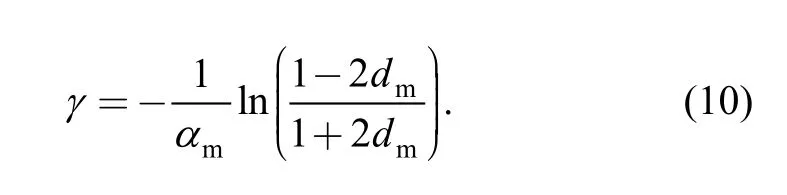
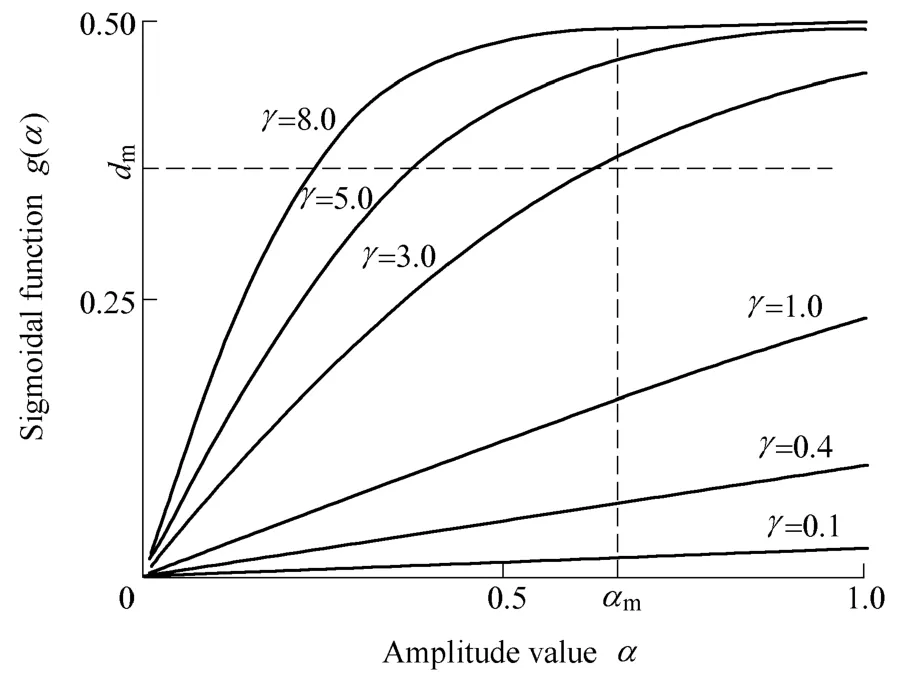
Fig. 3. Curves of g(·) while γ is given different values
Therefore, when calculating auditory spectrum, γ can be determined with given αmand dm.The results of many tests in this work show that, for rotor faults, whenthe auditory spectrum can effectively distinguish different faults, where γ approximates to 5. In addition, it is necessary to say that proposed method is equivalent to the method determining γ directly usingwithout normalization.
6 Experimental Tests
In order to examine the performance of EA model in the feature extraction of mechanical faults, the experiments of four kinds of faults are carried out on a rotor test-bed as shown in Fig. 4. The four faults are misalignment,rotor-to-stator rubbing, oil film whirl and pedestal looseness. The auditory spectrums are calculated using the measured signals of radial displacement of the shaft. The time signals and the corresponding amplitude spectrums are shown in Figs. 5 and 6, respectively.
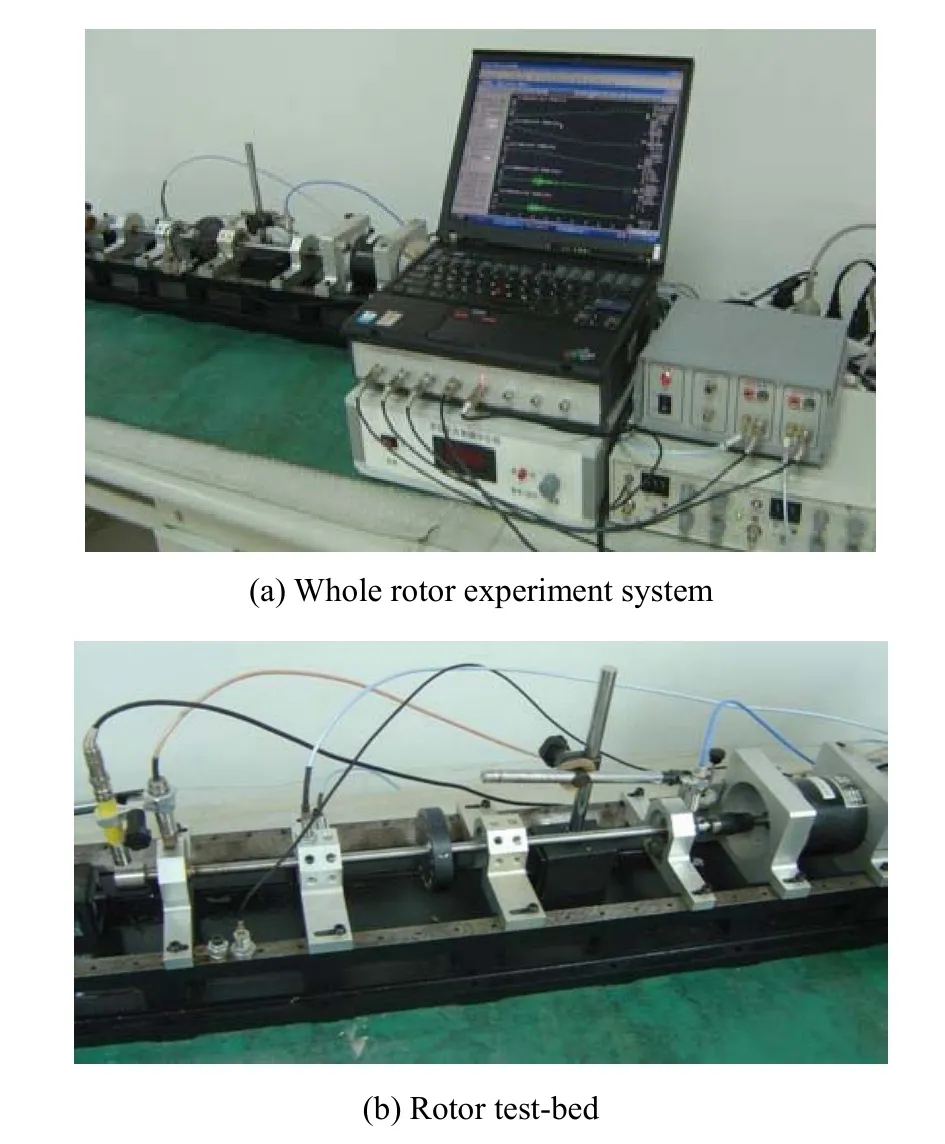
Fig. 4. Pictures of experiment system
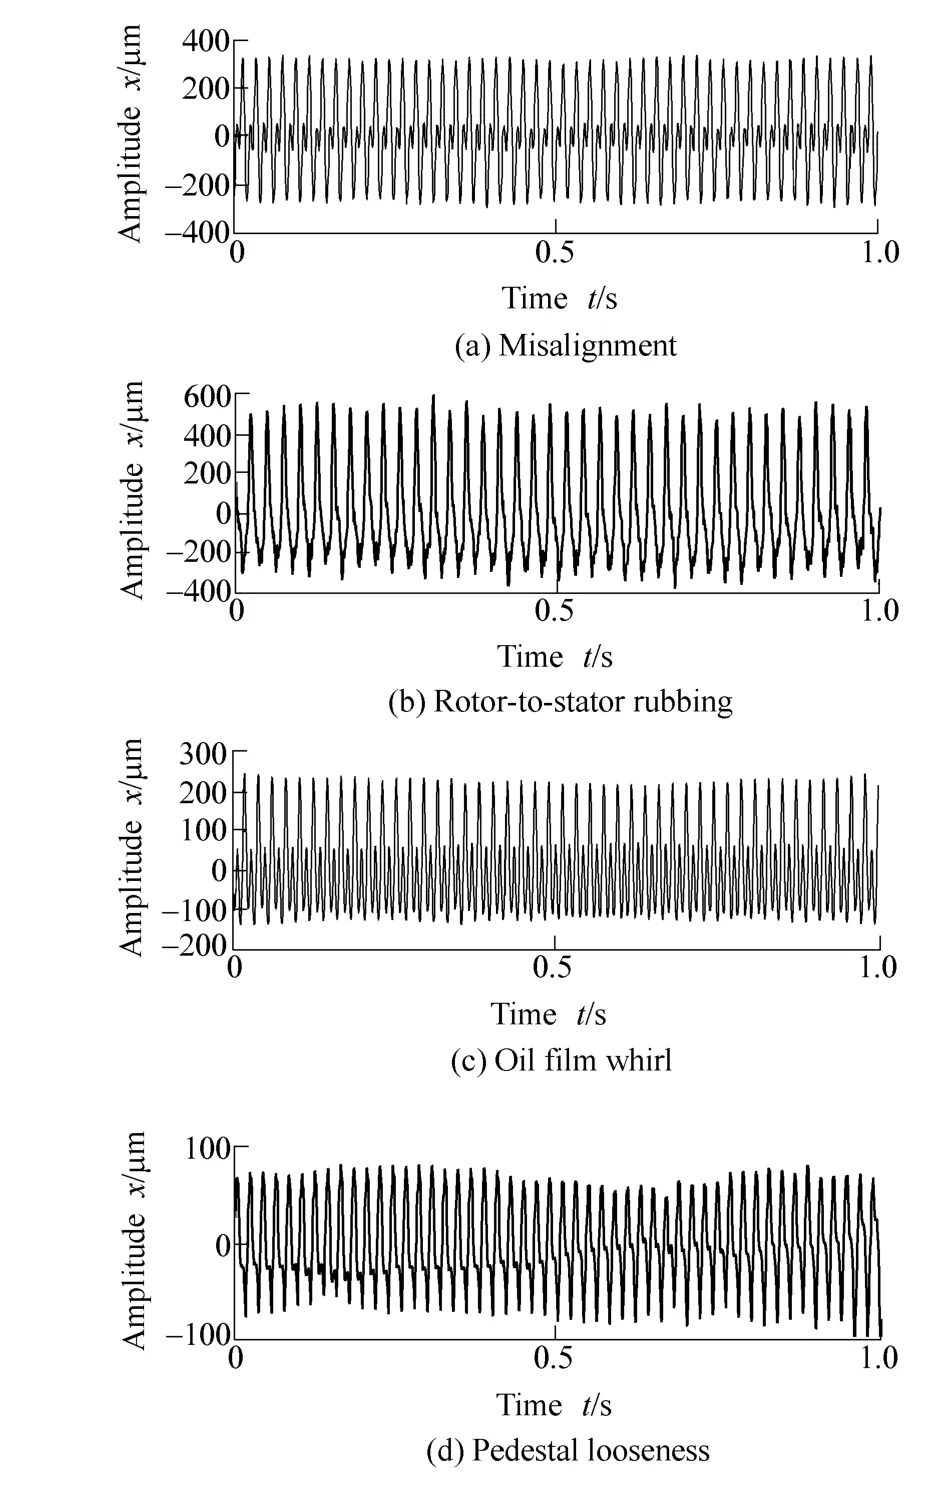
Fig. 5. Signal waveforms of four faults
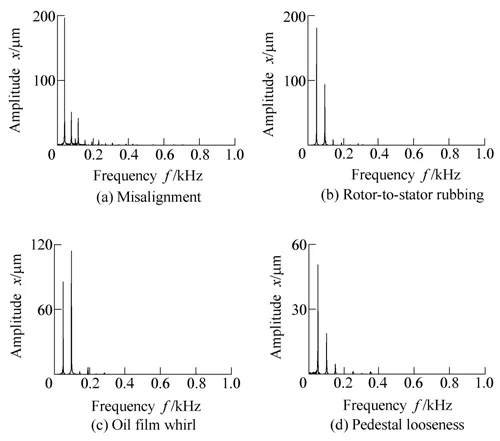
Fig. 6. Amplitude spectrums of four faults
6.1 Test of the effect of feature extraction
To calculate the auditory spectrum, set γ=5 and the Gammatone filters numbers as 120 and 60 to obtained two kinds of auditory spectrums with 120 and 60 points respectively. The center frequencies of filters are uniformly distributed on the logarithmic frequency axis. Two groups of the obtained auditory spectrums are shown in Figs. 7 and 8.
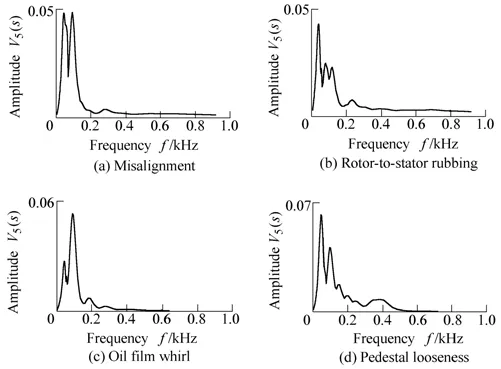
Fig. 7. Auditory spectrums of four faults (120 points)
Comparisons between Fig. 6 and Figs. 7 and 8 show that the frequency components with large amplitude can all be mapped into the corresponding peaks in auditory spectrum and amplitude spectrum. For example, the first and second peaks in each plot of Figs. 7 and 8 can be mapped into their corresponding peaks in each plot of Fig. 6. At the same time, it is difficult for amplitude spectrum to clearly show frequency components with small amplitude (as the frequency components whose frequency is larger than 200 Hz in Fig. 6). But, some of these frequency components might be clearly expressed by the auditory spectrum, such as the speaks nearby 400 Hz in Fig. 7(d) and Fig. 8(d).Therefore, due to the nonlinear operations of EA model,especially the derivative with respect to s in LIN model,auditory spectrum is capable to enhance peaks to express different faults more distinctly.
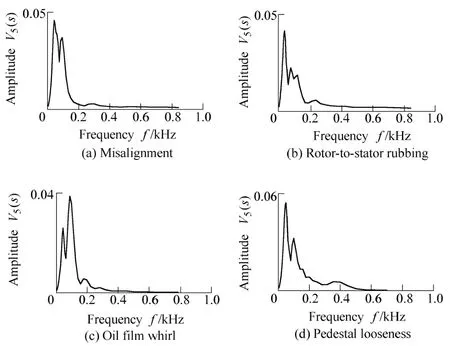
Fig. 8. Auditory spectrums of four faults (60 points)
Auditory spectrum and frequency spectrum both represent time signals in the frequency domain, and the auditory spectrum can be regarded as a result of features extraction to the results of frequency decomposition of signal. But there are many differences between them not only in idea but also the calculating process. Therefore, the way of studying frequency spectrum is not well appropriate to the auditory spectrum.
6.2 Test of the stability of feature extraction
In this section, the faults of misalignment and rotor-to-stator rubbing will be used to test the stability of the EA model in feature extraction. For each kind of faults,the experiments are conducted five times with different fault levels in order to keep the waveforms of the measured signals different. With the parameters calculated from the above section, the auditory spectrums are obtained, as shown in Fig. 9. The figure indicates that the shape of auditory spectrums has high stability when the fault does not encounter great changes. For the randomness of rotor-to-stator rubbing, the fitting against the five auditory spectrums is not as good as the misalignment fault.However, the experiment results still show that the auditory spectrum has satisfactory stability for the same type of faults.
6.3 Test of the influence of the disturbance noise to the auditory spectrum
Because of the high signal-to-noise ratio of the signals measured on the rotor test-bed, Gauss noise generated by program is mixed into measured signals to examine the influence of the disturbance noise to the auditory spectrum.Here, the signal of the fault of oil film whirl (shown in Fig.5(c)) is selected as the test example. The variance of this signal is 11 652 μm2. And the variances of the mixed noises are 400 μm2, 900 μm2, 1 600 μm2and 10 000 μm2,respectively. The obtained auditory spectrums with 120 points of the noisy signals are shown in Fig. 10(a). Fig.10(b) is a local zoom of Fig. 10(a). The numbered line with tag of 1 corresponds to the auditory spectrum of the original measured signal, which is also shown in Fig. 7(c).The left tagged lines show the auditory spectrum under different levels of mixed noise variance, which increase from 2 to 5.
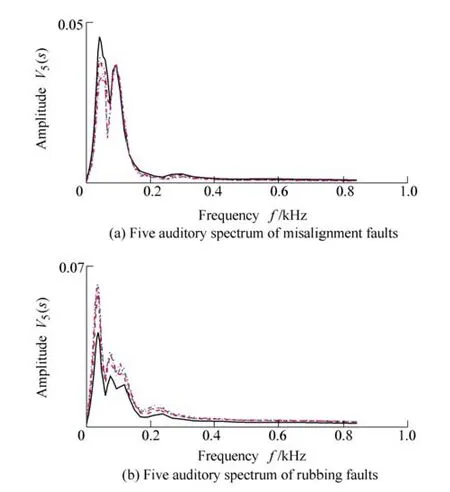
Fig. 9. Comparison of auditory spectrums of different measured signals
Fig. 10 indicates that the noise doesn’t induce random components in the auditory spectrum which can be found in the amplitude spectrum of noisy signal. However, in the low frequency zone, the amplitude of auditory spectrum decreases with the increasing variance of noise. At the same time, the amplitude of the auditory spectrum in high frequency zone just increases slightly, insensitive to the disturbance noise.
The same conclusions can be drawn by the approach mentioned above. Furthermore, the tests results show that if the ratio of the signal variance to the noise variance is bigger than 36, the auditory spectrum will be satisfying.However, this conclusion is based on the assumption that there are no disturbance noises in the signals measured from the rotor test-bed. Therefore, in practical applications,the acceptable ratio of the signal variance to the noise variance should be less than 36.
7 Conclusions
(1) Through analyzing vibration signals of faults of rotor system, the performances of EA model are tested, which include the distinguishability and stability of the results of feature extraction and the influence of noise to the auditory spectrum. The experimental tests results show that it is feasible to use auditory model in the mechanical faults diagnosis.
(2) Furthermore, based on the computing procedure of EA model and the test results, two conclusions can be drawn: 1) It is significant to further process the results of frequency decomposition (such as amplitude spectrum,wavelet coefficient) as EA model does, which maybe obtain more stable, more compact feature information to improve the effect of feature extraction. 2) It is valuable to study the methods of modeling and application of the auditory model with respect to mechanical faults diagnosis.Here, to differentiate the auditory model method from conventional method, like the method of frequency domain,time-frequency domain and amplitude domain, all the methods based on auditory model are defined as perception domain method.
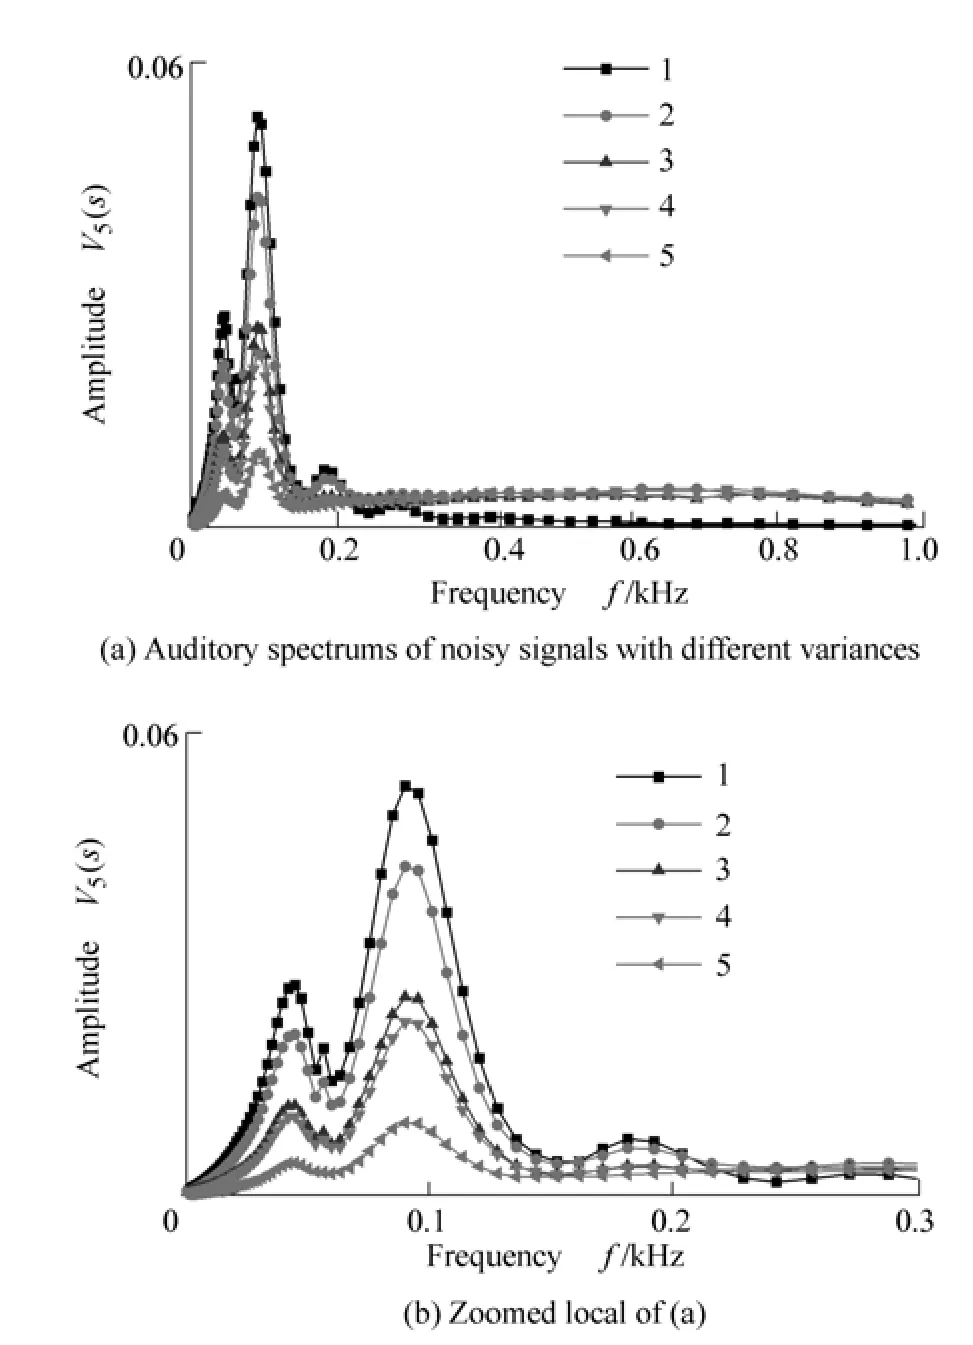
Fig. 10. Influence of the disturbance noise to the auditory spectrum
[1] YANG X, WANG K, SHAMMA S A. Auditory representations of acoustic signals[J]. IEEE Transactions on Information Theory, 1992,38(2): 824–839.
[2] SERAJUL H, ROBERTO T, ANTHONY Z. A temporal auditory model with adaptation for automatic speech recognition[C]//ICASSP’2007, Honolulu, U.S.A, April 15–20, 2007: 1 141–1 144.
[3] LISA G H, LESLIE M C. Using computational auditory models to predict simultaneous masking data: model comparison[J]. IEEE Transactions on Biomedical Engineering, 1999, 46(12): 1 432–1 440.
[4] WRIGLEY S N, BROWN G J. A computational model of auditory selective attention[J]. IEEE Transactions on Neural Networks, 2004,15(5): 1 151–1 163.
[5] VAN DER KOUWE A W, WANG D L, BROWN G J. A comparison of auditory and blind separation techniques for speech segregation[J]. IEEE Transactions on Speech and Audio Processing,2001, 9(3): 189–195.
[6] CHU W, CHAMPAGNE B. A simplified early auditory model with application in speech/music classification[C]//IEEE CCECE/CCGEI, Ottawa, Canada, May 7–10, 2006: 775–778.
[7] WANG K, SHAMMA S. Self-normalization and noise-robustness in early auditory representations[J]. IEEE Transactions on Speech and Audio Processing, 1994, 2(3): 421–435.
[8] CHU W, CHAMPAGNE B. A noise-robust FFT-based auditory spectrum with application in audio classification[J]. IEEE Transactions on Audio, Speech, and Language Processing, 2008,16(1): 137–150.
[9] CHEN Shixiong, GONG Qin, JIN Huijun. Gammatone filter bank to simulate the characteristics of the human basilar membrane[J].Journal of Tsinghua Univ. (Sci &Tech), 2008, 46(6): 33–38. (in Chinese).
[10] SCHLUTER R, BEZRUKOV L, WAGNER H, et al. Gammatone features and feature combination for large vocabulary speech recognition[C]//ICASSP’2007, Honolulu, USA, April 15–20, 2007:649–652.
杂志排行

Chinese Journal of Mechanical Engineering的其它文章
- Precision Grinding of Reaction Bonded Silicon Carbide Using Coarse Grain Size Diamond Wheels
- Chemical Mechanical Polishing of Glass Substrate with α-Alumina-g-Polystyrene Sulfonic Acid Composite Abrasive
- Fretting Wear Behavior of Medium Carbon Steel Modified by Low Temperature Gas Multi-component Thermo-chemical Treatment
- Discrete Stress-strength Interference Model of Reliability Analysis under Multi-operating Conditions