Nitrite Accumulation during the Denitrification Process in SBR for theTreatment of Pre-treated Landfill Leachate*
2009-05-15SUNHongwei孙洪伟YANGQing杨庆PENGYongzhen彭永臻SHIXiaoning时晓宁WANGShuying王淑莹andZHANGShujun张树军
SUN Hongwei (孙洪伟), YANG Qing (杨庆), PENG Yongzhen (彭永臻), SHI Xiaoning (时晓宁), WANG Shuying (王淑莹) and ZHANG Shujun (张树军)
Nitrite Accumulation during the Denitrification Process in SBR for theTreatment of Pre-treated Landfill Leachate*
SUN Hongwei (孙洪伟), YANG Qing (杨庆), PENG Yongzhen (彭永臻)**, SHI Xiaoning (时晓宁), WANG Shuying (王淑莹) and ZHANG Shujun (张树军)
Key Laboratory of Beijing Water Quality Science and Water Environment Recovery Engineering, Beijing University of Technology, Beijing 100124, China
The nitrite accumulation in the denitrification process is investigated with sequencing batch reactor (SBR) treating pre-treated landfill leachate in anoxic/anaerobic up-flow anaerobic sludge bed (UASB). Nitrite accumulates obviously at different initial nitrate concentrations (64.9,54.8,49.3 and 29.5 mg·L-1) and low temperatures, and the two break points on the oxidation-reduction potential (ORP) profile indicate the completion of nitrate and nitrite reduction. Usually, the nitrate reduction rate is used as the sole parameter to characterize the denitrification rate, and nitrite is not even measured. For accuracy, the total oxidized nitrogen (nitrate + nitrite) is used as a measure, though details characterizing the process may be overlooked. Additionally, batch tests are conducted to investigate the effects of C/N ratios and types of carbon sources on the nitrite accumulation during the denitrification. It is observed that carbon source is sufficient for the reduction of nitrate to nitrite, but for further reduction of nitrite to nitrogen gas, is deficient when C/N is below the theoretical critical level of 3.75 based on the stoichiometry of denitrification. Five carbon sources used in this work, except for glucose, may cause the nitrite accumulation. From experimental results and cited literature, it is concluded thatspecies may be contained in the SBR activated-sludge system.
landfill leachate, nitrite accumulation, denitrification, C/N ratio, carbon source, sequencing batch reactor
1 INTRODUCTION
Conventional biological denitrification involves a series of biological reduction processes, given in Eq. (1).In this process, nitrate is converted to nitrogen gas by nitrate reductase (NaR), nitrite reductase (NiR), nitric oxide reductase (NoR), and nitrous oxide reductase(N2oR), correspondingly [1].

Nitrite is one of the intermediates of nitrate reduction process. It is generally considered that reduction rate of nitrite is higher enough than that of nitrate, so that nitrite accumulation will not occur during the denitrification process [2]. However, nitrite accumulation in denitrification is frequently observed [3-9], probably due to the lower reduction rate of nitrite with respect to that of nitrate. Nitrite accumulation is caused by microbial communities with different characteristics for nitrate and nitrite reduction. Some denitrifiers with different denitrification ability are summarized in Table 1.

Table 1 Summary of characteristics of denitrifiers for nitrate and nitrite reduction
① Ref. [5];②Ref. [9].
The previous studies on nitrite accumulation in denitrification have some shortcomings. First, nitrite accumulation is mainly observed in the treatment of municipal wastewater, nitrogen fertilizer industry, and simulated wastewater, but it has not been reported on high strength landfill leachate. Second, the information on denitrification kinetics is not provide. Finally, there is not accurate and simple method to indicate the completion of denitrification to avoid the discharge of more harmful nitrite into the receiving water body.
Therefore, the objectives of this work are as follows. (1) To investigate nitrite accumulation during denitrification at different initial nitrate concentrations and low temperatures, (2) to perfect denitrification kinetics with the total oxidized nitrogen (nitrate + nitrite), (3) to develop an accurate and simple method to indicate the complete reduction of nitrate and nitrite by using ORP as process control parameter, and (4) to investigate the effects of various carbon sources and C/N ratios on the nitrite accumulation in denitrification.
2 MATERIALS AND METHODS
2.1 Landfill leachate
2.2 Experimental setup and operation
The SBR has an effective volume of 9 L, with three ports on its sidewall for insertion of a DO probe, a pH probe and an oxidation-reduction potential (ORP) probe. Dissolved oxygen is supplied through a porous diffuser installed at the bottom of the SBR. The liquor and activated sludge are completely mixed by using a mechanical stirrer at a constant speed of 40 r·min-1.


The SBR operation is as follows. During the aerobic phase, ammonia nitrogen is oxidized completely to nitrate. Subsequently, the nitrate is reduced to nitrogen gas in the anoxic phase. Steady biological nitrogen removalnitrate is achieved for 116 days, and nitrite accumulation is not observed during the whole nitrification process.
2.3 Analytical methods
3 RESULTS AND DISCUSSION
3.1 Relation between concentrations of -N and -N and ORP in denitrification
The ORP is calculated based on Eq. (2) and the semi-reaction of nitrate and nitrite reduction, Eq. (3) and Eq. (4), for the stoichiometric calculation.


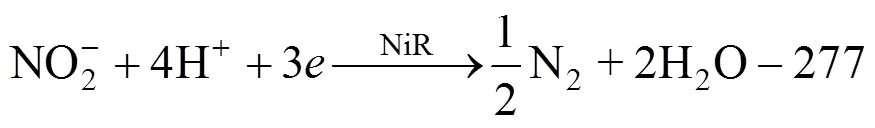
whereOis the standard oxidation-reduction potential (V),is the numbers of transferred electrons,is molar gas constant, 8.314 J·mol-1·K-1;is temperature(K);is Faraday constant, 96487 C·mol-1, [Red] is multiplication of all kinds of reduced state materials concentration, [Ox] is multiplication of all kinds of oxidized state materials concentration.
3.2 Denitrification kinetics
Generally, the denitrification rate is described by Monod equation [19]:

whereDNis denitrification rate, mg·L-1·d-1,is nitrate concentration, mg·L-1,is maximum specific utilization rate, d-1, andSis half-saturation constant, mg·L-1. The nitrate reduction rate is commonly used as the sole parameter to characterize the denitrification rate, and nitrite is not even measured. For accuracy, the total oxidized nitrogen (nitrate + nitrite) may be used as a measure, though details characterizing the process may be overlooked.
The reduction rates of nitrite and nitrate are equal at the peak point of nitrite concentration according to the Monod equation. Before the peak point, the nitrate reduction rate gradually decreases as the nitrate concentration decreases, and nitrite reduction rate increases with nitrite concentration increase. The difference between nitrate and nitrite reduction rates decrease until they are equal. After the peak point, both nitrate and nitrite reduction rates decrease as their concentrations decrease until the completion of denitrification.
3.3 Effect of C/N ratio on the rate of denitrification

Figure 2 shows the effect of C/N ratios on the denitrification rate. Significant nitrite accumulation is observed at five C/N ratios, though the C/N ratio of 2.25︰1 is below the theoretical critical value of 3.75 based on stoichiometry of denitrification. Table 2 shows the average rates of nitrate reduction, nitrite accumulation, and nitrite reduction, indicating that the nitrite accumulation is due to the lower reduction rate of nitrite with respect to that of nitrate in the denitrification process. The nitrite concentration in the final effluent is relatively high when C/N ratio is 2.25︰1, but the nitrate concentration is below 5 mg·L-1for five C/N ratios. In other words, the dosages of carbon source is sufficient for the reduction of nitrate to nitrite, but is deficient for further reduction of nitrite to nitrogen gas when C/N is below the theoretical critical level of 3.75. It is also found that both nitrate and nitrite are not reduced completely at C/N ratio of 3.75︰1, probably because some organics are assimilated by microorganism.
The nitrite reduction becomes rate-limiting step in the denitrification process with nitrite accumulation. It is concluded that if the denitrification is completed by two groups of cooperative denitrifiers, bacteria for nitrate reduction and those for nitrite reduction, the former is more competitive for trapping electron.
3.4 Effect of various carbon sources on the rate of denitrification
Batch tests were carried out using the sludge taken from the SBR reactor. In each test, 1L of mixture were used in each batch reactor. Five different carbon sources and NaNO3solution are added into the batch reactors (R1methanol; R2ethanol; R3sodium acetate; R4sodium propionate; R5glucose) at C/N ratio of 6︰1, to provide sufficient carbon sources. The temperature was around 13.9°C.


Figure 3 The effect of various carbon sources on the denitrification process at 13.9°C
△ methanol;★ ethanol; ○ sodium acetate;● sodium propionate;■ glucose
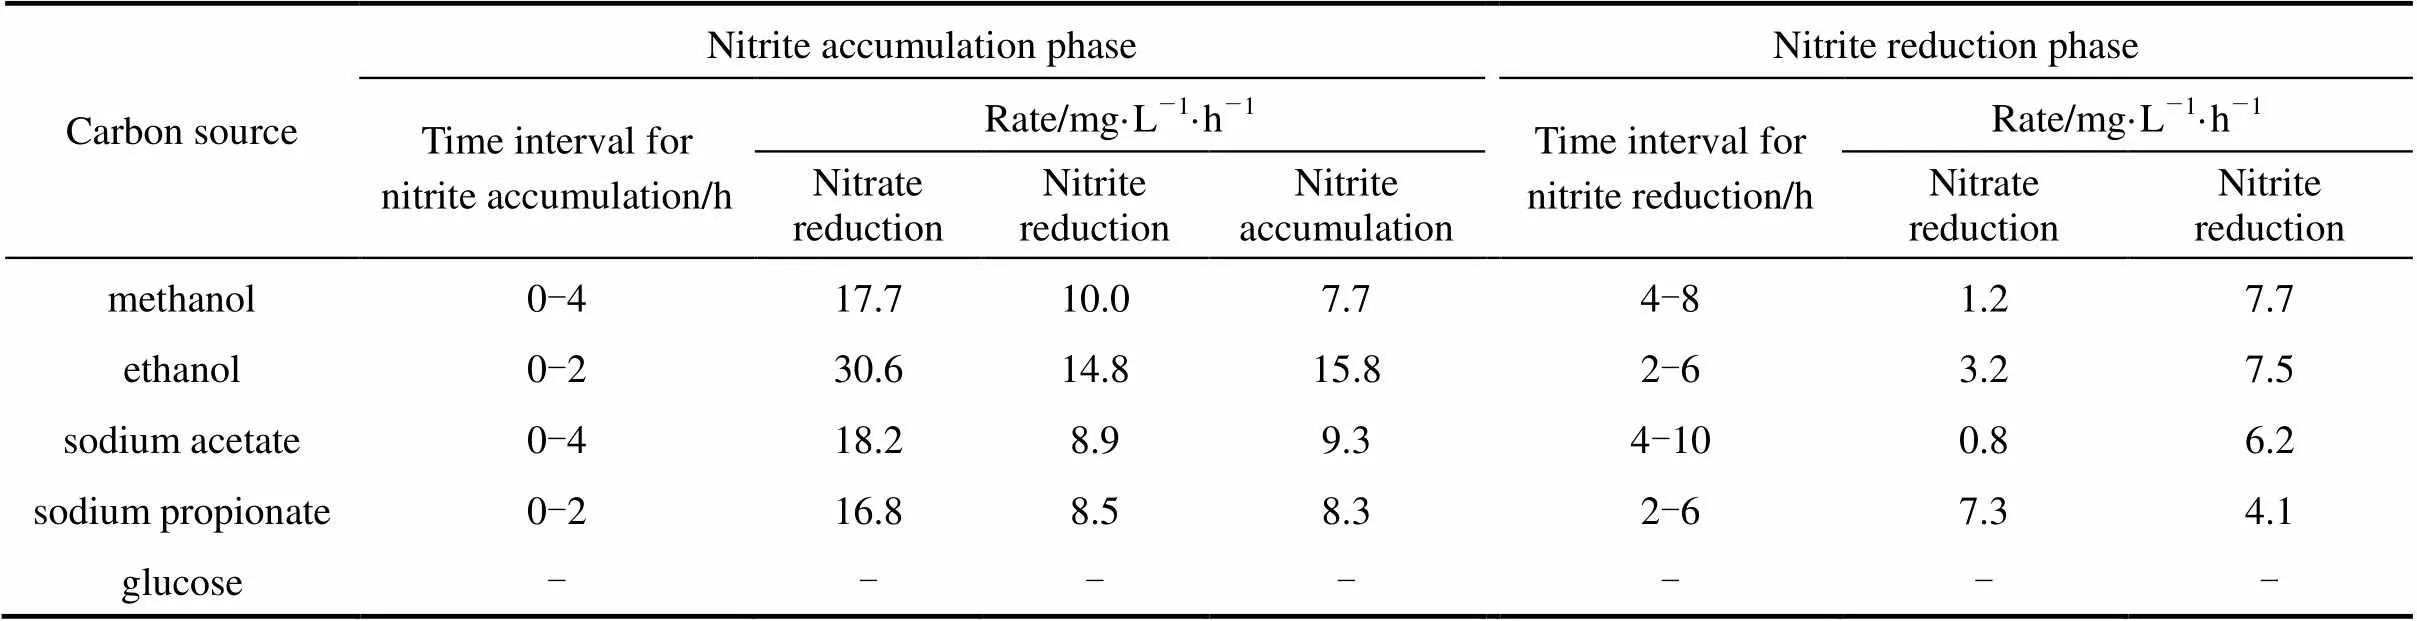
Table 3 The rates of nitrate reduction, nitrite reduction, nitrite accumulation during denitrification process
Note:Nitrite reduction rate: difference between measured rates of nitrate reduction and nitrite accumulation during nitrite accumulation phase.
Figure 3 shows the effect of five carbon sources on the nitrite accumulation in denitrification. Methanol, ethanol, sodium acetate, and sodium propionate are easily utilized by denitrifying bacteria to supply electron donor, in which nitrite accumulates obviously and reaches the peak concentrations, and then the denitrification is completed. However, when glucose is used as carbon source, both nitrate reduction and nitrite accumulation are not observed. This is different from the conclusions drawn by Blaszczyk. [4], who reported that significant nitrite accumulation in medium with glucose and nitrate. But it is agreement with the previous study, in whichcould not utilize glucose as electron donor [20] and reduction rates of nitrite is lower than nitrate [9]. Thus, it is concluded that theshould grow in the activated-sludge system. Table 3 shows that the average rates of nitrate reduction, nitrite accumulation, and nitrite reduction for different carbon sources during denitrification. The results further indicate that the main reason for nitrite accumulation is the lower reduction rate of nitrite with respect to that of nitrate.
4 CONCLUSIONS
Significant nitrite accumulation in denitrification is observed, which is caused by the lower reduction rate of nitrite than that of nitrate. The conclusions are as follows.
(1) It is feasible to use ORP as process control parameter to indicate the completion of nitrate and nitrite reduction based on the characteristic points of the “nitrate knee” and “nitrite knee” on its profile.
(2) In the denitrification with nitrite accumulation, the total oxidized nitrogen(nitrate + nitrite) should be used to perfect denitrification kinetics.
(3) The nitrite accumulation in denitrification is affected by types of carbon sources, rather than C/N ratio, andspecies should grow in the activated-sludge.

Table 2 The rates of nitrate reduction, nitrite reduction,nitrite accumulation during nitrite accumulation phase
Note:Nitrite reduction: difference between measured rates of nitrate reduction and nitrite accumulation.
NOMENCLATURE
ORP oxidation-reduction potential, mV
1 Tchobanoglous, G., Burton, F.B., Stensel, H.D., Wastewater Engineering Treatment and Reuse, 4th edition, Metcalf and Eddy, Inc., USA (2003).
2 Wilderer, P.A., Jones, W.L., Dau, U., “Competition in denitrification systems affecting reduction rate and accumulation of nitrite”,.., 21 (2), 239-245 (1987).
3 Requa, D.A., Schoeder, E.D., “Kinetics of packed-bed denitrification”,....., 45 (8),1696-1707 (1973).
4 Blaszczyk, M., Mycielski, R., Deptuch, H.J., Brzostek, K., “Effect of various sources of organic carbon and high nitrite and nitrate concentrations on the selection of denitrifying bacteria (I) Stationary cultures”,..., 29 (4), 397-406 (1980).
5 Betlach, M.R., Tiedje, J.M., “Kinetic explanation for accumulation of nitrite, nitric oxide and nitrous oxide during bacterial denitrification”,..., 42 (6), 1074-1084 (1981).
6 Kone, S., Behrens, U., “The kinetics of denitrification (I) Mixed populations and acetate as the carbon source”,.., 9 (5), 525-533 (1981).
7 Blasczyk, M., “Effect of medium composition on the denitrification of nitrate bydenitrificans”,..., 59 (11), 3951-3953 (1993).
8 Martienssen, M., SchÖps, R., “Biological treatment of leachate from solid waste landfill sites—Alterations in the bacterial community during the denitrification process”,.., 31 (5), 1164-1170 (1997).
9 Martienssen, M., SchÖps, R., “Population dynamics of denitrifying bacteria in a model biocommunity”,.., 33 (3), 639-646 (1999).
10 APHA, Standard Method for the Examination of Water and Wastewater, 19th edition, American Public Health Association, Washington, DC (1995).
11 Peng, Y.Z., Gao, J.F., Wang, S.Y., Sui, M.H., “Use of pH and ORP as fuzzy control parameters of denitrification in SBR process”,..., 46 (4/5), 131-137 (2002).
12 Peng, Y.Z., Liang, H., Wang, P., “Using oxidation-reduction potential (ORP) and pH value for process control of short-cut nitrification-denitrification”,..., 38 (12), 2933-2942 (2003).
13 Peng, Y.Z., Chen, Y., Peng, C.Y., Liu, M., Wang, S.Y., Song, X.Q., Cui, Y.W., “Nitrite accumulation by aeration controlled in sequencing batch reactors treating domestic wastewater”,..., 50 (10), 235-243 (2004).
14 Peng, Y.Z., Yang, Q., Liu, X. H., Zeng, W., Mino, T.K., Satoh, H., “Nitrogen removalnitrite from municipal wastewater at low temperatures using real-time control to optimize nitrifying communities”,..., 41 (23), 8159-8164 (2007).
15 Wang, S.Y., Gao, D.W., Peng, Y.Z., Wang, P., Yang, Q., “Nitrification-denitrificationnitrite for nitrogen removal from high nitrogen soybean wastewater with on-line fuzzy control”,...,49 (5/6), 121-127 (2004).
16 Qureshi, A ., Lo, K.V., Liao, P.H., Mavinic, D.S., “Real-time treatment of dairy manure: Implication of oxidation reduction potential regimes to nutrient management strategies”,.., 99 (5), 1169-1176 (2008).
17 Wang, Z.L., Zhou, Y.P., Li, S.L., Liu, J.G., Physical Chemistry, 4th edition, Higher Education Press, Beijing (2006). (in Chinese)
18 Madigan, M.T., Martinko, M., Parker, J., Brock Biology of Microorganisms, Science Press, Beijing (1997).
19 Monod, J., “The growth of bacteria cultures”,..., 3 (2), 371-394 (1949).
20 Balows, A., Truper, H.G., Dworkin, M., Harder, W., Schleifer, K., Prokaryotes: A Handbook on the Biology of Bacteria, Springer-Verlag New York, Inc, USA (1981) .
2009-01-15,
2009-06-06.
the National Natural Science Foundation of China (50978003), the Natural Science Foundation of Beijing (8091001), the Funding Project for Academic Human Resources Development in Institutions of Higher Learning Under the Jurisdiction of Beijing Municipality (PHR 20090502), and the State Key Laboratory of Urban Water Resource and Environment (HIT) (QAK200802).
** To whom correspondence should be addressed. E-mail: pyz@bjut.edu.cn; shw@emails.bjut.edu.cn
杂志排行

Chinese Journal of Chemical Engineering的其它文章
- Study on the Flow Field around Two Parallel Moving Bubbles andInteraction Between Bubbles Rising in CMC Solutions by PIV*
- Kinetic Rate Constant of Liquid Drainage from Colloidal Gas Aphrons*
- β-Diketones at Water/Supercritical CO2 Interface: A MolecularDynamics Simulation*
- Analysis of Sucrose Esters with Long Acyl Chain by Coupling ofHPLC-ELSD with ESI-MS System*
- Adsorptive Removal of Copper Ions from Aqueous Solution UsingCross-linked Magnetic Chitosan Beads
- Gas Flow in Unilateral Opening Pulse Tubes Based on Real Gas Equation of State