Fabrication of YAG: Ce3+ and YAG: Ce3+,Sc3+ Phosphors by Spark Plasma Sintering Technique
2024-04-11ZHOUWeixinLOUChaogang
ZHOU Weixin,LOU Chaogang
(School of Electronic Science and Engineering,Southeast University,Nanjing 210096,China)
Abstract: In this study,a single-doped phosphors yttrium aluminum garnet (Y3Al5O12,YAG): Ce3+,single-doped YAG: Sc3+,and double-doped phosphors YAG: Ce3+,Sc3+ were prepared by spark plasma sintering(SPS) (lower than 1 200 ℃).The characteristics of synthesized phosphors were determined using scanning electron microscopy (SEM),X-ray diffraction (XRD),and fluorescence spectroscopy.During SPS,the lattice structure of YAG was maintained by the added Ce3+ and Sc3+.The emission wavelength of YAG: Ce3+prepared from SPS (425-700 nm) was wider compared to that of YAG: Ce3+ prepared from high-temperature solid-state reaction (HSSR) (500-700 nm).The incorporation of low-dose Sc3+ in YAG: Ce3+ moved the emission peak towards the short wavelength.
Key words: high-temperature solid-state reaction;spark plasma sintering;yttrium aluminum garnet;phosphors
1 Introduction
At present,the applied photovoltaic technologies are focused on silicon-based solar cell technology.The conversion efficiency of single junction solar cells can be increased to 31% (eg,1.1 eV) by applying the traditional Shockley-Queiser’ detailed balance model[1].However,spectral mismatch caused by mono-crystalline silicon solar cells results in inefficient spectral response at the short wavelength range,thereby limiting the conversion efficiency of solar cells[2].An effective solution to improve the photoelectric conversion efficiency is the spectral modification,in which down-conversion luminescence is being developed as the research direction[3-10].The “down-conversion luminescence” is also called Stokes shift and is defined as the transfer of partial energy between luminescent materials.The luminescent materials absorb one high-energy photon and emit two or more low-energy photons,which is defined as “quantum cutting”.These emitted low-energy photons are absorbed by solar cells,resulting in more electron-hole pairs.The down-conversion model on solar cells was first applied in 2002(Trupke T)[11].They predicted an increase in the maximum conversion efficiency of crystalline silicon cells to 38.4% (eg,1.1 eV).
Yttrium aluminum garnet (Y3Al5O12,YAG) doped with rare earth ions has properties such as low cost,ease of preparation,high reflectivity,thermal stability,and good fluorescence.YAG: Ce3+is a phosphor developed by doping Ce3+in YAG,and its lattice parameters,optical properties,and thermal performance have been studied by Taher Ghrib[12].It has a wide excitation spectrum (300-500 nm)[13]and emission wavelength summit at 550 and 575 nm with corresponding electron energies of 2.26 and 2.16 eV,respectively.The light transfer yellow effect by YAG: Ce3+is due to the electron transition of Ce3+from 4f to 5d.However,lattice constant and bond length measurement confirm the absence of structural distortion in pure YAG by the doping of Ce3+.By employing YAG: Ce3+coating on the surface of solar cells,the photoelectric conversion efficiency of solar cells can be increased from 15.30% to 15.46%[14].In perovskite solar cells,the presence of Ce increases the open-circuit voltage[15].
Scandium oxide (Sc2O3) can be used to replace some Al ions in YAG because of its large ion radius,though it has no 4f energy level and electron transition.The structure and properties of Ce3+[16],Yb3+[17],and Nd3+[18]doped Y2O3-Al2O3-Sc2O3can be changed by adding Sc2O3.The addition of Sc2O3increases the particle size and improves mass transfer and densification,thereby broadening the emission bandwidth of lanthanum ions.This technology has been widely applied in disordered garnet ceramic laser studies.
Different kinds of down-conversion phosphors with a particle size large than 15 µm are usually fabricated by the high-temperature solid-state reaction(HSSR) method.The spark plasma sintering (SPS) is a new technology for preparing functional materials such as ceramic[19]and alloy[20].During operation,it integrates two technologies: uni-axial hot pressing and plasma activation.During the SPS process,the sample is placed in a vacuum environment and subjected to a certain uni-axial pressure.The sample is heated using the instantaneous discharge plasma generated by the on-off direct current (DC) pulse and finally completes the sintering process.The SPS method embodies technological advantages such as uniform heating,fast heating rate,low sintering temperature,short sintering time,high production efficiency,and uniform product structure.However,there is a lack of research on the preparation of down-conversion phosphors by the SPS method and their application on solar cells.
In this study,Ce3+doped,low-dose Sc3+doped,and Ce3+and Sc3+co-doped YAG were synthesized as down-conversion phosphors using the SPS method,and their performance properties were investigated.The three types of phosphors examined in this study are labeled as YAG: Ce3+,YAG: Sc3+,and YAG: Ce3+,Sc3+.The mineralogical,morphological,and molecular characteristics of these three types of phosphors were determined using scanning electron microscopy (SEM),X-ray diffraction (XRD),and fluorescence spectroscopy.Meanwhile,the performance of the three phosphors prepared with the SPS method is compared with the commercial YAG: Ce3+prepared using the HSSR method.
2 Experimental
Pure oxide powders of CeO2(99.99%),Sc2O3(99.99%),Y2O3(99.99%),and Al2O3(99.99%) were mixed in three desired molar ratios to prepare three types of YAG phosphors containing Ce3+,Sc3+,and both Ce3+and Sc3+.The standard molecular formulae of the three YAG phosphors are YAG:xCe3+;YAG:ySc3+;YAG:xCe3+,ySc3+,where thexandycorrespond to (x=1mol%,y=0) (x=0,y=1mol%) and (x=0.5mol%,y=0.5mol%),respectively.The mixed powders with ethanol in desired ratios were ground using an agate mortar for 2 h and placed in a graphite die.The mixtures in the graphite die were then sintered during the SPS process(Fig.1(a)) (Dr.SINTER,SPS-1050,Sumitomo Coal Mining Co.Ltd.,Japan).The sintering temperature was set to about 1 200 ℃ at a heating rate of 80 ℃/min,and the pressure was 25 MPa.Initially,the DC and sample temperature were unstable.However,both became stable after about 100 seconds (Fig.1(b)).At around 770 seconds,the DC was turned off,and the samples were naturally cooled down to room temperature.
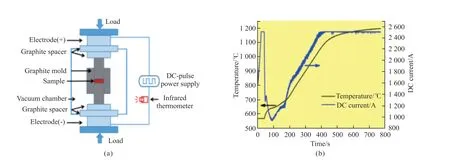
Fig.1 Fabrication of YAG using the SPS method: (a) Schematic diagram of the SPS device;(b) Variation curves of sample temperature and DC
The mineralogy and crystal structure of phosphors were determined using an XRD system (D8 Advance,Germany) with a scanning range from 20° to 60°,step size of 0.02° with Cu-Kα radiation.Fluorescence spectra were obtained by FL3-22 spectrometer (Jobin-Yvon,USA).The micro-structures of the phosphors were observed by SEM (S4800,Hitachi,Japan).
3 Results and discussion
3.1 SEM analysis
Fig.2 shows the SEM images of fractured surfaces of different phosphors fabricated by the SPS method and HSSR method.YAG: Ce3+fabricated by the SPS method contained fewer gaps between grains,indicating uniform grain growth (Figs.2(a) and 2(b)).However,the incorporation of low-dose Sc3+into YAG caused a non-uniform grain growth (Figs.2(c) and 2(d)),which could be attributed to the irregular distribution of Sc3+ions in YAG.As a result,the expansion rate became inconsistent during the SPS reaction process.There was a possibility of replacing Y3+and Al3+in YAG by Ce3+and Sc3+,thereby making Ce3+and Sc3+co-doped YAG phosphors.The co-doped phosphors showed characteristics of both single-doped phosphors,as can be seen in Figs.2(e) and 2(f).For example,the grain size ranges of YAG: Ce3+(Fig.2(b)) and that of both YAG: Sc3+and YAG: Ce3+,Sc3+(Figs.2(d) and 2(f)) prepared by SPS method were 8-15 µm and 5-15 µm,respectively.In contrast,the grain size of commercial YAG: Ce3+prepared from the HSSR method was comparatively larger and was about 50 µm (Figs.2(g) and 2(h)).
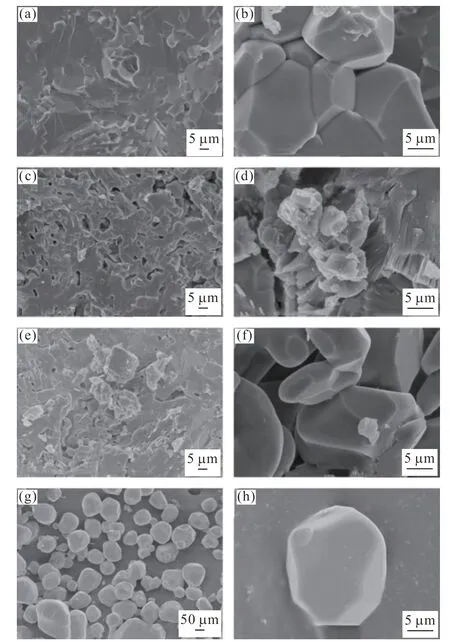
Fig.2 SEM images of (a),(b) YAG: Ce3+,(c),(d) YAG: Sc3+,(e),(f) YAG: Ce3+,Sc3+ prepared by SPS method and (g),(h)commercial YAG: Ce3+ prepared by HSSR method
3.2 XRD analysis
Figs.3(a),3(b),and 3(c) depict XRD patterns of YAG: Ce3+,YAG: Sc3+and YAG: Ce3+,Sc3+phosphors prepared by the SPS method.The XRD pattern of commercial YAG: Ce3+fabricated by the HSSR method (Fig.3(d)) was determined simultaneously as those prepared by the SPS method and was used for comparison.When doped with Ce3+,the lattice structure of the YAG host was unchanged;however,the corresponding diffraction peak intensity was enhanced (Fig.3(a)).The ionic radius of Ce3+(ionic radius 0.102 nm) was closer to that of Y3+(ionic radius 0.090 nm).Therefore,equimolar Y3+could be replaced by Ce3+during incorporation without changing the lattice structure of YAG.Similarly,the dodecahedral lattice structure of the YAG host was unchanged after the addition of low-dose Sc3+(Fig.3b)[21].However,the diffraction peak intensity of YAG was enhanced due to replacing part of Al3+with Sc3+,where Sc3+had a higher ionic radius than Al3+(with the Sc3+ionic radius being 0.089 nm and the Al3+ionic radius being 0.068 nm).Sc3+incorporation effectively promoted the transformation of part of [AlO6]octahedrons into [AlO4]tetrahedrons.The remaining octahedral positions were occupied by another part of Sc3+,which subsequently encompassed the dodecahedral site.The miscellaneous peaks (red box) in the XRD pattern,except for the characteristics peaks of Sc3+and Ce3+,might be due to the energy transfer between Sc3+and Ce3+(Fig.3(c)).However,the diffraction peak enhancement phenomena appeared negatively upon the incorporation of Sc3+,as some Ce3+consumption was triggered by Sc3+through Sc3+and Ce3+cross-reaction.
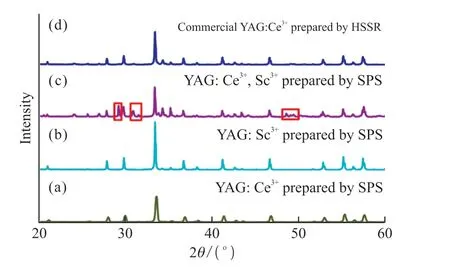
Fig.3 X-ray diffraction patterns of single and co-doped phosphors(a) YAG: Ce3+ prepared by the SPS method,(b) YAG: Sc3+prepared by the SPS method,(c) YAG: Ce3+,Sc3+ prepared by the SPS method and (d) commercial YAG: Ce3+ prepared by the HSSR method
3.3 Fluorescence spectroscopy
According to previous research,there were two monitoring wavelengths at 540[22]and 552 nm[23]for YAG: Ce3+prepared by the HSSR method.In this study,two monitoring wavelengths were selected to examine the impact of different preparation methods and monitoring wavelengths on the shift of emission center wavelength.Fig.4 shows the excitation (left column) and emission (right column) spectra of phosphors prepared by the SPS and the HSSR methods.Under the monitoring wavelength at 550 and 530 nm,the commercial YAG: Ce3+and YAG: Ce3+prepared by the HSSR and the SPS methods respectively (Figs.4(a)and 4(c)) showed an excitation peak at around 470 nm,which could have been caused by the electron transition of Ce3+from 4f to 5d (Fig.5).The emission peak of corresponding phosphors was at 550 nm (Figs.4(b) and 4(d)).The YAG: Ce3+prepared by the SPS had a wider wavelength range (425-700 nm) where the short wavelength was shifted by 75 nm (Fig.4(d)) compared to the wavelength range of YAG: Ce3+(500-700 nm) prepared by HSSR (Fig.4(b)),which was a new finding.SPS exerted high pulse current and mechanical pressure on the sample within a short time,which might passivate the surface defects of particles,inhibit the oxidation of Ce3+,and promote Ce3+by occupying the tetrahedral sites of Y3+,finally broadening the emission spectrum band.

Fig.4 The excited and emission spectra of (a),(b) commercial YAG: Ce3+ prepared by the HSSR method,(c),(d) YAG: Ce3+ (e),(f) YAG:Sc3+ and (g),(h) YAG: Ce3+,Sc3+prepared by the SPS method
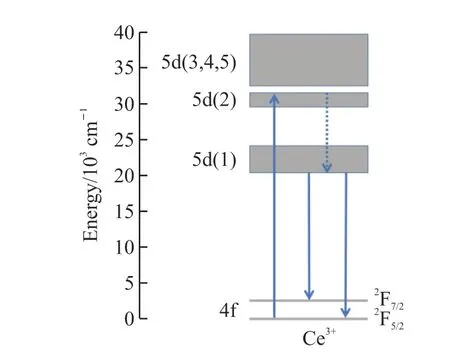
Fig.5 Schematic energy-level diagram electron transition of YAG:Ce3+ phosphors prepared by the SPS method
In YAG: Sc3+(prepared by SPS),a secondary peak of about 470 nm in the preliminary scan of the excitation spectrum was selected as the monitoring wavelength (Fig.4(e)).Under the monitoring wavelength of 470 nm,the excitation peak at 422 nm was shifted to a shorter wavelength (Fig.4(e)).However,in the corresponding emission spectrum,there was a narrow emission band in the range of 525-575 nm (Fig.4(f)).The appearance of 425-500 nm and 635-700 nm bands in the same spectrum might be related to the inhomogeneous broadening phenomenon[24]caused by substituting some Al ions with Sc ions (Fig.4(f)).The ionic radius of Sc3+was much larger than that of Al3+but smaller than that of Y.Therefore,in the garnet lattice,Sc ions can be located in both octahedral sites (Al site)and dodecahedral sites (Y site).
The excitation peak shifted to 398 nm in Ce3+and Sc3+co-doped YAG (i e,YAG: Ce3+,Sc3+) prepared using the SPS method (Fig.4(g)).The emergence of this positive phenomenon indicated that the SPS method was more sensitive and effective at a short wavelength.The emission peak of YAG: Ce3+and Sc3+was moved to 450 nm (Fig.4(h)),and the broad wavelength range(425-700 nm) (see Fig.4(d)) was changed to a narrow wavelength range (425-500 nm).The replacement of all or part of Al3+with Sc3+would lead to crystal field disorder of the YAG lattice[25].As depicted in XRD(Fig.3) and fluorescence (Fig.4(f)) analyses,the electronegativity was increased in the matrix due to the differences in cation ion radii.Subsequently,the emission spectrum was shifted to a short wavelength[26].As a result of inhomogeneous broadening,the emission peak shifted from around 550 nm (Figs.4(b),4(d),and 4(f))to around 450 nm (Fig.4(h)).
All emission spectra of the four samples have been recorded under the excitation wavelength of 365 nm to effectively analyze the emission spectral wavelength range and peak distribution of phosphors.
One of the important findings of this fluorescence study was that the application of the SPS method to prepare YAG: Ce3+phosphors led to an increase in its wavelength range compared to that of the commercial YAG: Ce3+phosphors prepared from the HSSR method.Furthermore,the addition of a small dose of Sc3+(YAG:Ce3+) moved the emission peak to a shorter wavelength,and the wide wavelength range became narrower(Fig.4(h)).
4 Conclusions
In this study,YAG: Ce3+,YAG: Sc3+,and YAG:Ce3+,Sc3+phosphors were fabricated by the SPS method,and their physical characteristics were compared with those of commercial YAG: Ce3+which was prepared by the traditional HSSR method.The mineralogical,morphological,and molecular characteristics of fabricated single and co-doped phosphors were determined using XRD,SEM,and fluorescence spectroscopy.The XRD analysis showed that the single and co-doping of Ce3+and Sc3+in the YAG host did not change its lattice structure and indicated the applicability of the SPS method for the preparation of YAG: Ce3+/Sc3+.SEM data showed that the phosphors prepared by SPS have compact structures without any structural defects.The characteristic of the fluorescence emission peak of YAG: Ce3+prepared from the SPS method was attributed to the electron transition of Ce3+from 4f to 5d.One of the main findings in fluorescence spectroscopic analysis was that the occurrence of a wider wavelength range (425-700 nm) for YAG: Ce3+prepared by the SPS method had compared with that of the commercial YAG: Ce3+(500-700 nm) prepared by the HSSR method.There was a 75 nm shift of the short wavelength in YAG: Ce3+prepared by the SPS method compared to that of the HSSR method,which explained the special passivation action.Co-doping of low-dose Sc3+to prepare YAG: Ce3+,Sc3+had optimized the lattice environment in the matrix of YAG and subsequently drove the emission peak to a shorter wavelength.In conclusion,the SPS is a feasible method for the preparation of photo-conversion phosphors.
Conflict of interest
All authors declare that there are no competing interests.
杂志排行
Journal of Wuhan University of Technology(Materials Science Edition)的其它文章
- Preparation of Modified UiO-66 Catalyst and Its Catalytic Performance for NH3-SCR Denitration
- Effect of Molecular Weight on Thermoelectric Performance of P3HT Analogues with 2-Propoxyethyl Side Chains
- Ultraviolet Photodetector based on Sr2Nb3O10 Perovskite Nanosheets
- Fabrication of Silane and Desulfurization Ash Composite Modified Polyurethane and Its Interfacial Binding Mechanism
- Bio-inspired Hydroxyapatite/Gelatin Transparent Nanocomposites
- Photocatalytic Activity Enhancement in Organic Dyes Degradation by Loading Ag Nanoparticles onto α-Fe2O3/ZnOs
