To analyze the differentially expressed genes in chronic rejection after renal transplantation by bioinformatics
2024-04-04JINShuaiYUYifanSONGJiahuaLITaoWANGYi
JIN Shuai, YU Yi-fan, SONG Jia-hua, LI Tao, WANG Yi✉
1. Department of Renal Transplantation, the Second Affiliated Hospital of Hainan Medical University, Haikou 570100, China
2. Department of Urology, the Second Affiliated Hospital of Hengyang Medical College, University of South China, Hengyang 421001, China
Keywords:
ABSTRACT Objective: To use bioinformatics technology to analyse differentially expressed genes in chronic rejection after renal transplantation, we can screen out potential pathogenic targets associated with the development of this disease, providing a theoretical basis for finding new therapeutic targets.Methods: Gene microarray data were downloaded from the Gene Expression Profiling Integrated Database (GEO) and cross-calculated to identify differentially expressed genes (DEGs).Analysis of differentially expressed genes (DEGs) with gene ontology (GO) is a method used to study the differences in gene expression under different conditions as well as their functions and interrelationships, while Kyoto Encyclopedia of Genes and Genomes (KEGG) enrichment analysis is a tool used to explore the functions and pathways of genes in specific biological processes.By calculating the distribution of immune cell infiltration, the result of immune infiltration in the rejection group can be analysed as a trait in Weighted Gene Co-Expression Network Analysis (WGCNA) for genes associated with rejection.Then, protein-protein interaction networks (PPI) were constructed using the STRING database and Cytoscape software to identify hub gene markers.Results: A total of 60 integrated DEGs were obtained from 3 datasets (GSE7392, GSE181757, GSE222889).By GO and KEGG analysis, the GEDs were mainly concentrated in the regulation of immune response, defence response, regulation of immune system processes, and stimulation response.The pathways were mainly enriched in antigen processing and presentation, EBV infection,graft-versus-host, allograft rejection, and natural killer cell-mediated cytotoxicity.After further screening using WGCNA and PPI networks, HLA-A, HLA-B, HLA-F, and TYROBP were identified as hub genes (Hub genes).The data GSE21374 with clinical information was selected to construct the diagnostic efficacy and risk prediction model plots of the four hub genes, and the results concluded that all four Hub genes had good diagnostic value (area under the curve in the range of 0.794-0.819).From the inference, it can be concluded that the four genes, HLA-A, HLA-B, HLA-F and TYROBP, may have an important role in the development and progression of chronic rejection after renal transplantation.Conclusion: DEGs play an important role in the study of the pathogenesis of chronic rejection after renal transplantation,and can provide theoretical support for further research on the pathogenesis of chronic rejection after renal transplantation and the discovery of new therapeutic targets through enrichment analysis and pivotal gene screening, as well as inferential analyses of related diagnostic efficacy and disease risk prediction.
1.Introduction
One of the best clinical strategies for the treatment of end-stage renal disease (ESRD) is now to perform kidney transplantation,which can significantly improve the quality of life of patients compared to long-term dialysis treatment.Despite advances in current surgical techniques and immunosuppressive therapies,which have reduced the rate of acute rejection within a short period of time, long-term survival remains low, with only about 50% of donor organs from deceased donors and 70% of donor organs from living donors remaining in a relatively stable state of function even after 10 years of transplantation[1].Thus, long-term graft survival remains a major challenge.
Chronic Kidney Transplant Rejection (CKTR) is characterised by a progressive decline in renal graft function, which begins to manifest one year after transplantation and is usually accompanied by hypertension and proteinuria[2].CKTR usually occurs in patients who are inadequately immunosuppressed or medically noncompliant[3].It is a complex immune process involving both cellular and humoral immune responses, leading to fibrosis and vasculopathy within the renal allograft and is often ineffective with current immunosuppressive regimens.Chronic rejection poses an enormous clinical and socio-economic burden, affecting not only transplant recipients but also global healthcare systems.The exact mechanisms of chronic rejection are still not fully understood, hampering the development of targeted therapies and diagnostic biomarkers.
In recent years, bioinformatics has emerged as a powerful tool for deciphering complex biological processes and identifying molecular signatures associated with disease.Bioinformatics approaches are capable of integrating multi-omics data, such as gene expression profiles, protein-protein interactions, and immune cell infiltration,allowing for a comprehensive analysis of the complex network of interactions and regulation involved in chronic rejection[4].By combining computational analysis with experimental validation,bioinformatics can help to identify key genetic molecular determinants that contribute to the development and progression of chronic rejection as well as help to identify signature genes and signalling pathways associated with chronic rejection.The study of signature genes associated with chronic rejection can provide important insights into the underlying immune processes and molecular pathways that lead to graft dysfunction and eventual graft loss.By identifying specific genes or gene networks that are dysregulated during chronic rejection, researchers can gain a deeper understanding of the immune mechanisms involved and potentially identify new targets for therapy or intervention.
The aim of this paper is to explore the characteristic genes associated with chronic rejection after kidney transplantation through bioinformatics analysis.By employing cutting-edge computational methods, we seek to identify key gene networks, signalling pathways and immune-related processes that are dysregulated in chronic rejection.By integrating different datasets, including gene expression profiling, immunological markers and immune cell infiltration analyses, potential biomarkers and therapeutic targets were identified to improve long-term graft survival in kidney transplantation.The results of this study have the potential to enhance our understanding of the pathogenesis of chronic rejection, guide personalised immunosuppression strategies and facilitate the development of novel therapeutic interventions.Ultimately, this study may contribute to improving the prognosis and long-term graft survival of kidney transplant patients.
2.Materials and methods
2.1 Data acquisition
In this study, we downloaded raw gene expression data from the GEO database.We selected patients who were greater than 1 year after renal transplantation (those who showed a decline in renal function were divided into the rejection group, and those with stable renal function were used as the control group), and after the screening process, we finally used four datasets: GSE7392[5], GSE181757[6] , GSE222889, and GSE21374 (see Table I).GSE7392, GSE181757.GSE222889 were used as study datasets for the training group, and GSE21374[7] was a dataset with clinical data to further validate whether the expression of the screened genes had an effect on graft survival.
2.2 Differential gene screening
GSE7392, GSE181757, GSE222889 post-transplant chronic rejection-related microarrays were downloaded from the GEO database, and the expression data were screened for differentially expressed genes (DEGs) between the rejection and stabilisation groups using the “limma” R package.“Limma” is an R software package for analysing gene expression microarray data using linear models to design experiments and assess differential expression.The up-regulated and down-regulated genes were obtained separately using P < 0.05 and the absolute value of logFC (foldchange of difference) greater than 1 as the screening conditions.The upregulated and down-regulated differential genes from the three datasets were intersected respectively, and the results were visualised and displayed with Wayne diagrams, and the suitable DEGs were used for the next analysis, and we visualised the screened DEGs by volcano diagrams.
2.3 Functional enrichment analysis
In order to study the significantly enriched functions of DEGs between the exclusion and stable groups in the dataset, and to better understand the important pathways involved in DEGs, the Gene Ontology System provides structured, computable information about the functions of genes and gene products[8].The Kyoto Gene(GO) and Genome Encyclopedia (KEGG) is a widely used database for systematic studies of gene function.Functional enrichment analyses were performed based on the R package clusterProfiler and the results of the enrichment analyses were visualised through the Sangerbox platform and represented using cluster diagrams.
2.4 Weighted gene co-expression network analysis and module gene selection
The systems biology strategy WGCNA was used to explore correlations between genes, and weighted gene co-expression network analysis can be used to study correlations in biochip samples, as well as to find appropriate biomarkers or therapeutic targets in different biological contexts[9].The results of immune infiltration in the exclusion group of the dataset GSE181757 were analysed as traits for WGCNA.The main processes used in WGCNA are sample clustering to remove outlier samples, co-expression network construction and identification of related modules.The trait gene networks were finally visualised.WGCNA analysis was used to identify important modules of immune cells in the exclusion group.Common genes (CGs) obtained from the intersection of related genes and DEGs by online Venn diagrams (Venn) were used for the next step of the analysis.
2.5 Protein Interaction Network Analysis
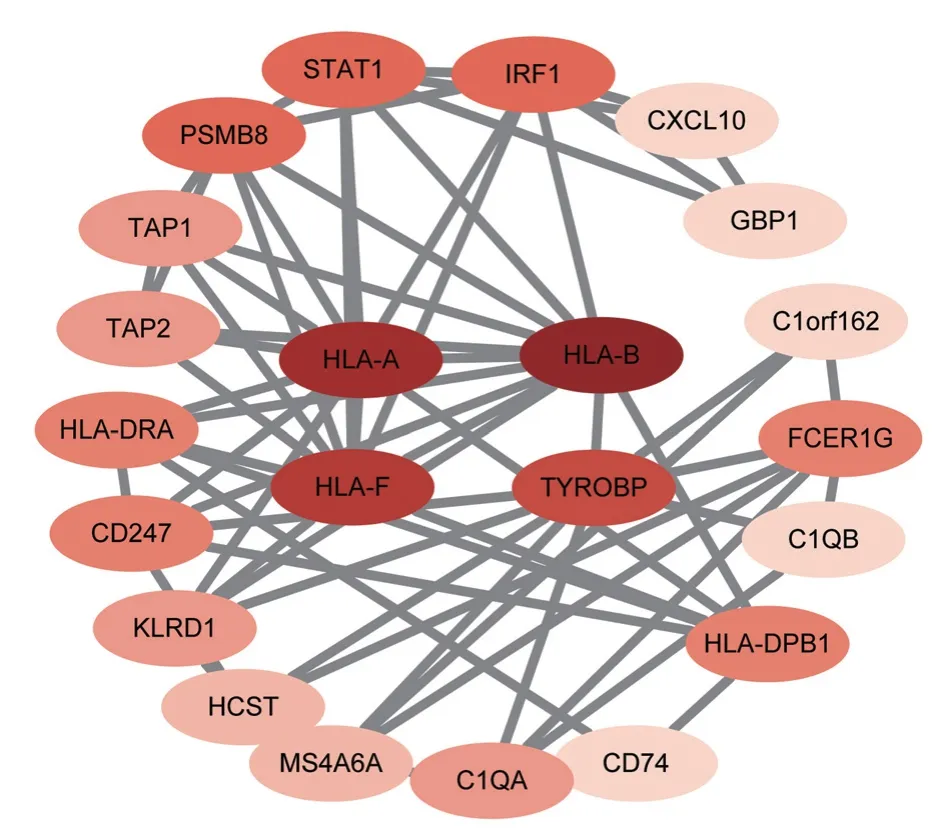
The CGs obtained by screening using the above method will be imported into the Gene minia database to construct a protein interactions network graph and visualise it.Using String database,we can set the screening condition of minimum interactions score greater than 0.7 and use cytoscape 3.10.0 for visualisation.At the same time, we can also calculate the number of nodes (node) and the degree of connectivity (degree).Using the MCC algorithm of the cytoHubba plugin, the top 4 genes with the highest degree of connectivity were selected as hub (Hub) genes.
2.6 Validation of Hub gene expression, diagnostic efficacy and risk assessment
The GSE21374 dataset was downloaded from the GEO database for validation of Hub gene expression.The dataset contained 76 samples of patients who developed rejection and 206 samples of stable patients after renal transplantation (see Table 1).The upregulated and down-regulated genes were obtained withP< 0.05 and the absolute value of logFC (fold change foldchange) greater than 1.Finally, SPSS 26.0 was used to create ROC curves for the Hub gene to verify the diagnostic efficacy of the gene.We used the “survival”package in R to conduct proportional risk hypothesis testing and fitted risk regression, and the results were visualised using the“survminer” package and the “ggplot2” package.The results are visualised using the “survminer” package and the “ggplot2”package.

Tab 1 Information from four datasets related to chronic rejection after renal transplantation from the GEO database
3.Results
3.1 Identification of DEGs in chronic post-transplant rejection
We screened three eligible datasets (GSE7392, GSE181757,GSE222889) from the GEO database for analysis, and classified patients in each dataset who were greater than 1 year after renal transplantation and experienced a decline in renal function into the rejection group, and those with stable renal function into the stable group, and the detailed information of the selected datasets is presented in Table 1.The up-regulated and down-regulated genes in each dataset were presented in volcano plots (see Figure 1A-C),and in order to obtain the most valuable DEGs, we visualised the differential genes in the three datasets with Wayne plots, and a total of 60 DEGs were obtained (see Figure 1D).

Fig 1 Selection of differential genes
3.2 GO analysis and KEGG pathway enrichment analysis
Functional and pathway enrichment analyses were performed by the “clusterprofiler” R package and biologically classified.We selected the top 10 significantly enriched biological processes (BP),molecular function (MF) and cellular components (CC) based on the P value and visualised the KEGG terms (see Fig.2), in which GO analysis showed that DEGs were significantly enriched in stimulatory responses, regulation of immune responses, defence responses, and regulation of immune responses in bioengineering.bioengineering,DEGs are significantly enriched in stimulation response, regulation of immune response, defence response, regulation of immune system processes, etc.DEGs are significantly enriched in cellular components, such as major histocompatibility complex, cell membrane, endoplasmic reticulum membrane, intracellular vesicles,etc.DEGs are significantly enriched in molecular function for binding of peptide antigen, binding of aberrant glycoprotein (TAP protein), binding of signalling receptor, etc.KEGG analysis showed that DEGs were significantly enriched in antigen processing and presentation, EBV infection, host resistance of organ grafts, allograft rejection, and natural killer cell-mediated cytotoxicity.

Fig 2 GO and KEGG enrichment analysis
3.3 WGCNA and module analysis
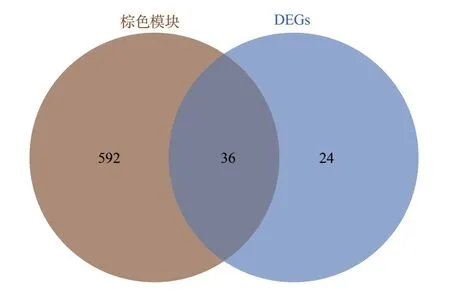
We uploaded the exclusion group data from the GSE 181757 dataset to the website CIBERSORTx and used it to analyse the infiltration of 22 immune cells.The “WGCNA” R package was used to construct the expression profile-weighted gene co-expression network for the exclusion group of the dataset GSE 181757, and the results of immune infiltration of the exclusion group of the dataset GSE 181757 were analysed as traits in WGCNA.the correlation coefficient between log(k) and log(p(k)) was greater than 0.9.A total of 16 modules were independently identified, and grey modules indicate genes that could not be clustered into any module.The correlation between the modules and the results of immune cell infiltration in the exclusion group was visualised (see Fig.3 A to B).Based on the rank of P values, we see that CD4 memory-activated T cells, antigen receptor T cells, and macrophage M1 types are significantly upregulated in the brown modules.There were 628 genes in the brown module.
3.4 Hub gene identification and PPI analysis
We crossed the genes in the brown module with the DEGs mentioned above (see Figure 4) to obtain 36 common genes (CGs)as exclusion-related genes used for the next analysis, and these genes were subjected to PPI network analysis by the STRING tool and imported into the Cytoscape software, where we were able to obtain the highest-scoring results using the MCC algorithm of cytoHubba.HLA-A, HLA-B, HLA-F, and TYROBP are genes with a high degree of concentration, and they play a key pivotal role in the gene network (see Figure 5).A hypothetical protein-protein interaction (PPI) network consisting of 24 genes, including the Hub genes HLA-A, HLA-B, HLA-F, and TYROBP, was constructed by using the GeneMania tool to predict the functions of key genes and possible interaction networks.The PPI network contained a total of 690 links, and ontology analysis of the genes on the network showed that the functions of the 24 genes were focused on MHCI-like antigen processing and presentation, T-cell-mediated immunomodulation, regulation of cell killing, antigen processing,handling, presentation and regulation of immune responses, which coincided with previous GO enrichment and KEGG enrichment analyses, suggesting that the pathogenesis of chronic rejection may lie in these pathways (see Fig.6).

Fig 3 WGCNA of the GSE181757 disease group in the dataset

Fig 4 Cross Venn diagram of WGCNA brown module and DEGs

Fig 5 PPI construction interaction network

Fig 6 Predicting the gene PPI network with similar func-tions of Hub genes
3.5 Validation of Hub gene expression and diagnostic efficacy in chronic rejection
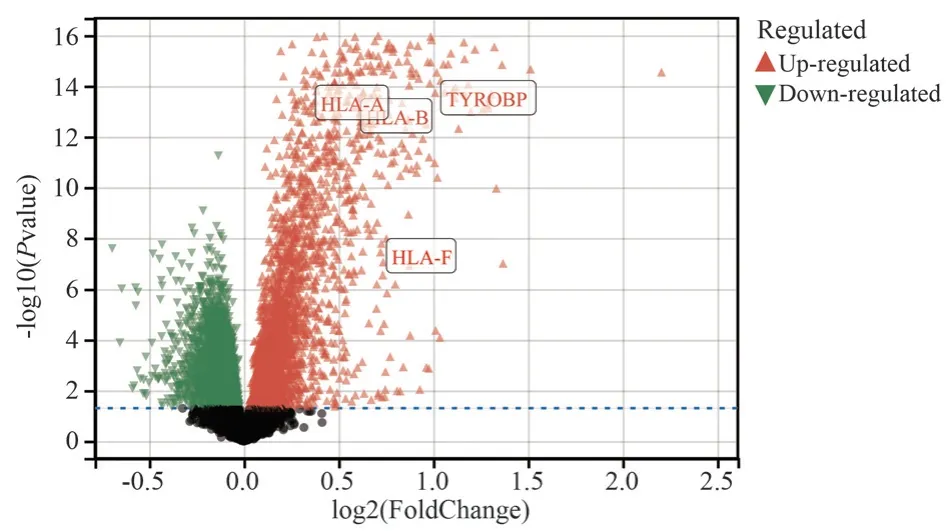
To further confirm the accuracy of the four Hub genes screened,we also selected the GSE21374 microarray dataset for analysis and validation.By drawing volcano plots to visualise the screened differentially expressed genes (DEGs), we found that all four Hub genes were classified as up-regulated genes (see Figure 7).SPSS 26.0 software was used to create ROC curves to validate the diagnostic ability of the Hub genes, and based on the results that the area under the curve ranged from 0.794-0.819, it can be concluded that all four Hub genes have good diagnostic ability (see Figure 8).

Fig 7 Dataset GSE21374 differential gene volcano map
3.6 Validation of the effect of the Hub gene on graft survival
The dataset GSE21374 containing clinical data was used to further validate whether the characterised genes had an effect on graft survival.We divided the expression of the four Hub genes in the GSE21374 microarray into a high expression group and a low expression group according to the median, and based on the results(see Figure 9), we found that the P-value of the graft risk assessment analysis of the four Hub genes in the ROC curves was less than 0.001, suggesting that the four genes were diagnostic, and that all of them had a hazard ratio (HR) value of greater than 1, indicating that the 4 Hub genes were positively correlated with chronic rejection,i.e., the higher the expression the more likely rejection occurs as time progresses.

Fig 8 ROC curves of four Hub genes

Fig 9 Disease risk prediction curve
4.Discussion
Chronic rejection remains a major problem after kidney transplantation leading to graft dysfunction and eventual transplant organ failure, and understanding the underlying mechanisms of chronic rejection is crucial for improving patient prognosis and developing targeted treatment strategies.In this study, we used bioinformatics analysis to identify four hub genes, HLA-A, HLA-B,HLA-F, and TYROBP, and the results significantly suggest that chronic rejection after kidney transplantation is primarily driven by antibody-mediated immune rejection.HLA-A, HLA-B, HLA-F and TYROBP are genes associated with the human immune system.Pathway analyses have shown that they play important roles in processes such as immune response, antigen presentation and intercellular signalling.The identification of HLA-A and HLA-B as hub genes is of particular importance because these genes encode major histocompatibility complex (MHC) class I molecules involved in antigen presentation[10].MHC-I molecules are widely expressed on the surface of virtually all nucleated cells and present different peptide antigens to CD8 T cells for extensive monitoring of many pathogenic conditions and are involved in the process of antigen presentation in the immune system.[11] MHC class I molecules play a key role in immune recognition and are closely associated with the rejection process in transplantation[12,13].In our analysis, the upregulation of HLA-A and HLA-B expression suggests that they may be involved in presenting donor antigens to T cells and triggering a cellular immune response.Previous studies have shown that mismatched HLA antigens between donor and recipient can trigger an immune response leading to the production of donor-specific antibodies (DSA)[14].These DSA bind to MHC class I molecules on the transplanted kidney, activating the complement pathway and leading to graft injury.Thus, the upregulation of HLA-A and HLA-B expression strongly supports the involvement of antibody-mediated immune response in chronic rejection.
In addition, our analyses revealed upregulation of HLA-F, a less studied member of the HLA gene family.HLA-F was first discovered and characterised in 1990 by Geragthy et al.[15].In recent years,HLA-F has been found to be associated with immune tolerance and regulation during pregnancy[16-18].Moreover, HLA-F cell surface expression has been detected on activated immune cells (e.g.B-cells,T-cells, NK-cells), virally infected cells and insulin-containing islets in the pancreas[19-21].Although the specific role of HLA-F in chronic rejection is not fully understood, its up-regulation suggests possible involvement in modulating the immune response and promoting tolerance or inflammation within the graft.This requires further studies to elucidate the exact role of HLA-F in antibodymediated chronic rejection and its potential as a therapeutic target.
In addition to the HLA genes, our analyses identified TYROBP a hub gene.TYROBP, also known as DAP12, TYROBP protein activates intracellular tyrosine kinases and initiates downstream signalling pathways by binding to ligands on the surface of the immune cells[22,23].Binding of TYROBP to its ligands is one of the important mechanisms of activation and regulation of immune cells.TYROBP encodes a transmembrane signalling polypeptide expressed mainly in macrophages, NK cells, dendritic cells and neutrophils[24].TYROBP is essential for the survival, proliferation and function of mononuclear phagocytes[25].TREM1 and TREM2 are the receptors for TYROBP, and inflammation can be activated through the TREM1-TYROBP signalling pathway[26].TYROBP can also be activated in T and B lymphocytes.expressed in small subpopulations of T and B lymphocytes.In human cells, the checkpoints KARAP and KIR-S of these two classes of cells are expressed by CD4+CD28-T cells, which are expanded in patients suffering from chronic inflammatory diseases[27,28].TYROBP encodes adapter proteins involved in immune-receptor signalling pathways, including NK-cell receptors and myeloid receptors, the activation of which can lead to inflammation and immune-mediated injury[29].This all suggests that the function of TYROBP is tightly linked to processes such as activation of immune cells such as natural killer cells (NK cells) and macrophages, apoptotic pathways and inflammatory responses.In our analysis, the upregulation of TYROBP expression suggests that the innate immune response,especially macrophages, NK cells and myeloid cells, may play an important role in antibody-mediated chronic rejection.However,further experimental studies are needed to validate the expression pattern of TYROBP in kidney transplantation samples and to explore its functional significance in chronic rejection.
The finding that chronic rejection after kidney transplantation is predominantly antibody-mediated has important clinical implications.This finding highlights the importance of monitoring and managing the production of deliberate antibodies (DSA) in transplant recipients.Providing strategies to prevent or reduce the occurrence of DSA, such as optimising immunosuppression regimens and tailoring HLA matching, may help to reduce the risk of chronic rejection and improve long-term graft survival.In addition,therapeutic interventions targeting antibody-mediated immune responses, including antibody depletion therapies or complement inhibitors, could be explored as potential treatment strategies for chronic rejection.
In addition, the discovery of HLA-A, HLA-B, HLA-F and TYROBP as hub genes suggests potential avenues for therapeutic targeting.Modulating the expression or function of these genes could help modulate the immune response and reduce the risk of chronic rejection.For example, strategies that target HLA molecules or downstream signalling pathways associated with TYROBP may offer new ways to reduce graft injury and improve long-term outcomes.
Although the analyses in our study provide valuable insights into the underlying mechanisms of chronic rejection, further experimental validation is essential to confirm the involvement of antibodymediated pathways.Immunohistochemical and flow cytometry analyses of renal biopsy samples from patients with chronic rejection can provide direct evidence of antibody deposition and complement activation within the graft.In addition, comprehensive immunological analyses, including assessment of DSA and analysis of immune cell populations and cytokine profiles, can provide a more complete understanding of the immune response associated with chronic rejection.
Although our bioinformatics analyses strongly support the hypothesis of antibody-mediated chronic rejection, however, further studies are needed to validate and extend these findings, such as functional assays and animal models, which could provide more direct evidence for the involvement of these pivotal genes as well as the underlying mechanisms driving chronic rejection.In addition,the complexity of chronic rejection suggests that other factors and pathways may also contribute to its development.Cellular immune responses, inflammation, endothelial dysfunction, and other molecular processes may interact with antibody-mediated pathways to promote graft injury and rejection.Comprehensive studies that consider the interactions between different immune mechanisms are essential for a comprehensive understanding of chronic rejection and for the development of effective therapeutic regimens.
In conclusion, our bioinformatics analyses strongly support the conclusion that chronic rejection after renal transplantation is primarily mediated by antibody-mediated immune responses.The upregulation of HLA-A, HLA-B, HLA-F, and TYROBP provides insights into the molecular processes underlying chronic rejection and suggests potential therapeutic targets.Validation and extension of these findings through further experimental studies and clinical investigations will ultimately improve the management and prognostic outcomes of renal transplant patients.
Authors’ Contribution
Jin Shuai and Yu Yifan: article design, data analysis and manuscript writing; Song Jiahua: related literature collection and organisation,data analysis; Li Tao: article format checking; Wang Yi: providing overall ideas and revisions.
No conflict of interest exists in this paper.
杂志排行
Journal of Hainan Medical College的其它文章
- Effect of honokiol regulating SIRT3 on chronic hypoxia-induced microglia and astrocyte polarization
- SLC6A8 promotes liver cancer cell proliferation by regulating mitochondrial autophagy through BNIP3L
- Clinical characteristics of patients with early-and late-onset optic neuromyelitis optica spectrum disease
- Distribution of gene polymorphisms associated with aspirin antiplatelet in the Han NSTEMI population
- Predictive value of systemic immunity index for sepsis in low-medium risk community-acquired pneumonia
- Effect of different interventions on orthodontic tooth movement acceleration: A network meta-analysis
