Experimental investigation on the permeability of gap-graded soil due to horizontal suffusion considering boundary effect
2024-03-25XuweiWangYeshuangXu
Xuwei Wang,Yeshuang Xu,*
a State Key Laboratory of Ocean Engineering, School of Naval Architecture, Ocean, and Civil Engineering, Shanghai Jiao Tong University, Shanghai, 200240, China
b Shanghai Key Laboratory for Digital Maintenance of Buildings and Infrastructure, Department of Civil Engineering, Shanghai Jiao Tong University, Shanghai,200240, China
Keywords: Suffusion Permeability Experimental investigation Boundary effect Horizontal seepage
ABSTRACT The boundary condition is a crucial factor affecting the permeability variation due to suffusion.An experimental investigation on the permeability of gap-graded soil due to horizontal suffusion considering the boundary effect is conducted,where the hydraulic head difference (ΔH) varies,and the boundary includes non-loss and soil-loss conditions.Soil samples are filled into seven soil storerooms connected in turn.After evaluation,the variation in content of fine sand (ΔRf) and the hydraulic conductivity of soils in each storeroom (Ci) are analyzed.In the non-loss test,the soil sample filling area is divided into runoff,transited,and accumulated areas according to the negative or positive ΔRf values.ΔRf increases from negative to positive along the seepage path,and Ci decreases from runoff area to transited area and then rebounds in accumulated area.In the soil-loss test,all soil sample filling areas belong to the runoff area,where the gentle-loss,strengthened-loss,and alleviated-loss parts are further divided.ΔRf decreases from the gentle-loss part to the strengthened-loss part and then rebounds in the alleviated-loss part,and Ci increases and then decreases along the seepage path.The relationship between ΔRf and Ci is different with the boundary condition. Ci exponentially decreases with ΔRf in the non-loss test and increases with ΔRf generally in the soil-loss test.
1.Introduction
Suffusion in soil induced by seepage flow is a typical internal erosion,meaning that movable fine particles selectively migrate through voids formed by coarse particles and the total volume of soil remains (Moffat and Fannin,2006;Rochim et al.,2017).The suffusion process widely exists in hydraulic and geotechnical engineering (Dong et al.,2018;Yang et al.,2019a,2019b;Fetrati and Pak,2020;Wang et al.,2022),such as embankment dams,dikes,levees,foundation pits and tunnels (Foster et al.,2000;Xu et al.,2012,2013;Wu et al.,2020b,c;Lyu et al.,2021,2022).Suffusion is more likely to occur in gap-graded soil (Sibille et al.,2015;Yin et al.,2020;Yin and Wang,2021),and the soil’s permeability characteristics,such as particle redistribution,porosity,and hydraulic conductivity,vary during suffusion (Rochim et al.,2017;Li et al.,2023).These variations result in the degradation of the soil’s mechanical properties,and specific disasters are likely to occur if the progressive degradation develops,such as collapsing dams,river banks,ground surfaces (Planes et al.,2016;Tan and Long,2021;Wang and Xu,2022),water inrush,and tunnel leakages(Wu et al.,2015,2017;Tan and Lu,2017;Ma et al.,2019).
Experimental investigations are convenient and practical to study the permeability variation of soil induced by different suffusion variables (Ke and Takahashi,2014a,b;Cheng et al.,2017,2018;Selvadurai and Głowacki,2018;Benamar et al.,2019;Peng and Rice,2020),such as the seepage direction (Hosn,2017;Pachideh and Hosseini,2018) and the boundary condition(Caldeira,2019).Experiments based on vertical seepage have been conducted considerably (Chen et al.,2016;Liang et al.,2019;Luo et al.,2019),whereas horizontal seepage widely exists in hydraulic and geotechnical engineering,such as core-wall of embankment dams(Kim et al.,2022),bottom position below waterproof curtain(Xu et al.,2014,2019;Wang et al.,2019;Wang and Xu,2021;Zeng et al.,2021a,b,2022) and middle positions of tunnels (Wu et al.,2020a).Compared to vertical suffusion,the soil’s permeability changes easier under lower hydraulic gradients and distributes ununiformly after horizontal tests (Liang et al.,2020;Luo et al.,2020;Wang and Xu,2023).Moreover,the eroded area develops gradually from the upper to the lower area,and the loss velocity of fine particles in the horizontal direction is slower than that in the vertical direction(Liang et al.,2022).
Furthermore,some studies proved the soil’s ununiform permeability after suffusion under different boundary conditions(Ke and Takahashi,2014a;Deng et al.,2020;Luo et al.,2020;Chen et al.,2021).These studies analyzed the permeability variation affected by a single boundary condition,including soil-loss (Sail et al.,2011;Zhong et al.,2018;Chen et al.,2021) or non-loss boundaries (Deng et al.,2020;Luo et al.,2020),respectively,where the soil-loss boundary means that fine particles can dislodge from the soil while the non-loss boundary limits the runoff of fine particles.Nevertheless,both boundaries can exist simultaneously during suffusion in practical engineering,such as embankment dams and tunnels(Pachideh and Hosseini,2018;Yang et al.,2022).Some studies proposed that the variation in permeability characteristics of soil caused by suffusion under horizontal seepage at different boundary conditions should be studied further(Xiao and Shwiyhat,2012;Pachideh and Hosseini,2018).
This paper investigates the variation in soil permeability characteristics due to suffusion by conducting a horizontal seepage experiment considering different boundary conditions.First,the experimental apparatus and scheme are introduced.Then,the test results of the outflow rate,water level,and grading curve are illustrated.Next,the change rate of local fine particles and hydraulic conductivity are analyzed to investigate the permeability variations under different hydraulic head differences.Finally,the effect of the boundary condition on permeability variation is discussed.
2.Horizontal suffusion experiment
2.1.Experimental apparatus
Fig.1 shows the sketch map and the picture of the experimental apparatus,which includes a water tank,a horizontal cylinder,water-level monitoring tubes,and a water-collect box with strainers.The water tank,with a length,width,and height of 300 mm,300 mm,and 400 mm,respectively,provides constanthydraulic head difference (ΔH) during the experiment.A flexible pipe connects the water tank with a horizontal cylinder.
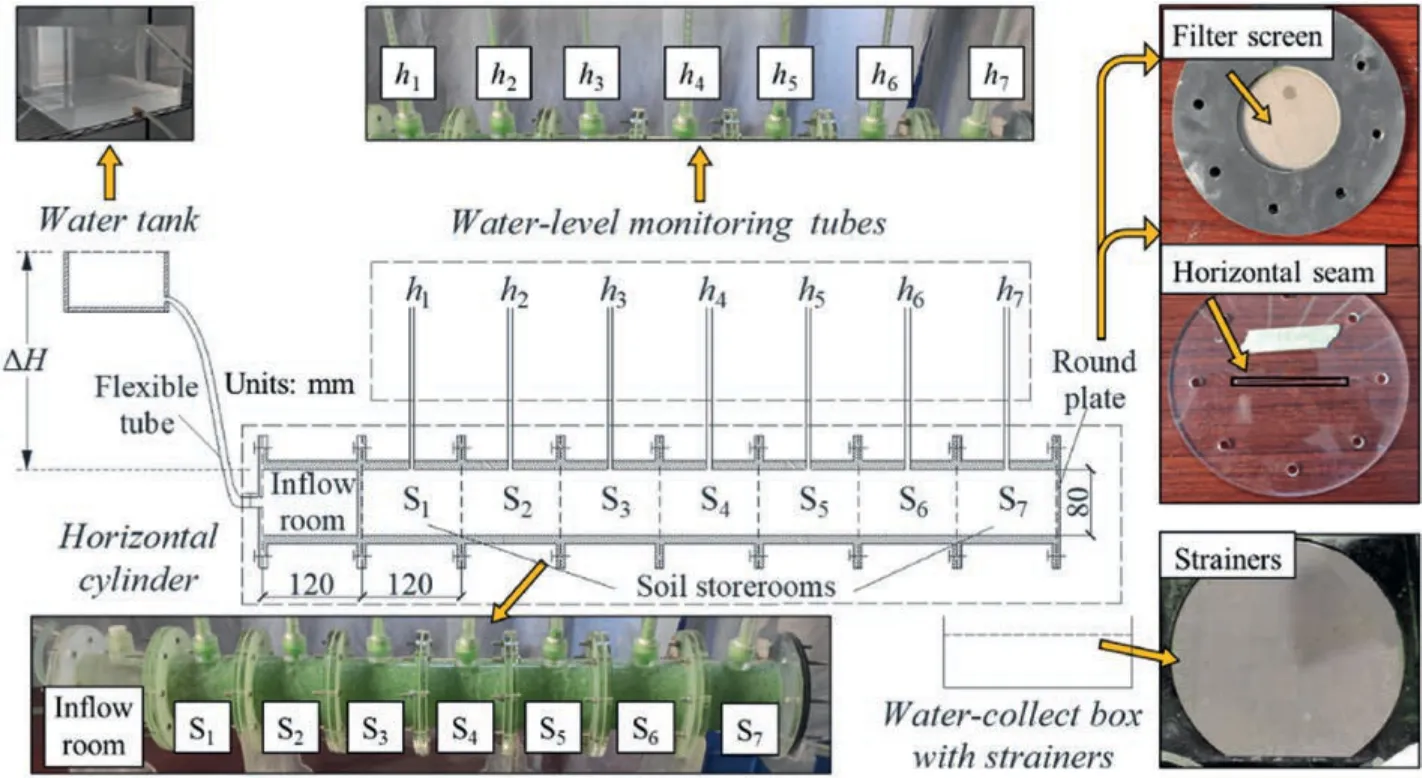
Fig.1.Sketch map and pictures of the experimental apparatus.
The horizontal cylinder includes an inflow room,seven soil storerooms (labeled from S1to S7from upstream to downstream),and a round plate.The horizontal cylinder’s diameter and total length are 80 mm and 960 mm,respectively.The inflow room and soil storerooms with a length of 120 mm each are connected in turn,and a round plate with a filter screen or horizontal seam is set at the tail of storeroom S7to simulate non-loss or soil-loss boundary conditions,respectively.This seam boundary is regarded as a kind of typical leakage type in geotechnical engineering,which can simulate the leakage condition of waterproof curtain in foundation pit engineering,the longitudinal joint of tunnel engineering,core-wall fissure of embankment dams,and so on.
Seven water-level monitoring tubes(labeled fromh1toh7)with a measuring range from 100 mm to 1000 mm are set at the middle point of corresponding soil storerooms(Fig.1).The water-collection box with strainers is placed below the outlet of storeroom S7,and strainers are set above the water-collect box to separate the dislodged particles and outflow water.
2.2.Experimental material and scheme
The experimental material includes coarse white sand and fine green sand.The grain size of coarse sand ranges from 1 mm to 5 mm,and that of fine sand ranges from 0.063 mm to 0.3 mm.Shire et al.(2014)proposed that internal erosion is more likely to occur in the soil with rate of fine particles less than 35%;thus,the mass percentage of fine sand (defined asRf) is set as 15% in this experiment.
Table 1 tabulates the scheme of the suffusion experiment,including the non-loss and soil-loss tests.The ΔHvalue is the experiment’s variable,set as 300 mm,450 mm,600 mm,750 mm,and 900 mm,respectively.The non-loss test includes five cases labeled from U-1 to U-5,and the round plate with a filter screen at the tail of storeroom S7controls the outlet condition,where the void diameter of the filter screen (d) is 0.038 mm to prevent soil loss.The soil-loss test includes five cases labeled from O-1 to O-5,and the round plate with a horizontal seam controls the outlet condition,where the seam width(l)is 1.3 mm,allowing fine sand to pass.

Table 1 The scheme of experiments.
The weights of coarse and fine sands are the same in each case to ensure the consistency of mixed sand.The soil’s physical properties include the dry density and specific gravity by measurement and the porosity by calculation.Three samples are taken in each case to measure the physical properties.The mixed sand is considered uniform when each sample’s measuring error is smaller than 5%.Table 2 tabulates the parameters of the coarse,fine,and mixed soils,and Fig.2 shows the grain size curves in each case.Based on the grading curves,the mixed sample accords with the gap-graded soil according to the division in ASTM D2487 (2011).

Fig.2.Grain size curves of soil sample.
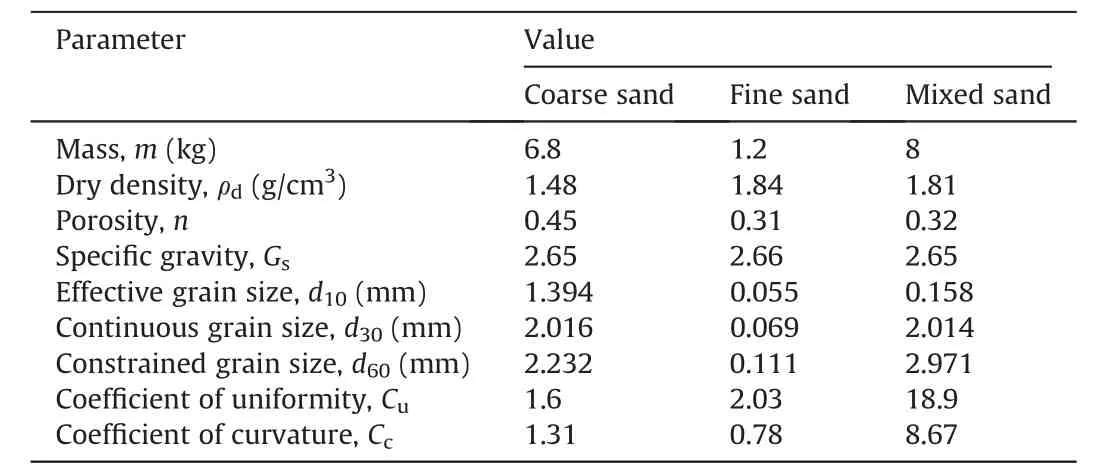
Table 2 Parameters of sandy soil.
Table 3 illustrates the soil mass in each storeroom before test under non-loss or soil-loss boundary.The standard soil mass in each storeroom is approximately 1.1 kg under same operation procedure,in which the maximum error in storerooms is 0.017 kg,0.022 kg,0.021 kg,0.017 kg,and 0.016 kg in the non-loss test,and the corresponding error is 0.018 kg,0.023 kg,0.018 kg,0.017 kg and 0.015 kg in the soil-loss test.Because the mass of coarse and fine sand,the stirring,filling and saturating procedure is tried to keep consistent,the porosity of sample in each storeroom is considered the same.

Table 3 Soil mass in each storeroom before the test.
2.3.Experimental procedure
The experimental procedure is introduced as follows:
(1) Filling and saturating soil: after smearing vaseline on the inner face of apparatus to avoid contact erosion,the mixed soil is filled in a storeroom layer by layer with a thickness of 20 mm,and then the soil is saturated.Next,the storeroom filled with soil is connected to another storeroom.Soil filling,saturation,and storeroom connection are operated repeatedly until the soils in the seven storerooms are filled and saturated.
(2) Assembling the apparatus:a horizontal cylinder is formed by connecting the inflow room and soil storerooms,and the inflow room filled with water is connected to the watersupply system.Seven monitoring tubes are assembled at the middle point of each soil storeroom.An additional round plate is set at the tail of horizontal cylinder preventing runoff of water before test.The water tank is lifted to a specific height to provide a constant ΔHvalue.Test cases begin onlywhen the water level of seven monitoring tubes (fromh1toh7) equals the water tank’s height.
(3) Experimental process: each case in Table 1 is conducted three times to reduce test errors,and each test case lasts 3 h.During the experimental process,the water-level data of seven monitoring tubes (fromh1toh7) are recorded every 15 min,and the outflow rate in 1 min (Q) is measured by measuring the cylinder simultaneously.Strainers above the water-collection box collect the dislodged particles in the soil-loss test.Soil samples in each storeroom are collected separately after each test case to obtain the grain size curves.
3.Experiment results
3.1.Suffusion phenomena at the outlet
Fig.3 shows a picture of suffusion phenomena at storeroom S7in cases U-5 and O-5.Coarse white and fine green sands are uniformly distributed before the test (Fig.3a).After the non-loss test,the green sand area increases noticeably due to the limitation of a filter screen at the tail,where the fine sands accumulate (Fig.3b).However,after the soil-loss test,the proportion of coarse white sand increases (Fig.3c) because the fine sands dislodge (Fig.3d).Since the width of horizontal seam is 1.3 mm,smaller thand10of coarse sand,it is reasonable to consider there is no loss of coarse sand,and only fine green sand can dislodge.

Fig.3.Picture of suffusion phenomena at storeroom S7 in cases U-5 and O-5.
The soil mass in each soil storeroom after the test is tabulated in Table 4.The total mass difference of the soil in all soil storerooms before and after the test (Wt) is smaller than 0.005 kg in non-loss test and that is 0.099 kg,0.166 kg,0.190 kg,0.224 kg and 0.256 kg in soil-loss test.Wtin soil-loss test is closed to the weight of the soil collected by the strainer shown in Fig.3d,which are 0.097 kg,0.163 kg,0.189 kg,0.221 kg and 0.255 kg,respectively.Fig.4 shows the grading curves of dislodged particles.The curves shift down with the increasing ΔHand the increasing proportion of particles with large diameters.Besides,the percentage of dislodged particles(Pd),defined as the weight ratio of dislodged particles and original fine sand,is obtained as shown in Fig.5.The value ofPdincreases from 1.29%to 3.31%when ΔHincreases from 300 mm to 900 mm.That is to say,with the increasing ΔH,Pdincreases due to increasing water pressure.

Fig.4.Grading curves and loss rate of dislodged particles after the soil-loss test.
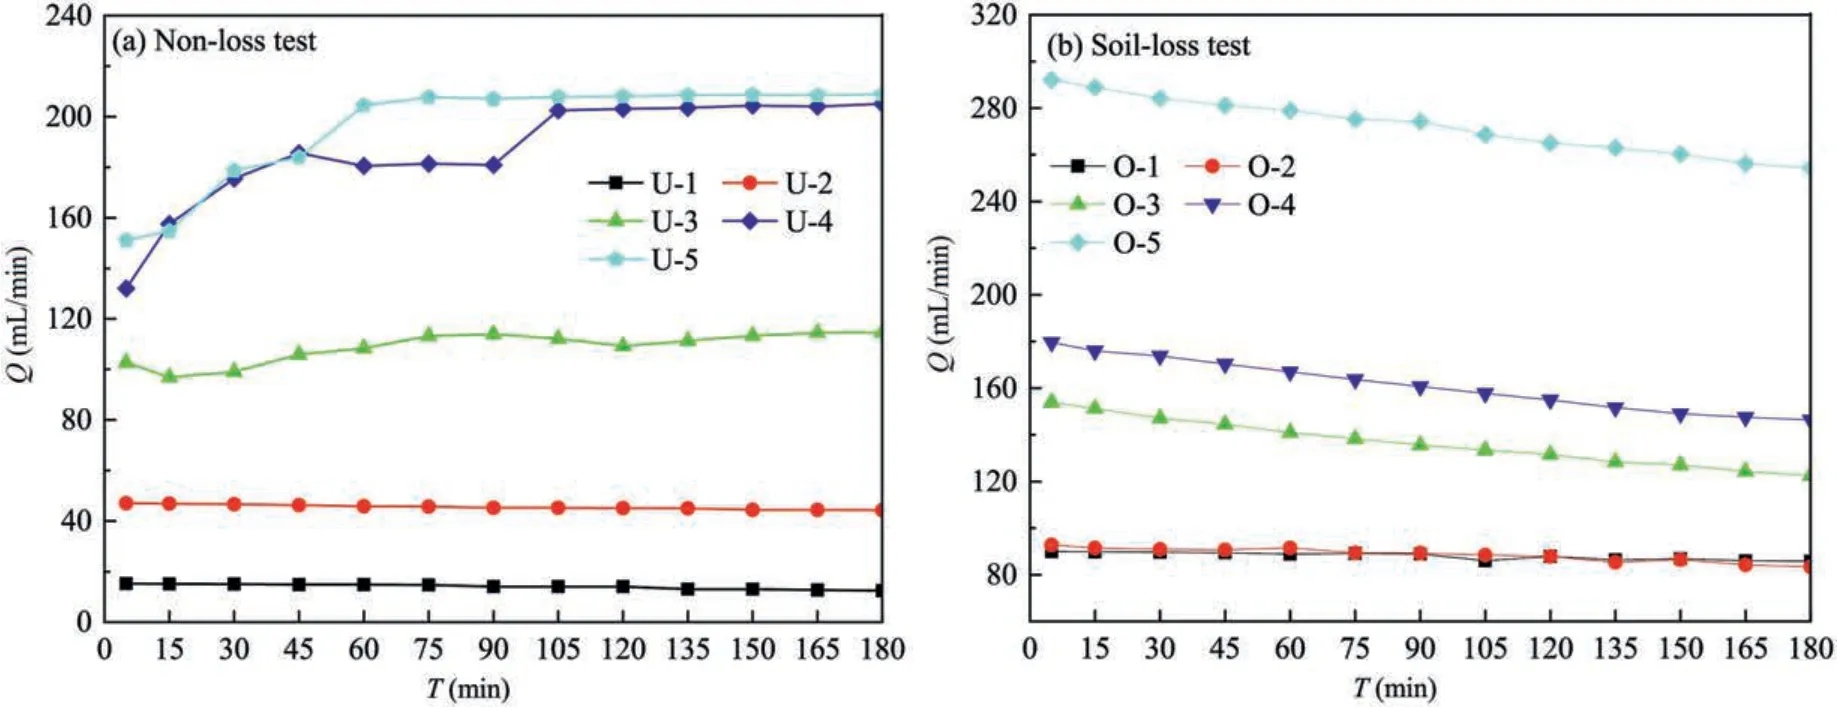
Fig.5.Variation in Q with T: (a) Non-loss test,and (b) Soil-loss test.

Table 4 Soil mass in each storeroom after the test.
3.2.Outflow rate
Fig.5 shows the change inQwith time(T),in which the variation tendency ofQdiffers with boundaries.In the non-loss test,the value ofQvaries from 15.2 mL/min to 12.4 mL/min and from 47 mL/min to 44.3 mL/min when ΔHis 300 mm or 450 mm,respectively,and the corresponding difference is only 2.8 mL/min and 2.7 mL/min.This phenomenon indicates the suffusion process is relatively gentle under the comprehensive effect of low ΔHand non-loss boundary generally.When ΔHis 600 mm,Qincreases from 102.7 mL/min to 114.6 mL/min with little fluctuation,reflecting the suffusion process enhances with increasing ΔH.When ΔHis 750 mm or 900 mm,Qincreases over time obviously first and then remains stable,and the corresponding increment is 73.1 mL/min and 57.8 mL/min,respectively,indicating that the suffusion process results in obvious variation in permeability of soils.
In the soil-loss test,all the values ofQare also larger than that in corresponding cases of non-loss test,indicating that the suffusion process is easier to develop under the soil-loss boundary compared with the non-loss boundary.When ΔHis 300 mm or 450 mm,the value and change inQare also small and the suffusion process is also relatively gentle.When ΔHis larger than 450 mm,Qdecreases near-linearly with the increasing ΔH.The value ofQis 154 mL/min,179.6 mL/min,and 292 mL/min at 5 min and decreases to 122.5 mL/min,146.4 mL/min,and 254.3 mL/min at 180 min when ΔHis 600 mm,750 mm,and 900 mm,respectively.
3.3.Water level
Fig.6 shows the observed water-level variations of the monitoring tubes(h)withTandLin Case U-5,whereLis defined as the distance away from the left side of storeroom S1.An additional round plate is set at the tail of horizontal cylinder preventing runoff of water before experiment.The water tank is slowly lifted to 900 mm before moving away the additional round plate,hence all the values ofhin the monitoring tubes are 900 mm at start time.

Fig.6.Variation in h in case U-5: (a) With T,and (b) With L.
Fig.6a shows thathdecreases first because the original voids may be occupied and even blocked by migrated fine sands,thenhrecovers because the blocked voids may open with the continuous scouring effect,andhincreases slowly indicating that the suffusion process tends to be steady.This phenomenon is also proved by some researches (Ke and Takahashi,2014a;Sibille et al.,2015;Rochim et al.,2017;Deng et al.,2020).The increasing velocity ofhslows after 105 min,indicating a steady suffusion process.For example,h7decreases from 605 mm at 5 min to 513 mm at 30 min,recovers to 593 mm at 105 min and then increases to 623 mm at 180 min.
Fig.6b shows that the relationship betweenhandLat 5 min and 45 min can be fitted linearly,indicating the permeability uniformly distributes.The variation rate ofhwithLincreases from 37.8% at 5 min to 48.9% at 45 min.With continuous suffusion,the linear correlation ofhandLweakens,and the distribution ofhafter 105 min can be divided into three parts.The slope ofhfrom storerooms S1to S3is larger than the slope from storerooms S3to S6,and the slope from storerooms S6to S7recovers.This phenomenon presents at 180 min,indicating the permeability is not uniformly distributed along the seepage path after suffusion.
Fig.7 shows the variation inhwithTandLin case O-5.Allhdecreases quickly in first 5 min because the soil-loss boundary allows both soil and water pass,thenhincreases gently with the increasingTafter 5 min (Fig.7a) since the continuous scouring effect.Due to the limitation of the monitoring tubes’ measuringrange where only value ofhover 100 mm can be measured,the value ofh7for the first 90 min which under 100 mm is not shown in Fig.7a.

Fig.7.Variation in h in case O-5: (a) With T,and (b) With L.
Fig.7b shows the relationship betweenhandLin case O-5.The relationship betweenhandLat 5 min can be fitted linearly with a slope of -1.066,indicating that the drawdown ofhis approximately 106.6 mm with each increase inLin 100 mm.This phenomenon indicates that although the local permeability of soil varies in the suffusion process,the general permeability of soil is also in accordance with the Darcy’law.With continuous suffusion,the variation rate ofhalongLdecreases withT,i.e.the permeability enhances gradually at the soil-loss boundary because the loss ofhin unitLdecreases.Furthermore,the local permeability of soil presents obvious difference after suffusion experiment.For example,the distribution ofhat 180 min can be divided into two parts.The fitting line slope from storerooms S1to S4is -0.907,while that from storerooms S5to S7is -1.092,indicating that the permeability of soil in storerooms S5to S7is larger than that in storerooms S1to S4after the soil-loss test.However,the phenomenon of local variation in permeability of soil under soil-loss boundary is not obvious compared with that under the non-loss boundary,which may be attributed to the accumulation degree of fine sand that is not strong.
3.4.Grading curve
The bolts connected two adjacent soil-storage chambers are released after the tests,and a very thin sheet iron is penetrated into the small gap formed by release to separate soil samples in each storeroom,then the grain size curves of the soil in each storeroom after the test is obtained.Fig.8 shows the grain size curves after the test in cases U-5 and O-5,where all grain size curves vary from the original curve(labeledSog),and the value of fine sand of each curve are listed to present the change in content of fine sand.Since each soil storeroom’s original curves before the test are very close,the curveSogis taken by the mixed sand before the corresponding test(Fig.2).The coarse particles are considered static,and the fine sand are considered movable.Hence,the migration and loss of fine sand cause different curves at different positions.Fig.8a shows that the curves of storerooms S6and S7shift up,reflecting the accumulation of fine sand after the non-loss test.The curves from storerooms S1and S5shift down,reflecting the dislodgement of fine sand,and the dislodged degree decreases along the seepage path before storeroom S5.
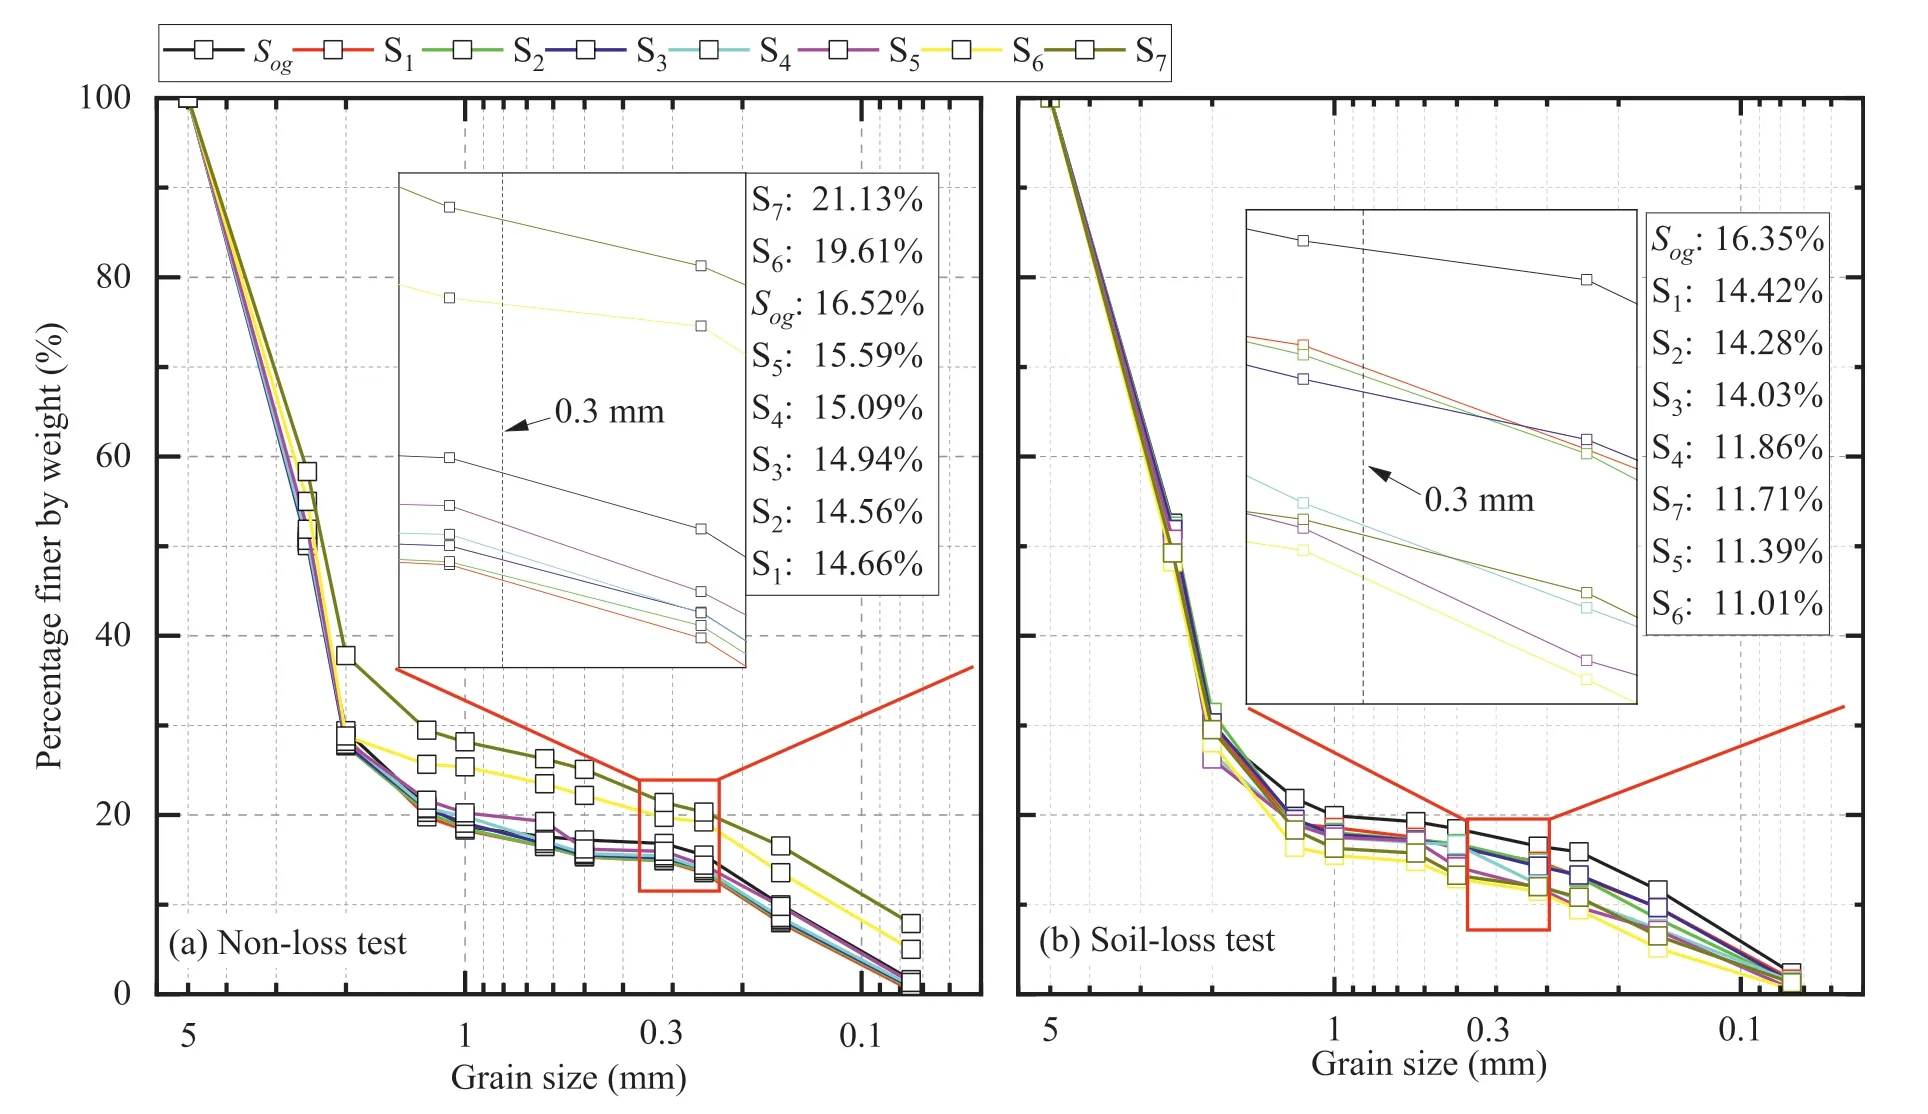
Fig.8.Grain composition after the test: (a) Case U-5,and (b) Case O-5.
Fig.8b shows that all curves shift down compared with theSog,indicating the dislodgment of fine sand after the soil-loss test.The dislodged degree of fine sand decreases slightly along the seepage path from storerooms S1to S6.It is worth mentioning that because the horizontal seam is at the middle height of the round section in storeroom S7,the fine sand at the lower semicircle cannot run off,and the dislodged degree of fine sand is smaller than that in storerooms S5and S6.Therefore,the dislodged boundary’s shape influences the dislodged degree of particles significantly,and this conclusion correlates with the research by Zhang et al.(2019).
4.Investigation on the permeability variation due to suffusion
Under different values of ΔH,the migration of fine sand results in nonuniform distribution inside the soil along the seepage path,influencing the permeability of sandy soil.The indices related to soil permeability,including the variation content of fine sand(labeled ΔRf)and change rate of hydraulic conductivity(labeledCi),will be analyzed below.The ΔRfat a specific position is defined as
whereis the content of fine sand after the non-loss or soil-loss tests at a specific position.These two parameters are obtained from the corresponding grading curve.The hydraulic conductivity of soils in each storeroom (labeledki) can be calculated using Darcy’s law,and the change rate ofki(labeledCi) is defined as
where Δhiis the difference in water levels in storeroom Si,and the water levels at both ends are calculated using linear interpolation of the observed data;Ais the seepage section area;ΔLiis each storeroom’s seepage length;andk′iis the hydraulic conductivity after the test.Since the hydraulic head at the inlet position of storeroom S1can be seen as a constant value,k1is calculated by the difference between the hydraulic head at the inlet and the average values ofh1andh2.
4.1.Non-loss boundary test
4.1.1.Investigation onΔRf
Fig.9 shows the variation in ΔRfwithLafter the non-loss test and all ΔRfincrease from negative to positive.According to the positive and negative values of ΔRf,three areas can be divided along the seepage path: runoff,transited,and accumulated.The runoff area with negative values of ΔRfranges from storerooms S1to S4,and the accumulated area with positive values of ΔRfincludes storerooms S6and S7.There should exist a value where ΔRftransfers from negative to positive value,and this point varies with different values of ΔH.By linear connection,all theX-coordinates of the point where ΔRfequals zero all locate in storeroom S5,and the values are 593.6 mm,588.6 mm,552.9 mm,566.6 mm and 567.7 mm when ΔHincreases from 300 mm to 900 mm.Storeroom S5is the transited area because the state of fine sand changes from the runoff condition to the accumulated condition in the non-loss test case.

Fig.9.Variation in ΔRf with L after non-loss test.
When ΔHis low(300 mm or 450 mm),all ΔRfvalues are smaller than 0.5%,indicating a slight migration degree of fine sand.Then,the distribution of ΔRfin the runoff area shifts down with the increasing ΔH,whereas the distribution of ΔRfin the accumulated area shifts up with the increasing ΔH.The minimal and maximal values of ΔRfoccur at storerooms S1and S7,where the loss and accumulated degree of particles are the most severe.The difference value of ΔRfbetween storerooms S1and S7increases from 0.39%to 6.5%when ΔHincreases from 300 mm to 900 mm,indicating that the migration degree of fine sand enhances with increasing ΔH.
Fig.10 shows the variation in ΔRfwith ΔH.The variation tendency of ΔRfin different areas significantly differ.When ΔHis low(300 mm or 450 mm),the ΔRfvalues in all storerooms are small,indicating that the movement of fine sand slightly influences the ΔRf.When ΔHis larger than 450 mm,ΔRfin the runoff and transited areas decreases,whereas that in the accumulated area increases with the increasing ΔH,and the variation of ΔRfin the transited area is smaller than that in the runoff area.For example,when ΔHincreases from 450 mm to 900 mm,ΔRfin storeroom S4of the runoff area approximately linearly decreased from -0.07%to-1.39%,ΔRfin storeroom S5of the transited area only decreased from-0.20%to-0.87%,and ΔRfin storeroom S6of the accumulated area increased from 0.29% to 2.91%.The corresponding variation rates of ΔRfin storerooms S4,S5and S6are -0.29%,-0.15% and 0.58%,respectively,with each increase in ΔHequal to 100 mm.
4.1.2.Investigation on Ci
Fig.11 shows the variation inkiwithTin case U-5.In the runoff area from storerooms S1to S4,kidecreases and then increases obviously with time,which can be caused by the rearrangement of fine sand first and the migration of fine sand next.The increasing degree ofkiat 180 min along the seepage path decreases,correlating with the values of ΔRffrom storerooms S1to S4.In the transited area,due to the accumulated particles from storeroom S1to S4,and the fine sand here could migrate to storerooms S6and S7,the variation ink5is small.Moreover,since the calculation process fromk4tok6involves the water-level value in the transited area S5,the variation also fluctuates little,and the variation degree is small.In the accumulated area of storeroom S7,k7increases due to the rebound ofh7values because of the boundary effect at the tail of storeroom S7.

Fig.11.Variation in ki with T in case U-5.
Fig.12 shows the distribution ofCiwithLafter non-loss test.When ΔHis low(300 mm or 450 mm),Cifluctuates withLbecause the suffusion degree is relatively small,and all the absolute values ofCiare smaller than 10%.In other tests with high ΔHvalues(from 600 mm to 900 mm),the variation inCialong the seepage path differs,decreasing from the runoff area to the transited area and rebounding in the accumulated area.From storerooms S1to S3,the values ofCiare large because of the loss of fine sand.The calculation process of the values fromC4toC6involves the data in the transited area S5;hence,all the values fromC4toC6are smaller than 10%.The rebound of water levelh7causes theC7rebound value in the accumulated area.For example,when ΔHis 900 mm,fine sand from storerooms S1to S4migrate to storerooms after,andCidecreases from 144.6% to 59.52%.From storerooms S4to S6,trough occurs as the values fromC4toC6are 8.46%,-3.96% and -5.08%,respectively.Due to the influence of the boundary effect mentioned above,C7is large,with a value of 114.53%.
4.2.Soil-loss boundary test
4.2.1.Investigation onΔRf
Fig.13 shows the variation in ΔRfwithLafter the soil-loss test,decreasing with the increasingLfrom storerooms S1to S6and recovering at storeroom S7.Since the soil-loss boundary allows fine sand to pass,all ΔRfvalues are negative,indicating that all the storerooms belong to the runoff area.According to the suffusion degree,three parts can be divided: the gentle-loss part from storerooms S1to S4,the strengthened-loss part from storerooms S5to S6,and the alleviated-loss part in storeroom S7.The gentle-loss part is far from the soil-loss boundary,and ΔRfdecreases slightly withL.The decrease in ΔRfin the strengthened-loss part is noticeable compared to that in the gentle-loss part.Since the horizontal seam is in the middle height of the round section and the fine sand at the lower semicircle in storeroom S7cannot run off,the value of ΔRfrebounds in the alleviated-loss part.

Fig.13.Variation in ΔRf with L after soil-loss test.
Fig.14 shows the variation in ΔRfwith ΔHafter the soil-loss test.In the gentle-loss part,ΔRfdecreases with the increasing ΔH,and all the absolute values are smaller than 3%,indicating that the dislodged degree and the influence of the soil-loss boundary are small.In the strengthened-loss part,ΔRfdecreases with the increasing ΔH,and the values are much smaller than in the gentle-loss part.All the minimal values of ΔRfoccur in storeroom S6,decreasing from-2.09%to-5.01%as ΔHincreases from 300 mm to 900 mm.In the alleviated-loss part,the fine sand at the lower semicircle cannot run off due to the horizontal seam’s limitation.Although ΔRfdecreases with the increasing ΔH,the values of ΔRfin storeroom S7decrease from -1.45% to -4.51% as ΔHincreases from 300 mm to 900 mm,of which the change value of ΔRfis the largest in all the storerooms.
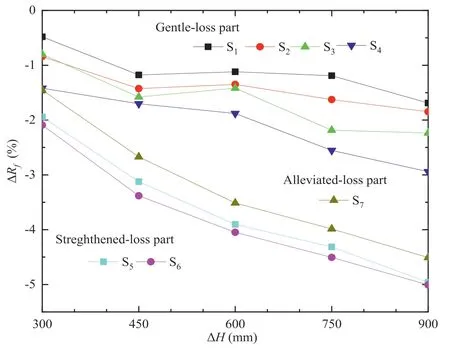
Fig.14.Variation in ΔRf with ΔH after soil-loss test.
4.2.2.Investigation on Ci
Fig.15 shows the variations inkiwithTin case O-5.In the gentleloss part,kifluctuates withT,and the value at 180 min increases because of the dislodged particles.Tang et al.(2023)proposed that a dense filtering area could occur around the leakage boundary because of the local clogging phenomenon;hence,the soil permeability around the soil-loss boundary might decrease.The variation inkiin the strengthened-loss part decreases withT.Although the observed data in storeroom S7only started from 90 min because of the monitoring range limitation,the decreasing degree ofk7in the alleviated-loss part is more noticeable than that in the strengthened-loss part.

Fig.15.Variation in ki with T in case O-5.
Fig.16 shows the distribution ofCiwith L after the soil-loss test,and there is a lack of observed data in storeroom S7.All values ofCiincrease and then decrease along the seepage path.In the gentleloss part,the maximal value occurs atC2orC3,and values atC1orC4are small.In the strengthened-loss part,Cidecreases with the increasingL,indicating that the soil-loss boundary’s influence increases closer to the boundary.

Fig.16.Distribution of Ci with L after soil-loss test.
5.Discussion on the effect of the boundary condition
5.1.Comparison of ΔRf
Fig.17 compares the ΔRfbetween the non-loss and soil-loss boundaries.The tendency of ΔRfcan be classified into two types according to the variation tendency of ΔRf: the similar-effect area from storerooms S1to S5and the reverse-effect area from storerooms S6to S7.The variation tendency of ΔRfin the similar-effect area both decreases with the increasing ΔHunder the non-loss and soil-loss boundaries.Moreover,the differences in ΔRfin the same storeroom under the non-loss and soil-loss boundaries(labeledRns) increase withL.For example,the value ofRnsis -0.26%,-0.04%,0.63%,1.55% and 4.19%,respectively,from storerooms S1to S5when ΔHis 900 mm,indicating that the boundary’s influence enhances gradually.

Fig.17.Comparison of ΔRf between non-loss and soil-loss tests.
In the reverse-effect area,the variation tendency of ΔRfowns opposite variations,where ΔRfincreases with ΔHunder the nonloss boundary and decreases with ΔHunder the soil-loss boundary.This phenomenon means that the boundary condition changes the suffusion mode of fine sand inside coarse matrix particles in storerooms S6and S7.For example,Rnsincreases from 1.55% to 9.07% in storerooms S7when ΔHincreases from 300 to 900 mm,much larger thanRnsin other storerooms.Liang et al.(2022)found out about 4.55% of fine sand dislodged in horizontal seepage test under soil-loss boundary,where the boundary is holes with a diameter of 0.075 mm distributed uniformly in cross-section.There is a slight difference between the values with 3.31%in the case O-5 because of the different soil-loss boundary.
5.2.Comparison of Ci
Fig.18 compares theCibetween the non-loss and soil-loss tests.Unlike the influence of the boundary condition on ΔRf,the similareffect area from storerooms S1to S3and the reverse-effect area from storerooms S4to S7are divided.In the similar-effect area,the variation tendency ofCiincreases with the increasing ΔH,where the increase under the non-loss test is noticeable,whereas the increase under the soil-loss test fluctuates.The value ofCiin the nonloss test varies from -10.65% to 144.6%,whereasCivaries from -16.07% to 7.23% in the soil-loss test.This phenomenon means that the suffusion process primarily enhances the local seepage ability of soil from storerooms S1to S3in the non-loss test,whereas the local seepage ability in the soil-loss test is mostly weakened.

Fig.18.Comparison of Ci between non-loss and soil-loss tests.
In the reverse-effect area,the variation tendency ofCidiffers in the non-loss and soil-loss tests.In the non-loss test,theCivalue is small and increases and then decreases with ΔHdue to the accumulated fine sand from the storerooms before and migrated particles to the storerooms behind.However,due to the data lack ofC5andC6when ΔHis 300 mm and 450 mm,only a part of the variation tendency ofCiin the soil-loss test is presented.The value ofCiin the soil-loss test decreases first and then increases when ΔHincreases from 600 mm to 900 mm.Since the clogging phenomenon around the horizontal seam of storeroom S7is more severe than in other cases,the decrease inQresults in a smaller absolute value ofCiwhen ΔHis 900 mm.Due to the data lack,C7in the soil-loss test cannot be present,indicating the same tendency asC6in the soilloss test because of the local clogging phenomenon around the horizontal seam.Deng et al.(2020)studied the variation inkialong seepage path in horizontal seepage under soil-loss test,where the result accord with the tendency that the minimum value ofCioccurs at middle position along seepage path and maximum value ofCioccurs at position closed to soil-loss boundary.
5.3.Relationship between ΔRf and Ci
Fig.19 shows the relationship between ΔRfandCiin the non-loss and soil-loss tests.Due to the boundary effect in the non-loss boundary test,ΔRfin storeroom S7and data ofC7in the non-loss test are eliminated.The value ofCican be fitted using the exponential function (Fig.19a),whereCidecreases with the increasing ΔRf.When ΔHis relatively low(300 mm or 450 mm),theCivalues concentrate on the area around the origin,indicating that the suffusion process and the permeability variation are small.Other values are distributed on both sides of the fitting line,and the permeability variation increases with the increasing ΔH.By this equation,the value of ΔRfcan predictCi.
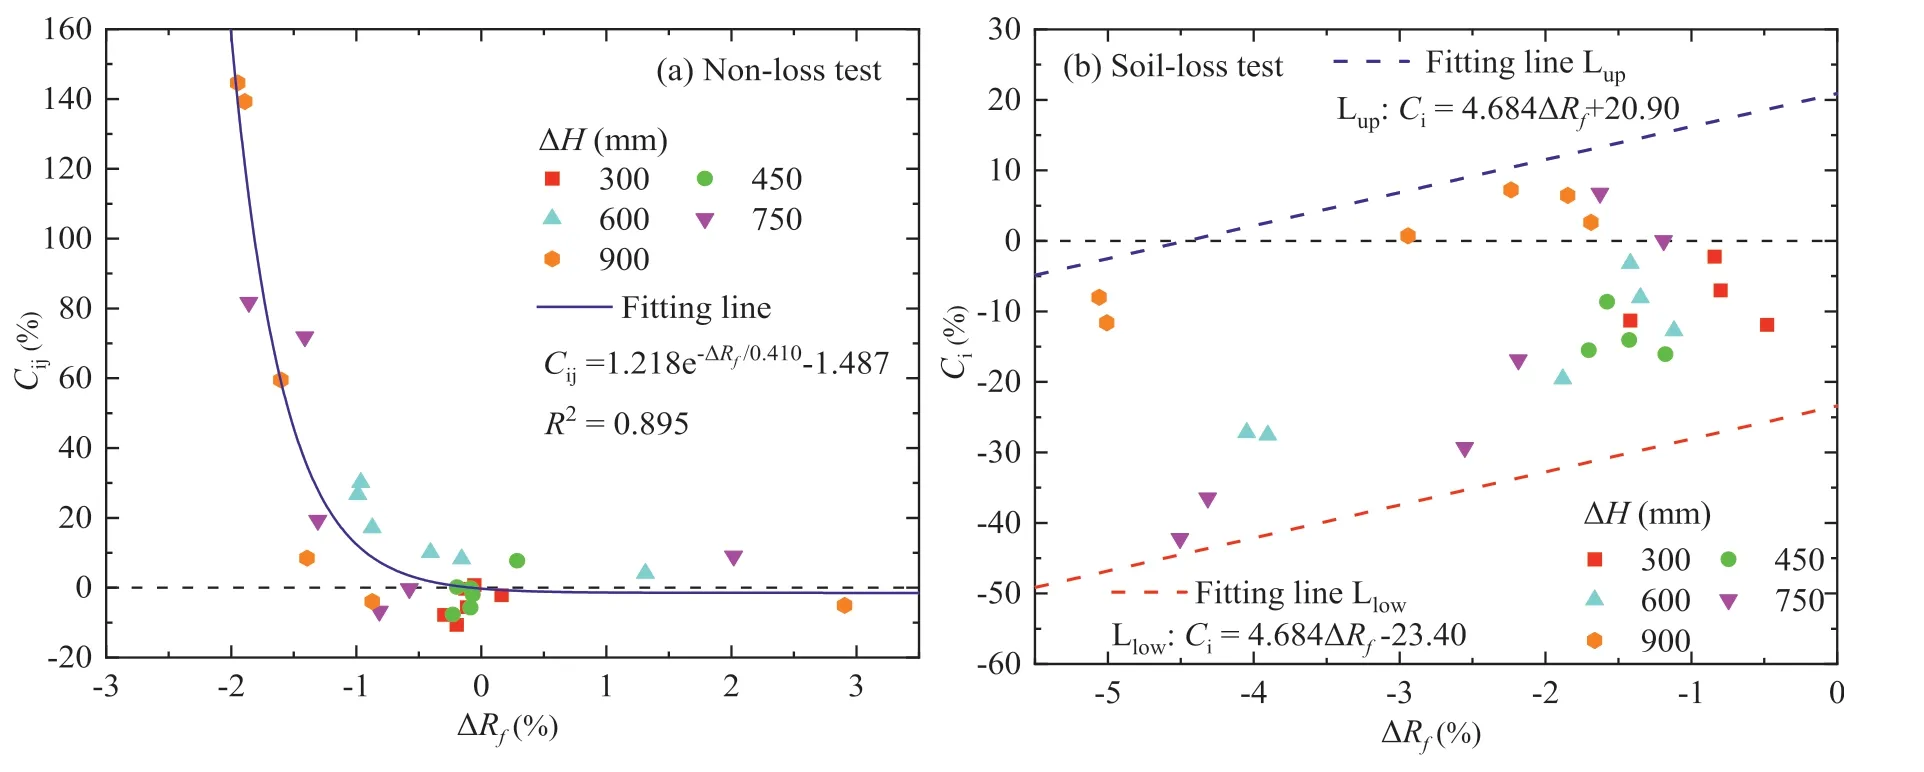
Fig.19.Relationship between ΔRf and Ci: (a) Non-loss test,and (b) Soil-loss test.
In the soil-loss boundary test,the variation tendency ofCidiffers from that in the non-loss boundary test,indicating that the boundary condition significantly affects the soil permeability.Fig.19b shows that the value ofCiincreases with the increase in ΔRf,and the scatters ofCidistribute concentratedly in an area limited by two parallel lines.The parallel lines’ slopes are obtained using the least squares method,obtaining the area with a 95% prediction band,of which the upper and lower bound lines can be obtained.The equation of the upper and lower bound lines can predict the upper and lower values ofCiusing the value of ΔRf.
6.Conclusions
This study conducted a horizontal experiment with non-loss and soil-loss boundaries to analyze the permeability variation of gap-graded soil after suffusion.The change content of fine sand(ΔRf) and change rate of hydraulic conductivity of soils in each storeroom (Ci) are analyzed after soil-loss and non-loss tests,respectively.The following conclusions are obtained:
(1) The experiment apparatus includes a water tank,a horizontal cylinder,water-level monitoring tubes,and a water-collect box.Soil samples are filled into seven soil storerooms(labeled from S1to S7from upstream to downstream).A round plate with a filter screen or horizontal seam controls the non-loss or soil-loss boundaries.The hydraulic head difference(ΔH) varies during suffusion.
(2) In the non-loss test,the soil sample filling areas along the seepage path are divided into the runoff area(storerooms S1to S4),the transited area(storeroom S5),and the accumulated area (storerooms S6to S7) according to the negative or positive values of ΔRf.Cidecreases from the runoff area to the transited area and rebounds in the accumulated area.
(3) In the soil-loss test,all soil sample filling areas are in the runoff area,where the gentle-loss part(storerooms S1to S4),the strengthened-loss part (storerooms S5to S6),and the alleviated-loss part (storeroom S7) are further divided according to the loss degree of fine sand.Ciincreases and then decreases along the seepage path.
(4) Comparing the results of ΔRfandCiin the non-loss and soilloss tests,similar-effect and reverse-effect areas due to the boundary condition can be divided.The ΔRfandCipresent similar variation tendencies in the corresponding similareffect area and transfer to the opposite tendency in the reverse-effect area.
(5) The relationship betweenCiand ΔRfdiffers with the boundary condition.Ciexponentially decreases with the increasing ΔRfin the non-loss test,whereasCidistributes in a bond zone limited by two parallel lines in the soil-loss test.
Declaration of competing interest
The authors declare that they have no known competing financial interests or personal relationships that could have appeared to influence the work reported in this paper.
Acknowledgments
The research work described herein was funded by the National Nature Science Foundation of China (Grant No.41877213).This financial support is gratefully acknowledged.
杂志排行
Journal of Rock Mechanics and Geotechnical Engineering的其它文章
- Limit load and failure mechanisms of a vertical Hoek-Brown rock slope
- Limit state analysis of rigid retaining structures against seismically induced passive failure in heterogeneous soils
- Bearing capacity of circular footings on multi-layered sand-waste tire shreds reinforced with geogrids
- Damage constitutive model of lunar soil simulant geopolymer under impact loading
- Wetting-drying effect on the strength and microstructure of cementphosphogypsum stabilized soils
- A novel relationship between elastic modulus and void ratio associated with principal stress for coral calcareous sand
