SDH-FCOS:An Efficient Neural Network for Defect Detection in Urban Underground Pipelines
2024-03-12BinZhouBoLiWenfeiLanCongwenTianandWeiYao
Bin Zhou,Bo Li,Wenfei Lan,Congwen Tian and Wei Yao
College of Computer Science,South-Central Minzu University,Wuhan,430074,China
ABSTRACT Urban underground pipelines are an important infrastructure in cities,and timely investigation of problems in underground pipelines can help ensure the normal operation of cities.Owing to the growing demand for defect detection in urban underground pipelines,this study developed an improved defect detection method for urban underground pipelines based on fully convolutional one-stage object detector (FCOS),called spatial pyramid pooling-fast (SPPF) feature fusion and dual detection heads based on FCOS (SDH-FCOS) model.This study improved the feature fusion component of the model network based on FCOS,introduced an SPPF network structure behind the last output feature layer of the backbone network,fused the local and global features,added a top-down path to accelerate the circulation of shallow information,and enriched the semantic information acquired by shallow features.The ability of the model to detect objects with multiple morphologies was strengthened by introducing dual detection heads.The experimental results using an open dataset of underground pipes show that the proposed SDH-FCOS model can recognize underground pipe defects more accurately;the average accuracy was improved by 2.7%compared with the original FCOS model,reducing the leakage rate to a large extent and achieving real-time detection.Also,our model achieved a good trade-off between accuracy and speed compared with other mainstream methods.This proved the effectiveness of the proposed model.
KEYWORDS Urban underground pipelines;defect detection;SDH-FCOS;feature fusion;SPPF;dual detection heads
1 Introduction
As the infrastructure of the city,the underground pipelines play an important role in the development of a city.They are used to discharge industrial wastewater and domestic sewage,which maintains the operation of the city and guarantees the safety of the urban environment.During extreme weather conditions,such as heavy rainfall,they are used to discharge accumulated rainwater promptly,thus avoiding the loss of life and property in urban areas.However,owing to factors such as the unscientific initial design of some underground pipelines,the future construction costs of underground pipelines invested in by government administrations are high [1,2].In addition,underground pipelines are not maintained regularly,and coupled with long years of use and changes in environmental conditions,they may become defective,leading to urban sewage overflows and pipeline operational failures[3],which can have a serious impact on the development of the cities[4].If defects in urban underground pipelines are not investigated in time,they will cause significant harm to the city,such as environmental pollution and disease transmission[5],negatively impacting the lives and properties of urban residents.Therefore,there is an urgent need for cities to improve their ability to investigate and repair underground pipelines.Traditionally,professional pipeline inspectors are trained to identify underground pipeline defects.However,the results of this approach are less than ideal,and the inspection process is costly and time-consuming.Dirksen et al.[6]found that inspectors are unable to visually determine underground pipeline defects in 25%of cases.To identify the defects of urban underground pipelines more comprehensively without human bias,automated detection technology is necessary.It is important to strengthen the improvement of detection technology and equipment,continuously reduce the labor cost of management,and improve the intelligent level of defect detection of underground pipelines.Due to the complexity of the environment where underground pipelines are located,image acquisition is difficult,and various types of defects are extremely uneven,causing challenges to the detection of pipeline defects.Fig.1 shows various types of defects in underground pipelines.
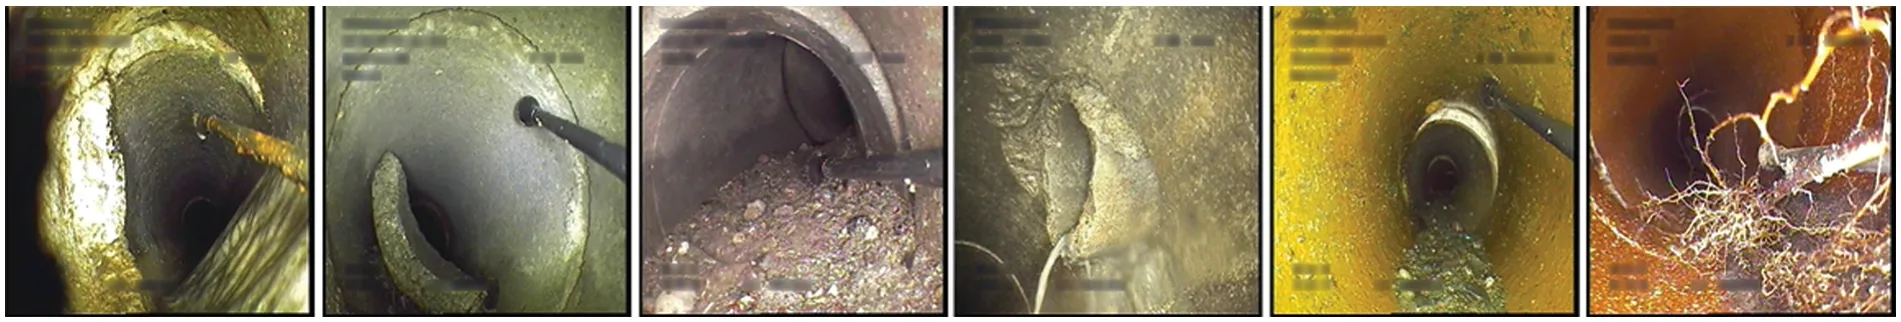
Figure 1:Photos of underground pipe defects
This work aims to automate the identification of defects in urban underground pipelines to efficiently maintain the normal operation of underground pipeline facilities.In this work,an improved one-stage object detection algorithm is used to analyze the images of underground pipelines and then identify pipeline defects in the images.In this way,the safety risks associated with manual inspection can be avoided,the misjudgment of manual inspection images can be reduced,and the pipeline defects can be recognized with higher accuracy.
This paper developed an improved detection method based on fully convolutional one-stage object detector (FCOS) [7],referred to as spatial pyramid pooling-fast (SPPF) [8] feature fusion and dual detection heads based on FCOS (SDH-FCOS).It can serve the urban management bureau and it is expected to play an important role in urban underground pipeline monitoring systems.The main contributions of this study are as follows:
• This study introduced an SPPF network into the original FCOS architecture to better extract the rich fine-grained features from pipeline defect images by enhancing network feature extraction,strengthening the fusion of multidimensional features,and realizing multiscale receptive fields.In addition,a top-down path was added to combine shallow and deep features and accelerate the flow of shallow information such that the network can extract more available feature information,thus strengthening its characterization capability.
• Considering the characteristics of morphological and scale variabilities of defective targets in underground pipelines,this study,designed a dual detection head,instead of a single detection head,in the original model based on the FCOS model.This effectively separates the prediction of feature layers of various scales without raising the computational volume of the model and makes the model more adaptable to the detection of objects with variable scales,thereby improving the accuracy of model identification.
• This study built a dataset containing 1013 images of underground pipeline defects based on the Sewer-ML[9]public dataset for labeling.Based on the urban underground pipeline dataset used in the experiment,the proposed SDH-FCOS was found more effective in recognizing pipeline defects compared with current mainstream object detection models.Our method achieves a good trade-off between accuracy and speed with the 3060Ti,which can effectively reduce the leakage rate and achieve real-time detection and has high potential for underground pipeline defect detection.
2 Related Work
The structure of urban underground pipelines is complex.Defect identification by pipeline inspectors is inefficient and significantly affected by the state of the inspectors.To achieve efficient and accurate detection,researchers are actively seeking alternatives to manual inspection for identifying defects in underground pipelines.Recently,defect detection in underground pipelines based on machine vision has gradually been applied in industry.
Since the 1950s,extensive research has been conducted on underground pipeline defect detection.Traditional underground pipeline detection technologies include closed circuit television(CCTV)[10],laser[11],and ultrasonic[12].These detection methods typically use robots to capture pipeline images[13] or to reconstruct pipeline images to identify defects in underground pipelines.Stani´c et al.[14]reconstructed an underground pipeline image by scanning the inner wall of the pipeline with a laser profiler,which can provide accurate and reliable three-dimensional images for the detection of underground pipeline defects.This type of traditional detection technology requires remote personnel to identify the defects in a pipeline according to the transmitted images;however,manual identification of pipeline defects is inefficient and has a high false detection rate.Recently,technology based on computer vision has been used to identify and automatically interpret underground pipeline defects.Huynh et al.[15]proposed a sewer-pipe anomaly detection system based on stereovision,which realized stereovision through three steps,namely,calibration,correction,and matching,combined with the double-edge evaluation and constrained sliding window algorithms to achieve high efficiency and accuracy.However,this computer vision-based detection method requires considerable preprocessing and the design of a complicated feature extractor to extract the image features.Preprocessing requires considerable time and cost.In addition,it is difficult to solve the impact of illumination and shooting distance[16].
As convolutional neural networks (CNN) [17] are increasingly applied in the field of image classification,many researchers have focused on object detection.Anchor-based[18]detection models,for example,the two-stage detection networks Fast R-CNN [19] and Faster R-CNN [20],generate a large number of candidate regions before prediction,and then classify and regress these regions.Cheng et al.[21] proposed for the first time the use of Faster R-CNN technology for defect detection in CCTV pipeline images,and experiments showed that this method could accurately identify sewer pipe defects.Li et al.[22]proposed a pipeline defect detection model based on a twostage detection network,and a strengthened candidate region extraction network(SRPN).They used multilayer global feature fusion technology to improve detection accuracy and shorten detection time.Zhou et al.[23] proposed a deep neural network based on attention and feature selection,which can improve the feature extraction capability of the network by further feature selection.A series of detection methods such as SSD [24],YOLOv2 [25],and EfficientDet [26] eliminate the process of generating proposals,which significantly improves the detection speed,and the networks are designed to be more lightweight.A lightweight deep neural network was proposed based on recurrent learning,which employed a feature compression strategy to reduce the number of parameters of the model[27].Currently,with the increasing in-depth research on anchor-free[28]object detection algorithms,the DETR [29] model uses a transformer [30] to directly predict the extracted features of the backbone network and thoroughly realizes end-to-end.YOLOX[31]classifies and regresses each feature point in its output.These models do not require the generation of a specific anchor size to complete the regression task and can achieve high detection accuracy.However,due to the complexity of the environment in which urban underground pipelines are located,the application of these methods in this scenario is limited,and they need to be further improved in terms of detection accuracy and real-time.
The model proposed in this paper solves the problem of low accuracy in recognizing defects in the complex background of underground pipes.The experiments show that compared with the current mainstream models,our proposed model has higher detection accuracy in underground pipeline datasets,and is more suitable to be applied to the defect detection of underground pipelines.
3 Methods
In this section,the proposed SDH-FCOS detection method is introduced.First,we briefly describe the network structure of the FCOS and review the basic idea of FCOS.Finally,we discuss the network structure of the SDH-FCOS and its algorithmic ideas in detail.
3.1 The Basic Principle of FCOS
FCOS is an anchor-free-based one-stage object-detection model developed by Tian et al.in 2019.Fig.2 shows the model architecture of the FCOS.Its feature extraction module mainly contains two networks: ResNet [32] and feature pyramid network (FPN) [33].ResNet initially extracts features and outputs feature layers C3,C4,and C5 at different scales with down-sampling rates of 8,16,and 32,respectively.The FPN fuses the features extracted by the backbone.C5 and P5 denote the same feature layer;P5 is sequentially up-sampled to fuse with feature maps P4 and P3,and then sequentially down-sampled to get feature maps P6 and P7.The FPN combines features of different scales by fusing high-semantic features,thus retaining more semantic information,and then outputs five feature maps:P3,P4,P5,P6,and P7,each of which is passed into a detector head network with shared parameters.The model prediction consists of three branches: classification,center-ness,and regression.The subnetwork of classification predicts the target category for these incoming feature maps,the center-ness branch outputs the offset from the center of the sample point to the center of the prediction box,and the regression branch predicts the position information in the prediction box.
FCOS uses a new prediction box regression approach.For those feature points on a feature map,a four-dimensional vectort∗is used as a target for the position of the point.During the training process,a positive sample point(x,y)is related to the ground-truth boxBi.The regression target for this point can be expressed as:
where,and,indicate the positions of the upper left and lower right corners of the ground-truth boxBi,respectively,andx-x0(i),y-y0(i),x1(i)-x,andy1(i)-ydenote the distances of this point to the four boundaries of the ground-truth box.The regression branch moves the predicted box closer to the location of the ground-truth box by predicting the distances from the feature point to the four boundaries of the predicted box,with the ground-truth box matched to that point as the target.

Figure 2:Network architecture of FCOS
In addition,FCOS usescenter-nessto evaluate the quality of the predicted box,which is a new type of location quality estimation(LQE)that describes the normalized distance from the location of a sample point to the center of its regression target.The target ofcenter-nessis defined as follows:
wheremin(.)andmax(.)indicate the maximum and minimum values to be sought,respectively,andl∗,t∗,r∗,andb∗represent the regression objectives of the feature points.In training the model,the classification subnetwork uses focal loss[34]to compute the loss,whereas the regression and centerness subnetworks useGIoUloss[35]and cross-entropy loss[36],respectively,to calculate the loss.The three types of losses are defined as follows:
where Eq.(3) calculates the focal loss,αtis used to balance the number of positive and negative samples,γis the modulation factor,andptindicates the probability of the classification predicted by the model.Eq.(4)defines theGIoUloss,IoUis the intersection and concatenation ratio between the bounding and ground-truth boxes.Acanduare the areas of the smallest outer bounding rectangle and concatenation of the bounding and ground-truth boxes,respectively.Eq.(5)defines the cross-entropy loss,withCrepresenting the number of categories,andyi∈(0,1)andp(xi)representing the labels and probabilities of the categories predicted by the model,respectively.Combining Eqs.(3)–(5)calculates the total loss:
whereNposindicates the number of positive samples.1{0}is an indicator,which is 1 whenC>0 and 0,otherwise.The sum of losses is computed at all positionszof the feature pyramid.
3.2 Network Structure of SDH-FCOS
This study developed a method for defect detection in urban underground pipelines called SDHFCOS.Fig.3 shows the network architecture of the SDH-FCOS model.Firstly,the sample is input into the backbone network,which extracts three effective feature layers and inputs them into the FPN,which outputs five feature layers through feature fusion.Finally,each feature layer is input into the detection head to predict the result,including the number of categories,center-ness,and regression position.In contrast to the FCOS network structure,this paper added the SPPF network behind output layer C5 of the backbone,which can be used to fuse fine-grained features at several different locations.In addition,this paper improved the FPN structure of the FCOS by adding a path for top-down feature fusion so that the shallow network could obtain richer information.Finally,we adopted a dual-detection header strategy to predict each of the five feature layers of the FPN output,in which feature layers P5,P6,and P7 were input into Head 1,whereas feature layers P3 and P4 were input into Head 2.By combining these three methods into the FCOS network,it could be observed a notable enhancement in the detection capability of the SDH-FCOS model.In the following sections,we describe the details of each module and their roles.
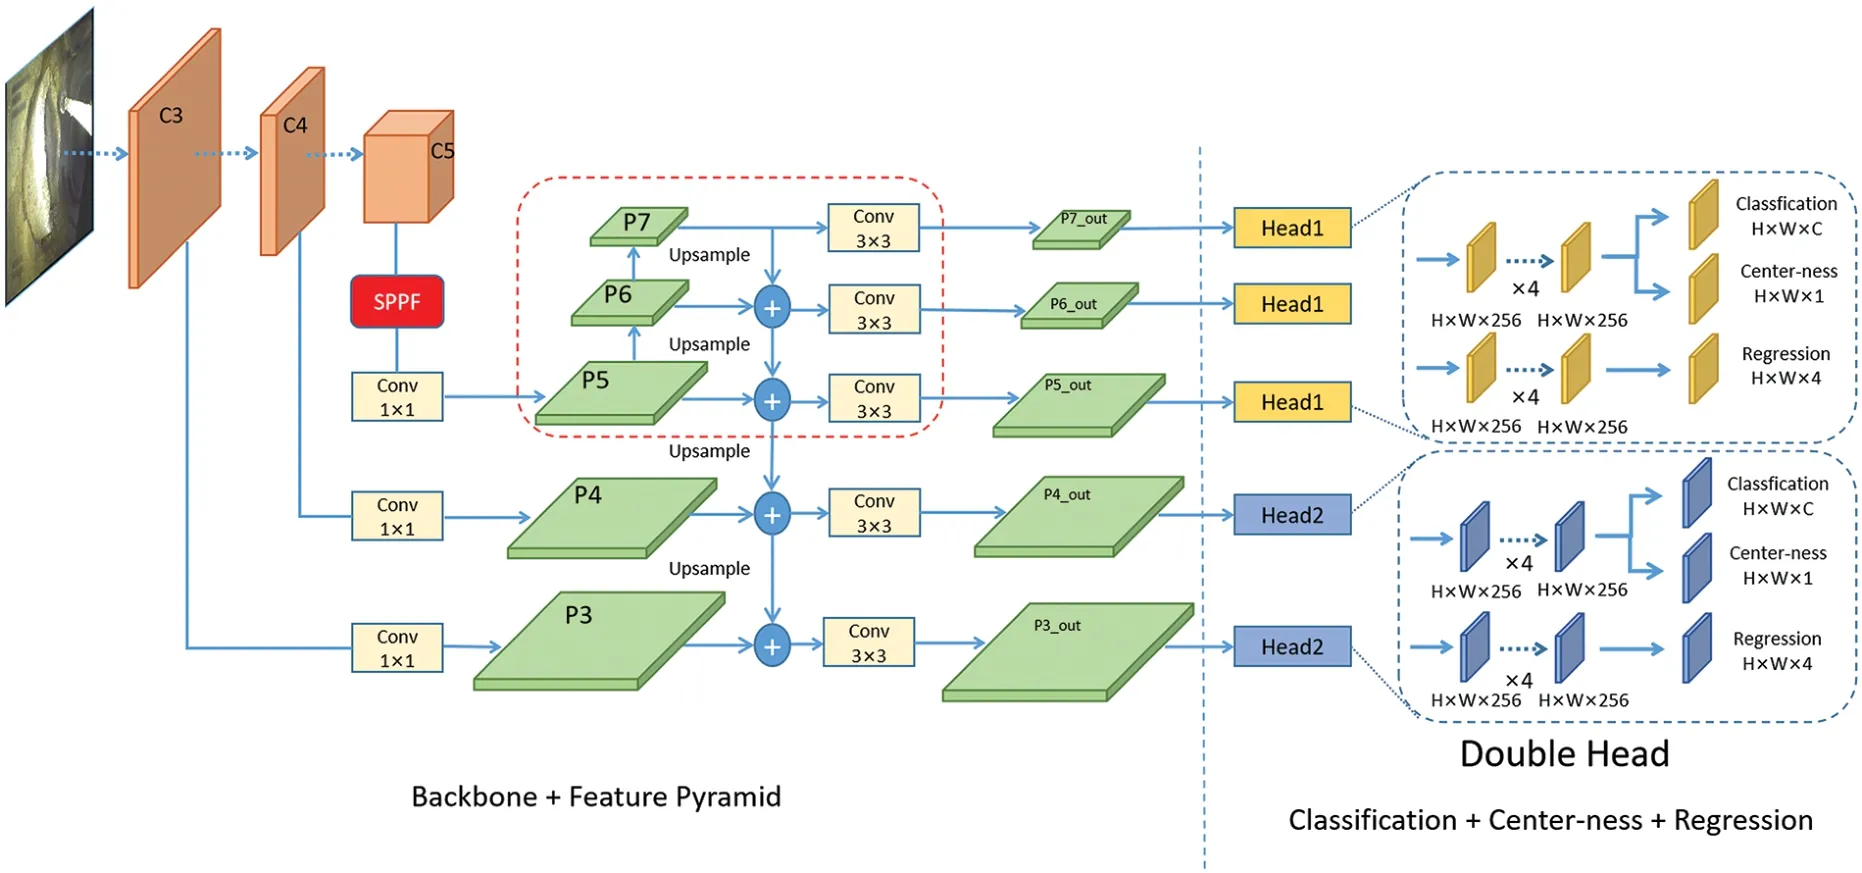
Figure 3:Proposed SDH-FCOS network
3.3 Introduction of the SPPF Module
Defective structures of urban underground pipelines are generally highly complex,and multiple defects may overlap in a defective region.Thus,this study used an SPPF network to enhance the extraction of features and strengthen the model for the detection of defective edge locations.This can effectively reduce the impact caused by too many defective overlapping regions and improve the model’s ability to identify complex pipeline defects.SPPF is a spatial pyramid pooling method proposed in YOLOv5[8]and is different from the spatial pyramid pooling(SPP)[37]network,which only pools the feature map once and then stitches it together;it uses the method of cascading multiple pooling kernels of the same size to obtain different dimensions of the pipeline defects,such that it can fuse fine-grained features at different locations,and the number of parameters can be drastically reduced compared to the SPP network.Fig.4 shows the network architecture of SPPF.
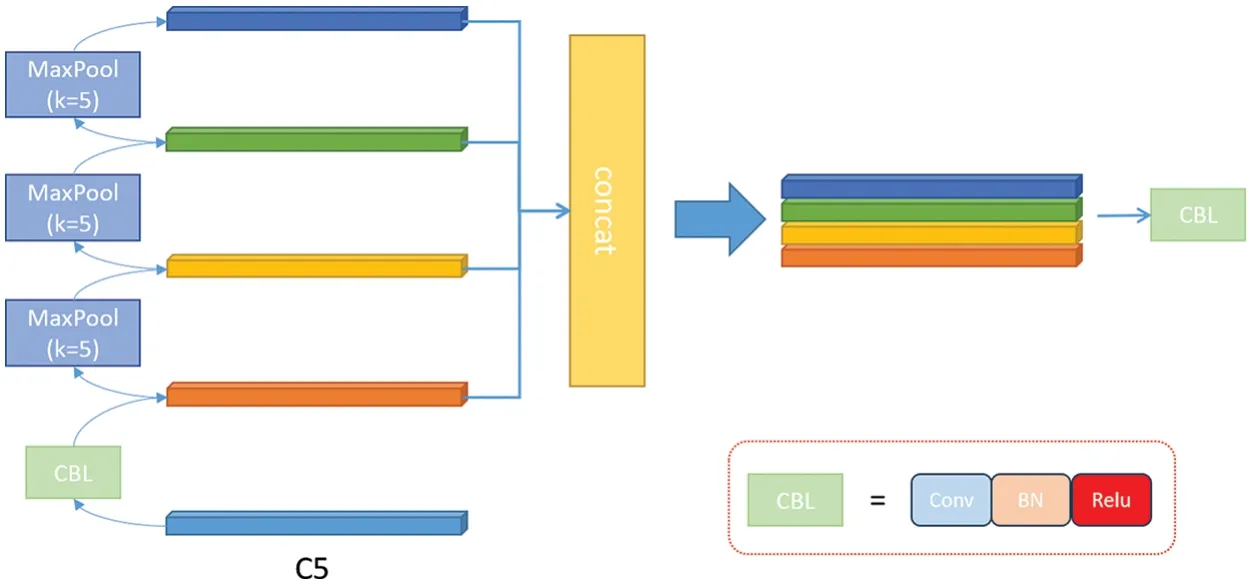
Figure 4:Structure of the SPPF network
The feature layer C5 is input into the SPPF module,and CBL halves the number of channels of the feature map,which effectively reduces the computation of the subsequent operations.Then,the largest pooling layer with a pooling kernel size of 5 is passed in turn,and the feature map obtained by pooling at each time is spliced with that obtained after the previous convolution.Thus,the quantity of channels in the spliced feature map is four times the quantity of channels in the feature map obtained after convolution,which contains rich information.Finally,the semantic information of multiple channels is integrated through the CBL module.
3.4 Improved FPN Multiscale Feature Fusion Approach
FCOS uses ResNet to initially extract the feature information in the sample image and fuses the information of shallow and deep features through an FPN.The main role of FPN is to enhance the model’s capability to detect objects at various scales:the deep network feature maps are smaller and rich in semantic information but less in geometric and localization information,whereas the shallow network feature maps are larger and contain a large amount of geometric information,which allows for accurate localization of the target location.The FPN structure of FCOS has five feature layers of outputs,which are used for the recognition of large and small objects,and top-down fusion of information between feature maps of different scales through up-sampling,which passes each layer of the network,from the semantically information-rich top layer to the bottom layer.This combines the information of each layer and strengthens the network’s capability to recognize objects of different scales.
The FPN of the original FCOS fuses the information between the three feature layers.To further enrich the semantic information acquired by the bottom features,this study improved on the FPN by adding a top-down path,which better utilizes the semantic information of the deeper features,optimizes the fusion of the information between the top-to-bottom layers,and strengthens the model’s capability of recognizing objects of different scales,thus improving the detection performance of the model.As indicated by a red box in Fig.3,P5 was sequentially down-sampled to obtain effective feature layers P6 and P7,followed by top-down layer-by-layer up-sampling and fusion with the bottom feature layer.Each feature layer was outputted using a 3×3 convolution,and the equations for the improved FPN in feature layers P5,P6,and P7 are as follows:
3.5 Dual Detection Head Prediction
FCOS uses a shared-parameter detection head network to predict the five feature layers of the FPN input,each of which undergoes four 3×3 convolutions and then realizes classification,centrality,and regression through decoupling.This method separates classification and regression into two branches,which can effectively reduce the influence between two different tasks,thus enhancing the detection performance.
The morphology of various defects in urban underground pipeline datasets is variable,and each feature layer of different scales in the original FCOS model goes through the same detection head to obtain the final prediction results,which is unfavorable for the detection of objects with different morphologies.The computation amount of the detection head network is directly proportional to the number of feature layers;therefore,this approach does not reduce the computation amount of the model and affects the prediction of the network.To optimize the FCOS detector head network structure and further improve the network’s effectiveness in detecting underground pipe defects,this study adopted dual detector heads to replace the single detector heads of the original model.The feature layers of different scales were passed into the corresponding detector head network for prediction,which effectively separated the prediction of the model for the feature layers at various scales,thus improving the recognition effect of the model on multimorphic objects.In the FPN structure,feature layers P6 and P7 were obtained by successive downsampling of feature layer P5,and feature layer P3 was the result of the fusion of feature layer P4 with feature layer C3 through upsampling;therefore,there was a large amount of similar information in feature layers P5,P6,and P7,and feature layers P3 and P4 contained a lot of common information.Therefore,feature layers P5,P6,and P7 were passed to the same detector head to get the prediction result,and feature layers P3 and P4 were passed to another detector head to get the prediction result,and the prediction process of the improved detector head network for each feature layer of the input can be expressed as follows:
wherePjdenotes each valid feature layer of the input andHidenotes the weight of the detection head corresponding to the feature layer.
4 Experiments and Analysis of Results
4.1 Dataset and Experimental Environment
4.1.1 Sources of Data-Sets
The experimental data in this paper were obtained from the Sewer-ML public dataset,which contained a total of 1.3 million sample images of pipeline defects and 17 defect categories.At the beginning of the image collection process,we found that the categories of the underground pipe defect samples were extremely uneven,and some images of pipe defect types accounted for less than 0.1%of the total images,which made our research work extremely difficult.In addition,too few sample images had substantial impacts on the training of the model.This paper chose six pipeline defects,which accounted for a relatively large number,as the experimental samples,which were PH(concealed connection),AF (deposition),FS (misalignment),BE (scaling),RO (root),and FO (obstacle),as shown in Fig.5,and for each of them,the defect codes were derived from the literature[9]and 1013 images were labeled as experimental data using the labeling tool.
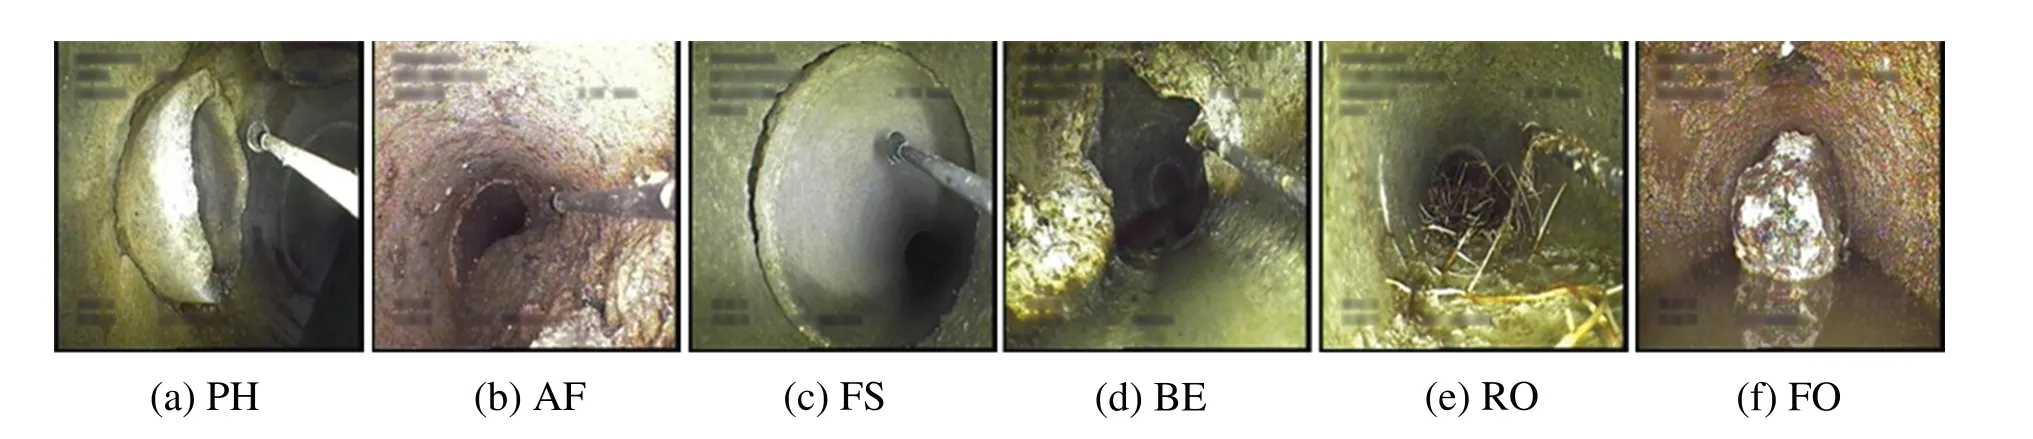
Figure 5:Sample images of defects in the dataset
4.1.2 Data Preprocessing
The number of defective samples in the dataset used in this study was small;therefore,an experiment was performed to augment the various defective data.First,the original dataset was randomly divided into five;then,one of them was randomly selected as the test dataset,and the remaining samples were augmented through horizontal and vertical flipping,as shown in Fig.6,where the augmented data were divided into validation and training datasets at a ratio of 2:8.Linearly enhanced samples have richer data volumes,which could strengthen the generalization capability of the model.
Owing to the influence of environmental factors,defective images of underground pipelines have low brightness and contrast,which makes it difficult to distinguish defective locations from the surrounding background.Therefore,before each round of training,hue saturation value (HSV)transformation and random cropping data enhancement were performed on the training dataset,as shown in Fig.6.By randomly adjusting the brightness and saturation of the images,regions with weak contrast were enhanced,which strengthened the model’s ability to recognize pipeline defects under different luminance conditions,and thus strengthening the robustness of the model.

Figure 6:Some examples of data enhancement
4.1.3 Experimental Environment and Parameter Settings
The experimental environment mainly included a 64-bit Windows 10 operating system,16 GB RAM,Intel i5-12400F CPU,and NVIDIA GeForce RTX 3060Ti GPU.The code running environment was Python 3.8 under the Pycharm platform,based on PyTorch and CUDA 11.3 deep learning framework.In this experiment,only the pretraining weights of the backbone network of the model on the ImageNet-1K dataset were loaded.The initial learning rate in the training phase was set to 0.001 with a momentum of 0.9,using a step-learning rate decay strategy,which reduced the learning rate every 20 rounds of iteration.Adam was used as the optimizer,and the number of iteration rounds was 200.To speed up the model training,the first 50 rounds froze the backbone with a batch size of 8,and the last 150 rounds trained the entire network with a batch size of 4.
4.2 Evaluation Indicators
Common evaluation metrics for object detection include the intersection and integration ratio(IoU),Precison,Recall,average precision(AP),and the mean of average precision(mAP).
IoUdenotes the ratio of the intersection and concatenation of the areas of two regions,which is used to measure the degree of overlap of the regions and is defined as follows:
whereBGandBPimply the areas of the ground truth and predicted boxes,respectively.The value ofIoUlies between 0 and 1;the larger its value,the larger the overlapping area,and vice versa.
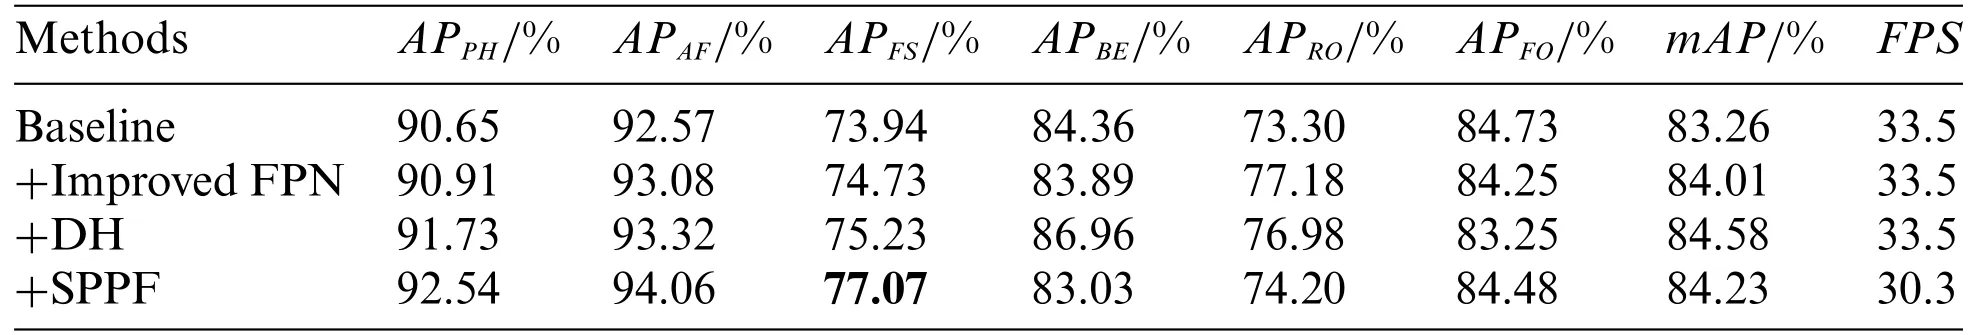
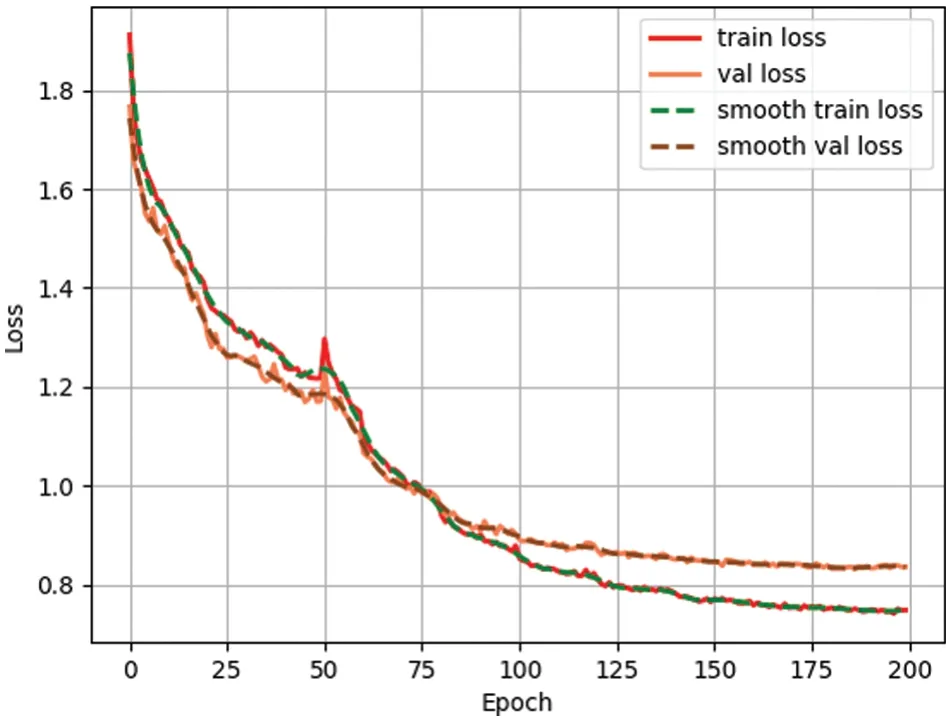
In this study,the object detection model must identify the pipe defective and background locations and then binary classify the region of the samples.Thus,there were four different results:TP,FN,FP,andTN.TPindicates the number of positive samples predicted to be positive cases,andFNdenotes the number of positive samples predicted to be negative cases.Samples that satisfy the conditionIoU≥thresholdare called positive samples.FPindicates the number of negative samples predicted to be positive cases,andTNindicates the number of negative samples predicted to be negative cases,where samples that satisfy the conditionIoU Precisonimplies the ratio of rightly predicted samples out of total samples predicted as positive andRecallimplies the ratio of rightly predicted samples out of total positive samples,as defined in Eqs.(12)and(13): APindicates the average value ofPrecision,as described in Eq.(14): wherePandRindicate thePrecisonandRecall,respectively.mAPcan be obtained by calculating the mean of the sum ofAPfor each category,as described in Eq.(15): whereCindicates the number of categories.As there were six categories of underground pipe defects in the experimental data,it was necessary to determine theAPfor each category and calculate the value ofmAP. This paper measured the real-time detection of the model in terms of frames transmitted per second on the screen,which was calculated as follows: whereframeTimedenotes the time required to process one frame. 4.3.1 Comparison of Different Detection Algorithms In terms of the underground pipeline defect detection capability,this study compared the improved algorithm with existing mainstream object detection models,including Anchor-based and Anchor-free models,and the results are listed in Table 1.APPHis the average precision for concealed connection defects,APAFis the average precision for deposition defects,APFSis the average precision for misalignment defects,APBEis the average precision for scaling defects,APROis the average precision for root defects,APFOis the average precision for obstacle defects,mAPindicates the detection capability of the model,andFPSis the number of frames processed per second.Table 1 shows that the proposed SDH-FCOS model satisfied the requirements for real-time detection and achieved great accuracy in identifying the defect categories for each pipeline.mAPreached 85.96%,which was higher than that of the Faster R-CNN,YOLOv4,RetinaNet,CenterNet,and YOLOX models(7.49%,2.98%,3.23%,9.59%,and 1.68%,respectively). Table 1: Performance comparison of the various detection algorithms To further verify that the proposed detection method can better recognize pipe defects,this paper compared the recall and precision of several detection algorithms listed in Table 1 for each defect category,as shown in Fig.7.As can be observed in Figs.7a and 7b,in terms of the detection performance for each defect category,the Faster R-CNN model had a high recall and lowest precision,whereas CenterNet had the lowest recall and high precision,indicating that the detection capability of these two models was not satisfactory.The two detection models,YOLOv4 and RetinaNet,achieved better recognition but failed to balance recall and precision.The YOLOX model achieved high recall and precision values,and the detection effect was more satisfactory.In contrast,the proposed SDHFCOS detection model was more balanced in terms of recall and precision and achieved higher values.This shows that compared to the other object detection models,the detection algorithm proposed in this study had a higher feature extraction capability and more accurately identified the locations and classes of defects. Figure 7:Comparison of recall and precision of detection algorithms for six pipe defects Fig.8 shows the detection capabilities of the various detection models on the defective underground pipe images.Fig.8a shows the position of the ground-truth box in the image.Fig.8b shows that the Faster R-CNN model generated redundant bounding boxes during the detection process and had a leakage and high false detection rate,indicating that the model is less effective in recognizing pipe defects.Figs.8c and 8d show that detection models YOLOv4 and RetinaNet were more effective;however,they both misclassified the deposition defects as root defects,and the YOLOv4 model failed to detect root defects.Fig.8e shows that the CenterNet model failed to recognize either type of defect–misalignment or root and generated redundant bounding boxes when identifying obstacle defects,which were also poorly detected.Fig.8f shows that the bounding box generated by the YOLOX model was of high quality and mostly covered the defective regions;however,the leakage rate was high.It failed to identify the two types of defects,deposition and misalignment,and incorrectly classified the concealed connection defects as obstacle defects,and its detection effect was less satisfactory.Fig.8g shows that the SDH-FCOS model correctly identified the various classes of defects,and the generated bounding box correctly located and classified the defects.The graph showing the capabilities of the various object detection models indicates that YOLOv4 and RetinaNet models had better detection than Faster-RCNN and CenterNet models;however,the accuracy of the prediction box was not high.The bounding box predicted by the YOLOX model had high accuracy but failed to detect all pipe defects.The detection accuracy and classification capability of the proposed SDH-FCOS model were significantly higher than the other detection models,indicating that it can extract more fine-grained features and is more capable of recognizing defects in underground pipelines. Figure 8: (Continued) 4.3.2 Ablation Experiment To validate the availability of each module added to the FCOS model,experiments were accomplished by sequentially adding the improved modules,and a series of ablation experiments were conducted.The experimental results are shown in Table 2,where the baseline represents the FCOS detection method.The detectedmAPwas only 83.26%.ThemAPenhancement after adding the improved FPN module was 0.75%.ThemAPenhancement after adding the dual detection head module was 1.32%.ThemAPenhancement after adding the SPPF module was 0.97%.ThemAPenhancement after adding the improved FPN and dual detection head modules was 1.87%and that after fusing the three modules was 2.7%.Compared with the baseline,the improved FCOS model increased the time overhead in the detection process;however,the impact on the model detection time was small.The addition of the detection head module did not magnify the computational volume of the model and did not affect its real-time performance,indicating that the detection performance of the FCOS model significantly improved. Table 2: Model ablation experiments Fig.9 shows the detection capability of the improved and original FCOS algorithms on underground pipe defects.It can be observed from the figure that all algorithms detected both concealed connection and deposition defects,whereas the location identified by the improved FCOS algorithm was closer to that of the ground-truth bounding box.Fig.9a shows the position of the ground-truth box in the image.Fig.9b shows that the FCOS model failed to recognize both types of defects–misalignment and scaling and misclassified the root defects as misalignment defects.Fig.9c shows that after improving the FPN structure,the model could recognize misalignment defects.Fig.9d shows that after the introduction of the SPPF network,the model was able to recognize misalignment and root defects,but failed to recognize scaling defects.It detected the background as a defect when detecting deposition defects.Fig.9e shows that after the introduction of the dual detection head,the model was able to recognize misalignment defects but still failed to recognize both types of defects:scaling and root.Fig.9f shows that after improving the FPN structure and introducing the dual detection head,the model could identify all types of defects,but was not accurate in localizing the root defects.In contrast,as shown in Fig.9g,the SDH-FCOS model correctly identified all types and locations of defects more accurately,thereby reducing leakage and false detection. To validate the detection capability of the SDH-FCOS model on objects of different scales,the detection capabilities of the original FCOS and SDH-FCOS models were compared using the test dataset,as shown in Fig.10,where the first and last three columns denote small-scale and largescale objects,respectively.The figure shows that for small-scale objects,the FCOS model did not effectively detect the defects in the image,and the leakage rate was high,whereas the SDH-FCOS model accurately identified the location of pipe defects,and the detection performance was better.For large-scale objects,the FCOS model identified the location of pipe defects;however,it misclassified the categories of pipe defects in some cases,and the false detection rate was high.By contrast,the SDH-FCOS model accurately identified the categories of defects,and the localization of the predicted bounding box was more accurate.This shows that contrasted with the original FCOS model,the proposed SDH-FCOS model has better detection ability for objects of different scales and potential for defect detection in urban underground pipelines. Figure 10:Comparison between FCOS and SDH-FCOS models for detection of objects at different scales 4.3.3 Convergence Analysis of the Model The changes in training and validation losses during the training of the SDH-FCOS model are shown in Fig.11,where the x-axis denotes the number of rounds of training,and the y-axis denotes the value of the loss;we enhanced the smoothness of the curves.For the training and validation loss curves,the decreasing loss in the first 100 rounds was more pronounced,and the convergence speed was faster.After 150 rounds,the loss tended to stabilize,and the model achieved convergence.Fig.11 shows that the SDH-FCOS model can be trained well on an underground pipeline dataset without overfitting. Figure 11:Convergence curves of the SDH-FCOS model using the underground pipeline dataset This study developed an automated method for the detection of pipeline defects based on the FCOS model to improve the defect-detection efficiency of urban underground pipelines.In this study,three improved modules were developed,and the experimental results show that each module added to the original FCOS model improved the detection efficiency.The highest detection performance was achieved when the three modules were integrated into the FCOS model simultaneously,with an mAP reaching 85.96%,indicating the effectiveness of each module.Compared with the current mainstream model,our SDH-FCOS model can effectively reduce the leakage rate and false detection rate under the premise of real-time detection.Nonetheless,there are limitations to the study in this paper because the dataset does not contain pipeline defects that are very few in number,and the inference speed of the improved model is reduced.In future research,the dataset can continue to be expanded and the parameters of the model can be more lightweight.In addition,many novel data enhancement strategies can be used to increase the number of pipeline defect samples that are very small in number.With these research results,pipeline defects can be efficiently detected in the urban underground pipeline industrial scenarios. Acknowledgement:The authors are very grateful to the members of the team for their efforts in designing the experiments and enhancing the paper. Funding Statement:This work was supported by the National Natural Science Foundation of China under Grant No.61976226 and the Research and Academic Team of South-Central Minzu University under Grant No.KTZ20050. Author Contributions:The authors confirm contribution to the paper as follows: study conception and design:Bin Zhou,Bo Li;data collection:Bin Zhou,Congwen Tian;analysis and interpretation of results:Bo Li,Bin Zhou,Wenfei Lan,Wei Yao;draft manuscript preparation:Bin Zhou,Bo Li.All authors reviewed the results and approved the final version of the manuscript. Availability of Data and Materials:The authors confirm that the data supporting the findings of this study are available within the paper. Conflicts of Interest:The authors declare that they have no conflicts of interest to report regarding the present study.4.3 Analysis of Experimental Results


5 Conclusion
杂志排行

Computers Materials&Continua的其它文章
- Structured Multi-Head Attention Stock Index Prediction Method Based Adaptive Public Opinion Sentiment Vector
- Intelligent Solution System for Cloud Security Based on Equity Distribution:Model and Algorithms
- A Hybrid Model for Improving Software Cost Estimation in Global Software Development
- Real-Time Detection and Instance Segmentation of Strawberry in Unstructured Environment
- Leveraging Augmented Reality,Semantic-Segmentation,and VANETs for Enhanced Driver’s Safety Assistance
- Improving Video Watermarking through Galois Field GF(24)Multiplication Tables with Diverse Irreducible Polynomials and Adaptive Techniques