Structured Multi-Head Attention Stock Index Prediction Method Based Adaptive Public Opinion Sentiment Vector
2024-03-12ChengZhaoZhePengXuefengLanYuefengCenandZuxinWang
Cheng Zhao ,Zhe Peng ,Xuefeng Lan ,Yuefeng Cen and Zuxin Wang
1School of Economics,Zhejiang University of Technology,Hangzhou,China
2College of Management,Zhejiang University of Technology,Hangzhou,China
3Informatization Office,Zhejiang University of Technology,Hangzhou,China
4School of Information and Electronic Engineering,Zhejiang University of Science&Technology,Hangzhou,China
5School of Economics and Management,Universiti Putra Malaysia,Daerah Petaling,Negeri Selangor,Malaysia
ABSTRACT The present study examines the impact of short-term public opinion sentiment on the secondary market,with a focus on the potential for such sentiment to cause dramatic stock price fluctuations and increase investment risk.The quantification of investment sentiment indicators and the persistent analysis of their impact has been a complex and significant area of research.In this paper,a structured multi-head attention stock index prediction method based adaptive public opinion sentiment vector is proposed.The proposed method utilizes an innovative approach to transform numerous investor comments on social platforms over time into public opinion sentiment vectors expressing complex sentiments.It then analyzes the continuous impact of these vectors on the market through the use of aggregating techniques and public opinion data via a structured multi-head attention mechanism.The experimental results demonstrate that the public opinion sentiment vector can provide more comprehensive feedback on market sentiment than traditional sentiment polarity analysis.Furthermore,the multi-head attention mechanism is shown to improve prediction accuracy through attention convergence on each type of input information separately.The mean absolute percentage error(MAPE)of the proposed method is 0.463%,a reduction of 0.294%compared to the benchmark attention algorithm.Additionally,the market backtesting results indicate that the return was 24.560%,an improvement of 8.202% compared to the benchmark algorithm.These results suggest that the market trading strategy based on this method has the potential to improve trading profits.
KEYWORDS Public opinion sentiment;structured multi-head attention;stock index prediction;deep learning
1 Introduction
As an essential component of the financial market,the stock market has long been a subject of interest for research scholars and studies.It is widely believed that the stock market can be predicted[1] and that individuals who are adept at handling information are at an advantage when it comes to stock market investment [2,3].With the rise of the internet,many investors use the information available on the internet to research the stock market,such as reading others’comments or expressing their opinions.It is noted that individual investors tend to express themselves more emotionally than institutional investors when posting information.This susceptibility to market sentiment and the tendency to trade more frequently and intensively,particularly in secondary markets such as the Chinese stock market,where individual investors predominate,is a crucial factor in short-term market volatility[4].Understanding market sentiment in stock market forecasting[5]can help mitigate risks in extreme situations.
Transforming investor commentary corpus into sentiment polarity and integrating it with market indicators to analyze financial market trends has become an active area of research[6,7].However,the traditional sentiment polarity analysis method is challenged in effectively representing the complexity of sentiment through a single dimension.Additionally,it fails to consider the holistic nature of investor comments and cannot comprehensively reflect the significant influence of public opinion on the market.For instance,it only considers sentiment scores as sentiment polarity for stock market prediction without considering the holistic nature of public opinion [8].The attention mechanism,the most advanced time-series analysis method[9],is increasingly used by researchers in stock market predictions that incorporate sentiment factors because of its advantage of assigning different weights to different features to obtain essential elements[10].However,the heterogeneous type and complexity of the data,which contains both sentiment and market data,degrades the attention aggregation performance and does not fully utilize the data.
Therefore,this paper proposes a method for transforming investor comments into a sentiment vector,which is then combined with the heat in the investor market to form a public opinion sentiment vector.This vector effectively expresses the complexity of market sentiment.Additionally,a multi-head attention mechanism based on adaptive data distribution is employed,with different heads generating different attention convergence to extract information on sentiment and technology simultaneously and separately.This mechanism is used to capture the continuous influence of input data and improve stock index prediction accuracy.
In summary,the contributions of this paper are as follows:
(1) We constructed a public opinion sentiment vector indicator based on investor comments and investor enthusiasm in the investor market,effectively reflecting the direction of public opinion sentiment in the market.
(2) We developed a structured multi-head attention stock index prediction method based on an adaptive public opinion sentiment vector.This method utilizes the multi-head attention mechanism as a stock index prediction method,which is combined with the public opinion sentiment vector for stock index prediction.
(3) We evaluated the proposed method against traditional forecasting models to demonstrate its forecasting ability,and its performance in the real market is demonstrated through backtesting.
The rest of the paper is organized as follows.Section 2 describes the related work and the current state of research.Section 3 describes the method proposed in this paper in detail.Section 4 shows the experimental results and discusses the results.Section 5 summarizes the results of this paper and outlines future work.
2 Literature Review
In recent years,the advancement of machine learning and deep learning techniques has led to an increasing number of research studies that focus on the prediction of stock markets through a combination of investor sentiment and market indicators.Additionally,researchers have introduced attention mechanisms as a means to concentrate on the input vector more effectively.This section will review the literature and findings of these two components in the related research field.
2.1 Analysis of Public Opinion Sentiment in the Financial Market
Obtaining information from online news sources has gained significant attention in recent years.A considerable body of literature on stock market research utilizes news sentiment or investor sentiment as a means of prediction.For example,Chen et al.[11]extracted Latent Dirichlet Allocation(LDA)features and sentiment features as content features and technical indicators by selecting official accounts on Sina Weibo,improving stock prediction accuracy.Carosia et al.[12]conducted sentiment analysis in Brazilian Portuguese and verified the correlation of the main sentiment of financial news in Brazil using the Granger causality test to customize investment strategies based on sentiment analysis.They experimentally concluded that there is an interaction between news sentiment and stock market movements.Li et al.[13] combined different sentiment dictionaries to construct news sentiment and technical indicators for stock market prediction and investigated the ability of sentiment vectors to contain more complex information.The above literature demonstrates the effectiveness of news sentiment indicators for predicting the stock market,but pure news sentiment cannot intuitively represent the market sentiment.Gao et al.[14] studied the importance of investor sentiment in maintaining stability and reducing the volatility of the green stock market.Lu et al.[15] proposed an early warning system that models and signals stock market danger using market indicators and a mixture of macro and micro investor sentiment and analysis that investor sentiment informs the prediction of stock market crises.Broadstock et al.[16] investigated whether intraday stock returns are influenced by sentiment in financial markets.Their study demonstrated that the price movements of stocks are susceptible to the impact of sentiment pricing factors on social media.This literature examines the effect of investor sentiment on social media stock market forecasts.
The above research results are primarily based on micro-linguistic analysis and lack a macro perspective of public opinion.Additionally,research on public opinion-based methods is still relatively scarce,and the tools used in these studies still require improvement.Derakhshan et al.[17]demonstrated the significance of market opinion by presenting a lexical graphical model to extract users’sentiments and then utilizing these sentiments to identify stock market purchase indicators.This study underscores the potential of market opinion as a valuable tool in the analysis of stock market trends.Luo et al.[18] constructed a low-dimensional sentiment space model that extended the traditional sentiment polarity to a sentiment space,arguing that the construction of a sentiment space could improve the efficiency of sentiment classification modeling.Ni et al.[19]proposed a stock market evaluation system based on public opinion,using sentiment and institutional judgment scores to construct a public opinion sentiment score,which is considered a macro view of public opinion.However,the current literature lacks information to capture changes in public opinion over time.Inspired by the above literature,this paper highlights the varying degrees of importance of different influential posts with respect to their effect on public opinion,which,in turn,influences market sentiment based on the level of investor activity.This paper proposes using a public opinion sentiment vector that focuses on corpus importance,daily reading popularity,and public opinion activity to represent the impact of public opinion on stock market prediction.This vector captures the dynamic changes in public opinion over time and provides a more comprehensive representation of market sentiment.
2.2 Prediction Based on Attention Mechanism
An attention mechanism is a powerful tool that enables neural networks to select key information from a given set of inputs by calculating the attention probability distribution,thus allowing the network to focus on the most relevant information and achieve optimal model performance.In recent years,with ongoing research by scholars,the attention mechanism has been applied to a wide range of scenarios,and there are numerous papers in the area of stock market prediction that utilize the attention mechanism to optimize prediction performance by focusing on relevant input indicators.
Several studies have highlighted the advantages of attention mechanisms in their ability to capture data effectively.Researchers have leveraged the combination of different algorithms,such as convolutional neural networks (CNN) and long short-term memory (LSTM),to make predictions about the stock market[20–23].The attention mechanism is particularly effective for time-series data processing,but it is not designed to analyze heterogeneous data.In 2017,Vaswani et al.[24]proposed the Transformer model,which utilizes multi-head attention to converge features at different levels.This model provides a powerful tool for analyzing heterogeneous data and has shown to be effective in various natural language processing tasks.Abbasimehr et al.[25]introduced the multi-head attention mechanism into temporal data prediction and compared the method’s performance with some standard temporal prediction techniques,showing the capability of the multi-head attention mechanism in temporal prediction,but not yet structured grouping of metrics.An et al.[26] proposed using a multi-head attention mechanism,which combines global feature representation and the correlation strength between individual characters to improve the performance of Chinese clinical named entity recognition.This method converges characters with multi-level semantic feature information,thus improving performance.Wang et al.[27] employed multi-head attention to combining multimodal entity information derived from both images and text and confirmed the effectiveness of the feature fusion technique in prediction tasks through multi-head attention.Abbasimehr et al.[28] utilized multi-head attention to forecasting the spread of COVID-19 and confirmed that this approach could be used for both short-and long-term predictions of time-series data.Zhang et al.[29] used a multi-head attention fusion network to converge three different modalities of speech coding,text coding,and facial modal coding,demonstrating the potential of multi-head attention mechanisms to deal with heterogeneous data and find the similarity of different modal features.However,the aggregation ability of multi-head attention has yet to be applied to the stock market to combine sentiment indicators.In this paper,the aggregation capabilities of the multi-head attention mechanism are leveraged to merge public opinion sentiment vectors and stock market technical indicators into separate heads for aggregation through a structured approach.A structured multi-head attention model is utilized to concentrate on the varying impacts of public opinion factors and stock market technical factors,thereby facilitating a focus on the current impact of public opinion and enhancing forecasting accuracy.
3 Structured Multi-Head Attention Stock Index Prediction Method Based Adaptive Public Opinion Sentiment Vector
The proposed hybrid method in this paper is illustrated in Fig.1,which consists of three modules:data collection and pre-processing,public opinion sentiment analysis,and multi-head attention stock index prediction method.The data collection and pre-processing module pre-process the stock index technical indicators and investor comments.The public opinion sentiment analysis module performs public opinion sentiment analysis on the investor comment corpus and generates a public opinion sentiment vector.The multi-head attention stock prediction method module utilizes a structured multihead attention stock prediction method based on an adaptive public opinion sentiment vector for predicting the stock market price trend.
3.1 Data Collection and Pre-Processing
3.1.1 Investor Comments
When commenting on Internet forums,investors tend to post their views on the broad market index.The text data selected for this study is derived from investor commentary data in the Shanghai Stock Exchange(SSE)stock bar on Oriental Fortune,a platform for investors to gather and post their comments and one of the largest stock market exchange forums in China.To ensure the purity of the forum’s discussion topics,the administrator regularly removes content that is not related to investment.This dataset includes three variables:reading popularity,investor comment text,and posting time.The reading popularity reflects the number of clicks and reads each post has received from other investors.The investor comment text represents the title of each post,and the posting time signifies the time at which the post was made.The structural information of the dataset is illustrated in Table 1.
After data cleaning and removing invalid data (such as symbols,numbers,expressions,etc.)from the investor comments used in this paper,the text is segmented into individual Chinese words,punctuation marks,etc.The segmented elements are encoded by a text tokenizer,and the token of these elements is transformed into a tensor that can be used for training and becomes a vector that the input model can recognize.
3.1.2 Technical Indicators
This paper’s data for the technical factors used are derived from JoinQuant.Ten technical indicators are mainly selected,and the specific indicators and their meanings are illustrated in Table 2.The first ten indicators in the table are for experimental use,and the last four are explanatory.Additionally,the information on these indicators is subjected to maximum-minimum normalization.
Table 2: Technical indicators
3.2 Public Opinion Sentiment Analysis
This section describes the process of generating the public opinion sentiment vector(POS)proposed in this paper.In this paper,investor comments(Text) are transformed into sentiment vectors(Sent),daily reading popularity(w),and daily public opinion activity(h) are used as weights for generating public opinion sentiment vectors.This approach considers the overall impact of public opinion on the market.
The proposed public opinion sentiment vector is divided according to date,and the training set has a total of m trading days.After each investor comment on thei-th day is converted into a sentiment vector,the public opinion sentiment vector POSi(i=1,2,...,m)for thei-th day is obtained by assigning weights to each investor comment according to its reading popularity,and the public opinion activity of that day.The process is illustrated in Fig.2.
Based on the opening time of the stock market,i.e.,from 9:30 on the current trading day to 9:30 on the next trading day,the investor comments for that period are used as the investor comments that generate the public opinion sentiment vector for thei-th day.For each investor comment on thei-th day Texti,j(j=1,2,...,n),the sentiment vector Senti,j(j=1,2,...,n)is computed by using a Transformer model with a multilayer Encoder-Decoder structure.Where Texti,j(j=1,2,...,n) represents thej-th investor comment on thei-th day,Senti,j(j=1,2,...,n) represents the sentiment vector generated by thej-th investor comment on thei-th day.
The Transformer model,first introduced by Vaswani et al.in their paper [24],utilizes a combination of word vectors and position encoding as input information.The position encoding captures the position of words or the relative distance between them in a given sequence.Furthermore,any sentences that exceed the maximum length limit are truncated at that limit.
The Transformer model is composed of multiple encoders and decoders.In the encoder,a tensor expressing the meaning of the text is input,obtained through pre-processing.The self-attention layer is applied to focus on the relationship between words,followed by normalization and forming a residual connection to a fully connected feedforward neural network.Further processing,including normalization and residual connection,occurs before the output is passed to the decoder and through the self-attention layer in conjunction with input from the decoder.
To achieve multi-head convergence,the final input of the decoder employs the use of a fully connected layer to extract features.This allows for an adaptive determination of the sentiment vector dimension based on the indicator dimension outlined in 3.1.2,enabling the generated sentiment vector dimension to be aligned with the technical indicator dimension within the model.
The maximum and minimum normalization of the reading volume of investor comments on thei-th day obtains the reading weight wi,jof each investor comment on thei-th day:
where readi,jrepresents the number of reads of thej-th investor comment on thei-th day,readi,maxrepresents the maximum number of reads on thei-th day,readi,minrepresents the minimum number of reads on thei-th day,and wi,jrepresents the reading popularity of thej-th investor comment on thei-th day.
Based on the obtained reading popularity,we can infer the level of attention paid to the investor comment by forum users.The sentiment vector is multiplied by the reading popularity to obtain a weighted sentiment vector.The weighted sentiment vector can reflect the varying impact of investor comments with different levels of reading popularity.Comments viewed by more people are more likely to influence market sentiment and cause market volatility.After weighting and averaging the sentiment vector of thei-th day,the average sentiment vector(AvgSent) AvgSentiof thei-th day is obtained as follows:
Simultaneously,the postings of m trading days are transformed into z-score normalized values,denoted as hi,to obtain the public opinion activity.These normalized values are then utilized as weights for the public opinion sentiment vector.
where countirepresents the posting volume on thei-th day,μ denotes the mean value of the number of investor comments,σdenotes the standard deviation of the number of investor comments,and hiis the public opinion activity on thei-th day.By standardizing the number of investor comments with a z-score,the daily public opinion activity can be normally distributed,and the influence of excessive magnitude differences on the public opinion activity can be eliminated.
By multiplying the daily sentiment vector AvgSenticalculated from the investor comments of the current day with the public opinion activity hiof the current day,the public opinion sentiment vector POSiof thei-th day is obtained as follows:
In Fig.3,we demonstrate the process of generating a single-day public opinion sentiment vector,using i’is January 17,2017,as an example.According to the technical indicator dimension outlined in 3.1.2,the sentiment vector feature dimension is determined to be 1 ∗10.It can be observed that there were 620 investor comment data on January 17,2017.A sentiment vector with feature dimension 620 ∗10 is generated by the Transformer model,multiplied by the reading weight w with feature dimension 620 ∗1,and then a weighted average is performed to obtain the AvgSenti′with feature dimension 1 ∗10.The resulting vector is then multiplied with a heat weight h of feature dimension 1 ∗1 to obtain the final public opinion sentiment vector POSi′of feature dimension 1 ∗10.
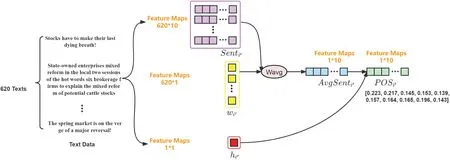
Figure 3:Example of public opinion sentiment vector generation on 02 January 2017
3.3 Structured Multi-Head Attention Stock Index Prediction Method
This section describes the structured multi-head attention prediction method proposed in this paper.The traditional multi-head attention model has limitations in handling heterogeneous data.In order to improve the ability to handle heterogeneous data,the factors are manually divided into the public opinion sentiment head and the technical head.
The structure diagram of the structured multi-head attention prediction method based adaptive public opinion sentiment vector in this paper is presented in Fig.4.
This study proposes a structured multi-head attention prediction method that incorporates adaptive public opinion sentiment vectors.The method begins by selecting technical indicators and determining their dimensions,then generating an adaptive dimensional public opinion sentiment vector based on the technical indicator dimensions.The public opinion sentiment vector and technical indicators are input separately into the multi-head attention layer to generate public opinion sentiment heads and technical heads.The public opinion sentiment head focuses on public opinion sentiment indicators,while the technical head focuses on technical indicators.The two heads are used to aggregate data from these two aspects separately,and the data is fused after being computed in the multi-head attention layer to predict the changes in the stock market.
The multi-head attention mechanism allows a set of multiple heads to learn different features at each position in the sequence jointly.The output of the multi-head attention module,which consists of stitching together information from multiple heads,is as follows:
WOis the weight matrix,and WQi,WKi,WViare the parameter matrices of the query vector(Qi),the key vector(Ki),and the value vector(Vi)in thei-th head.It was computed using the scaled dot product attention.The scaled dot product attention is computed as follows:
The Qi,the Ki,and the Viare transformed from the input public opinion sentiment vector and technical indicators through the parameter matrix,respectively.Qiand Kiare subjected to a dot product operation to obtain the relationship between the input indicators.Divide the input of the upper layer by the vector dimension √to prevent the gradient from being too small after softmax.Finally,the softmax post-weight probabilities and Viare dotted and multiplied to obtain the attention output.
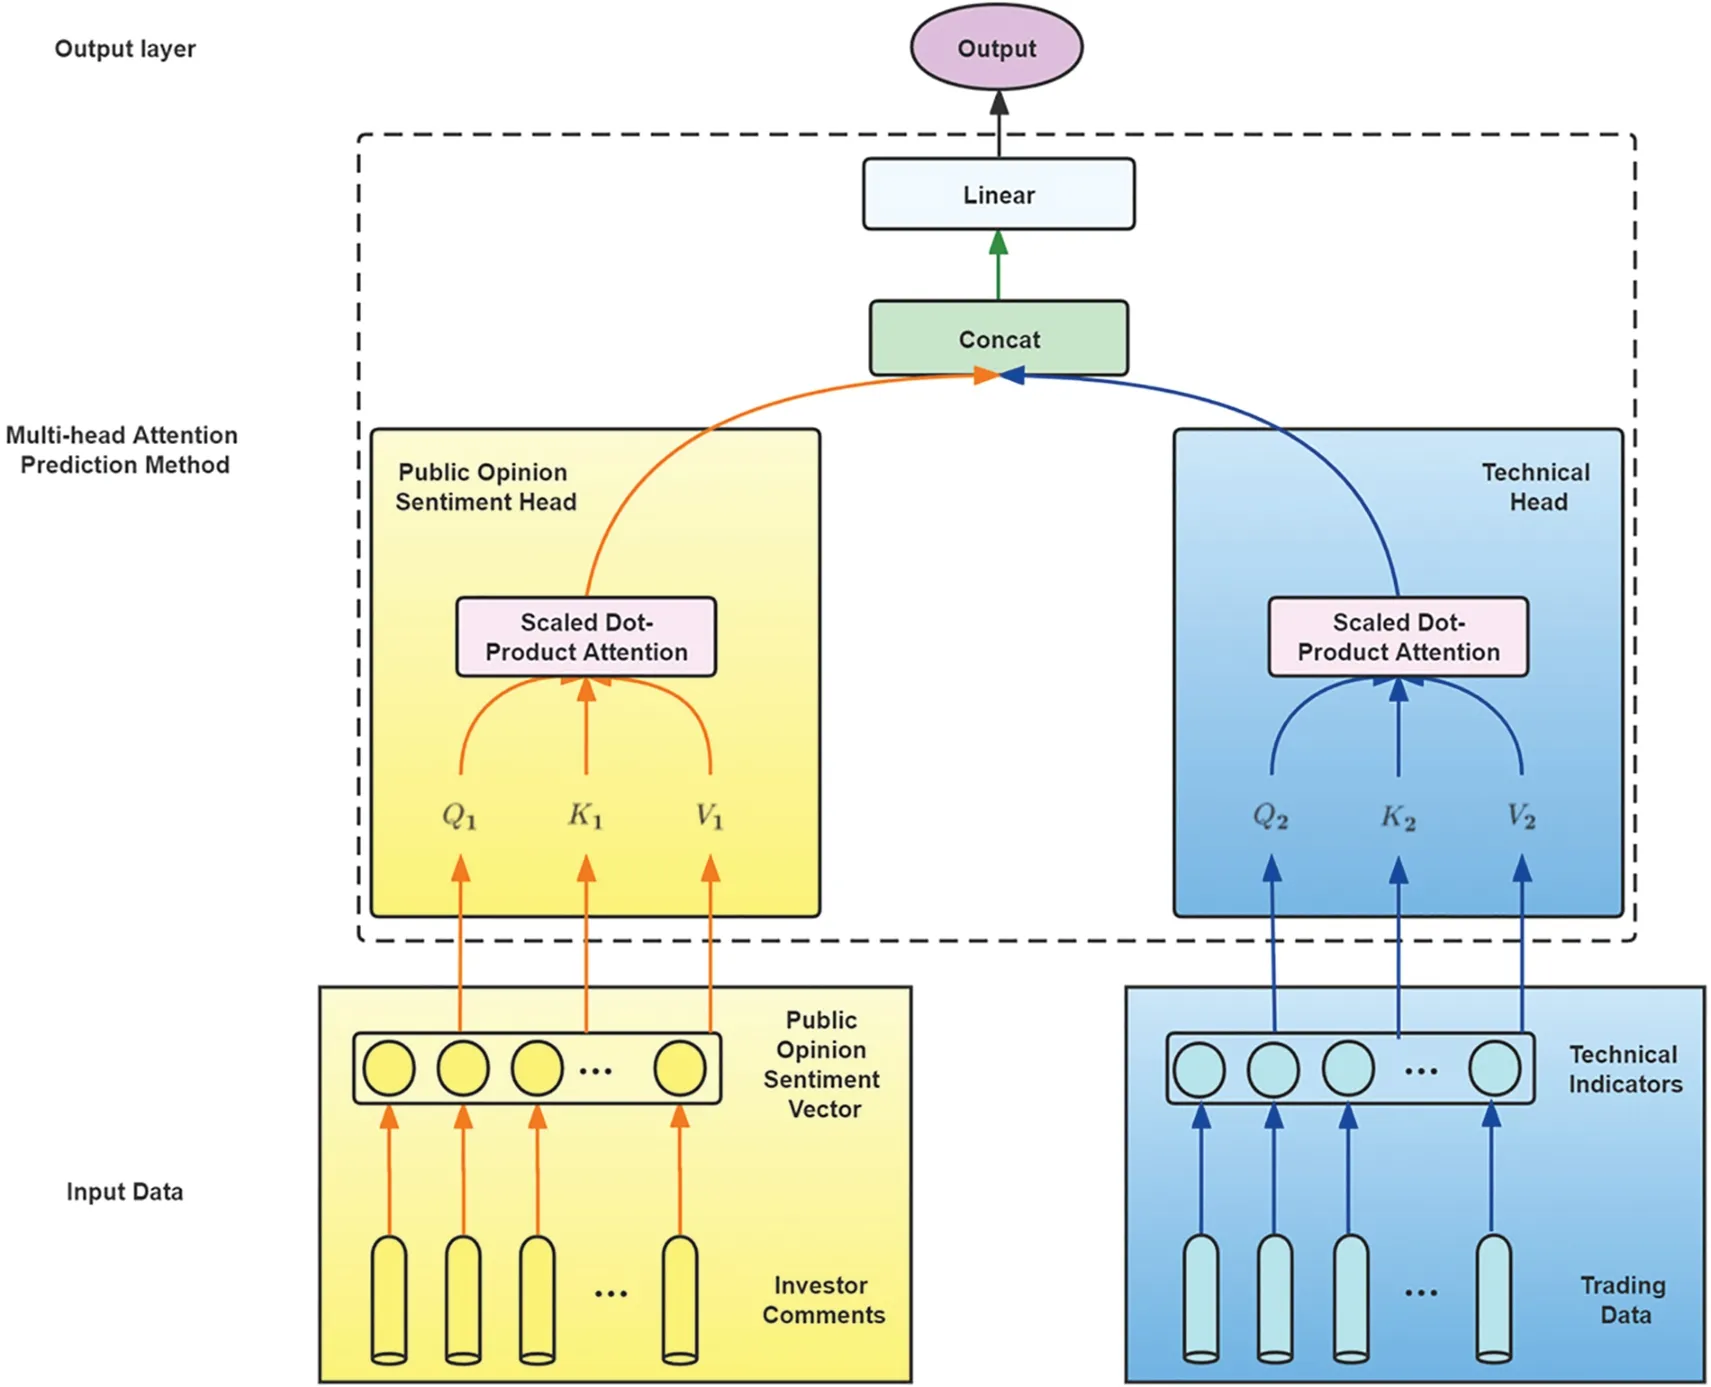
Figure 4:Structure of structured multi-head attention stock index prediction method based on adaptive public opinion sentiment vector
The attention output is finally passed through the linear layer to obtain the Output of the linear layer,which is the final stock market closing price prediction value.
where Wlis the weight of the linear layer and blis the bias term of the linear layer.
3.4 Sliding Time Window Method
The experiment employs the sliding time window method,a widely used technique in financial engineering.Specifically,the data is divided into a training set and a test set for each sliding iteration,with the latest time of the training set samples preceding the earliest time of the test set samples.The division is done incrementally over time.The training set data to be predicted is strictly excluded from the training sample to prevent data leakage.The specific implementation of the sliding approach is illustrated in Fig.5.

Figure 5:Sliding time window method
4 Experiment and Results
In this section,an experimental procedure is devised to evaluate the effectiveness of the research method presented in this paper.The first step involves comparing the prediction effect of sentiment polarity and public opinion sentiment vector for the stock market using a benchmark algorithm.This serves to evaluate the utility of the public opinion sentiment vector in stock index prediction.Subsequently,a hybrid method is proposed and compared to the benchmark algorithm,incorporating technical indicators and public opinion sentiment vectors as inputs.The final step involves conducting backtesting to evaluate the validity of the proposed prediction method in the market.
4.1 Experimental Settings
In this study,an experiment is conducted to forecast the SSE index,using a dataset comprising 1,217 trading days of SSE data from January 1st,2017,to December 31st,2021,as the source of technical indicator data.Additionally,a dataset of 3408897 investor comments spanning a period of five years,from January 1st,2017,to December 31st,2021,is utilized.
In addition,the detailed configuration of the computer selected for the experiment is shown in Table 3.
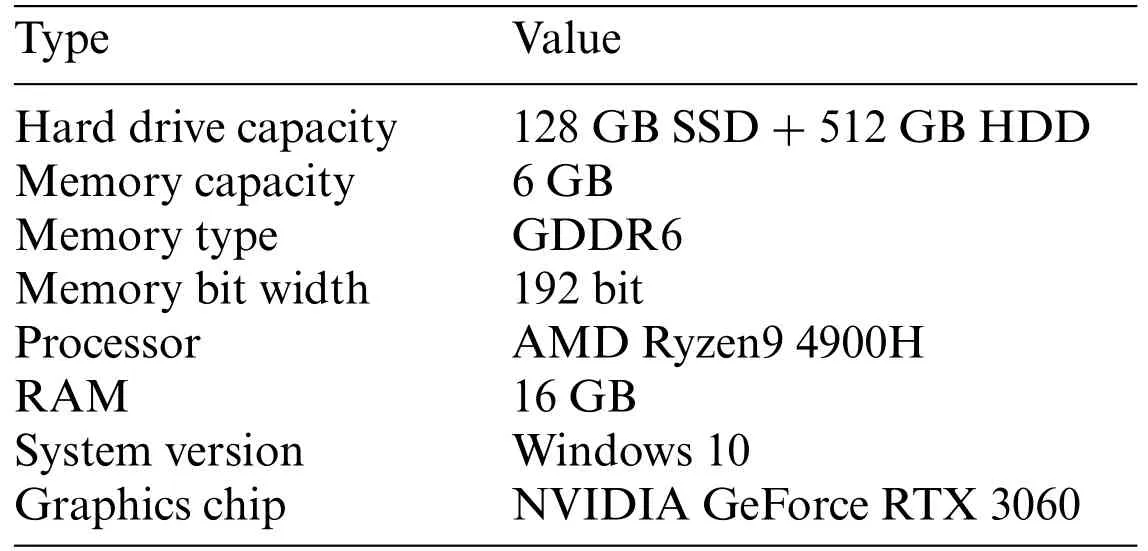
Table 3: PC Side
4.2 Experimental Results and Discussion
In this study,we examine the impact of sentiment factors on forecasting by combining sentiment polarity and public opinion sentiment vectors with technical indicators,utilizing the benchmark algorithm of support vector regression(SVR)[30].To evaluate the accuracy of the forecasting results at the data level,we calculated the mean absolute percentage error (MAPE),root-mean-squared error(RMSE),and F-score,as presented in Table 4.The RMSE measures the deviation between the predicted value and the actual value,and a smaller value indicates better performance,while MAPE measures the relative percentage of error,and again,a smaller value indicates better performance.The F-score,the sum of the average of prediction classification accuracy and recall,is used to evaluate the effectiveness of prediction classification,and a larger value indicates better performance.

Table 4: Evaluation of different sentiment factors indicators
As evident from Table 4,the results of forecasting using the public opinion sentiment vector indicate a lower MAPE,RMSE,and a higher F-score.Furthermore,Fig.6 illustrates the relationship between the number of daily investor comments and stock market volatility,as well as prediction accuracy.
As depicted in Fig.6,the presence of many texts is often correlated with dramatic stock market volatility.Despite a small percentage of total trading time,these periods are most likely to generate significant risk or reward.The large volume of commentary corpus generated by investors during these volatile times due to heightened emotions can aid the model in capturing market sentiment more accurately.Furthermore,this study investigates the relationship between prediction accuracy over the last ten days and the number of daily investor comments.As can be observed from the figure,when the number of investor comments is adequate,public opinion is more active,and the combination of the public opinion sentiment vector predicts better.For instance,in marker 1,from March 1st,2021,to March 9th,2021,the new regulations of the financial penal code to upgrade the market regulation caused intense discussions in the market.In marker 2,from July 26th,2021,to July 29th,2021,the education industry and related industries were affected by releasing the “double reduction”policy,which caused investor panic.The impact of the “double reduction”policy on the education sector and related industries triggered investor panic.Public opinion is more active in both periods,and the forecast is better.
Second,to evaluate the effectiveness of the multi-head attention mechanism in predicting the stock market when combined with the public opinion sentiment vector,we compare the proposed method with the benchmark model.To assess the forecasting ability of different models,we divided the time series inputs into X0 (containing only technical indicators) and X1 (containing technical indicators and public opinion sentiment vector)to verify whether different models can combine public opinion sentiment vectors and produce better forecasting ability.To ensure a fair comparison of the prediction effectiveness of each model,we performed a grid search method to obtain the optimal hyperparameters for LSTM,Attention LSTM(AttLSTM),and bidirectional LSTM(BiLSTM),as presented in Table 5.We used the default values for any hyperparameters not mentioned in the table.

Table 5: Optimal hyperparameters for each model
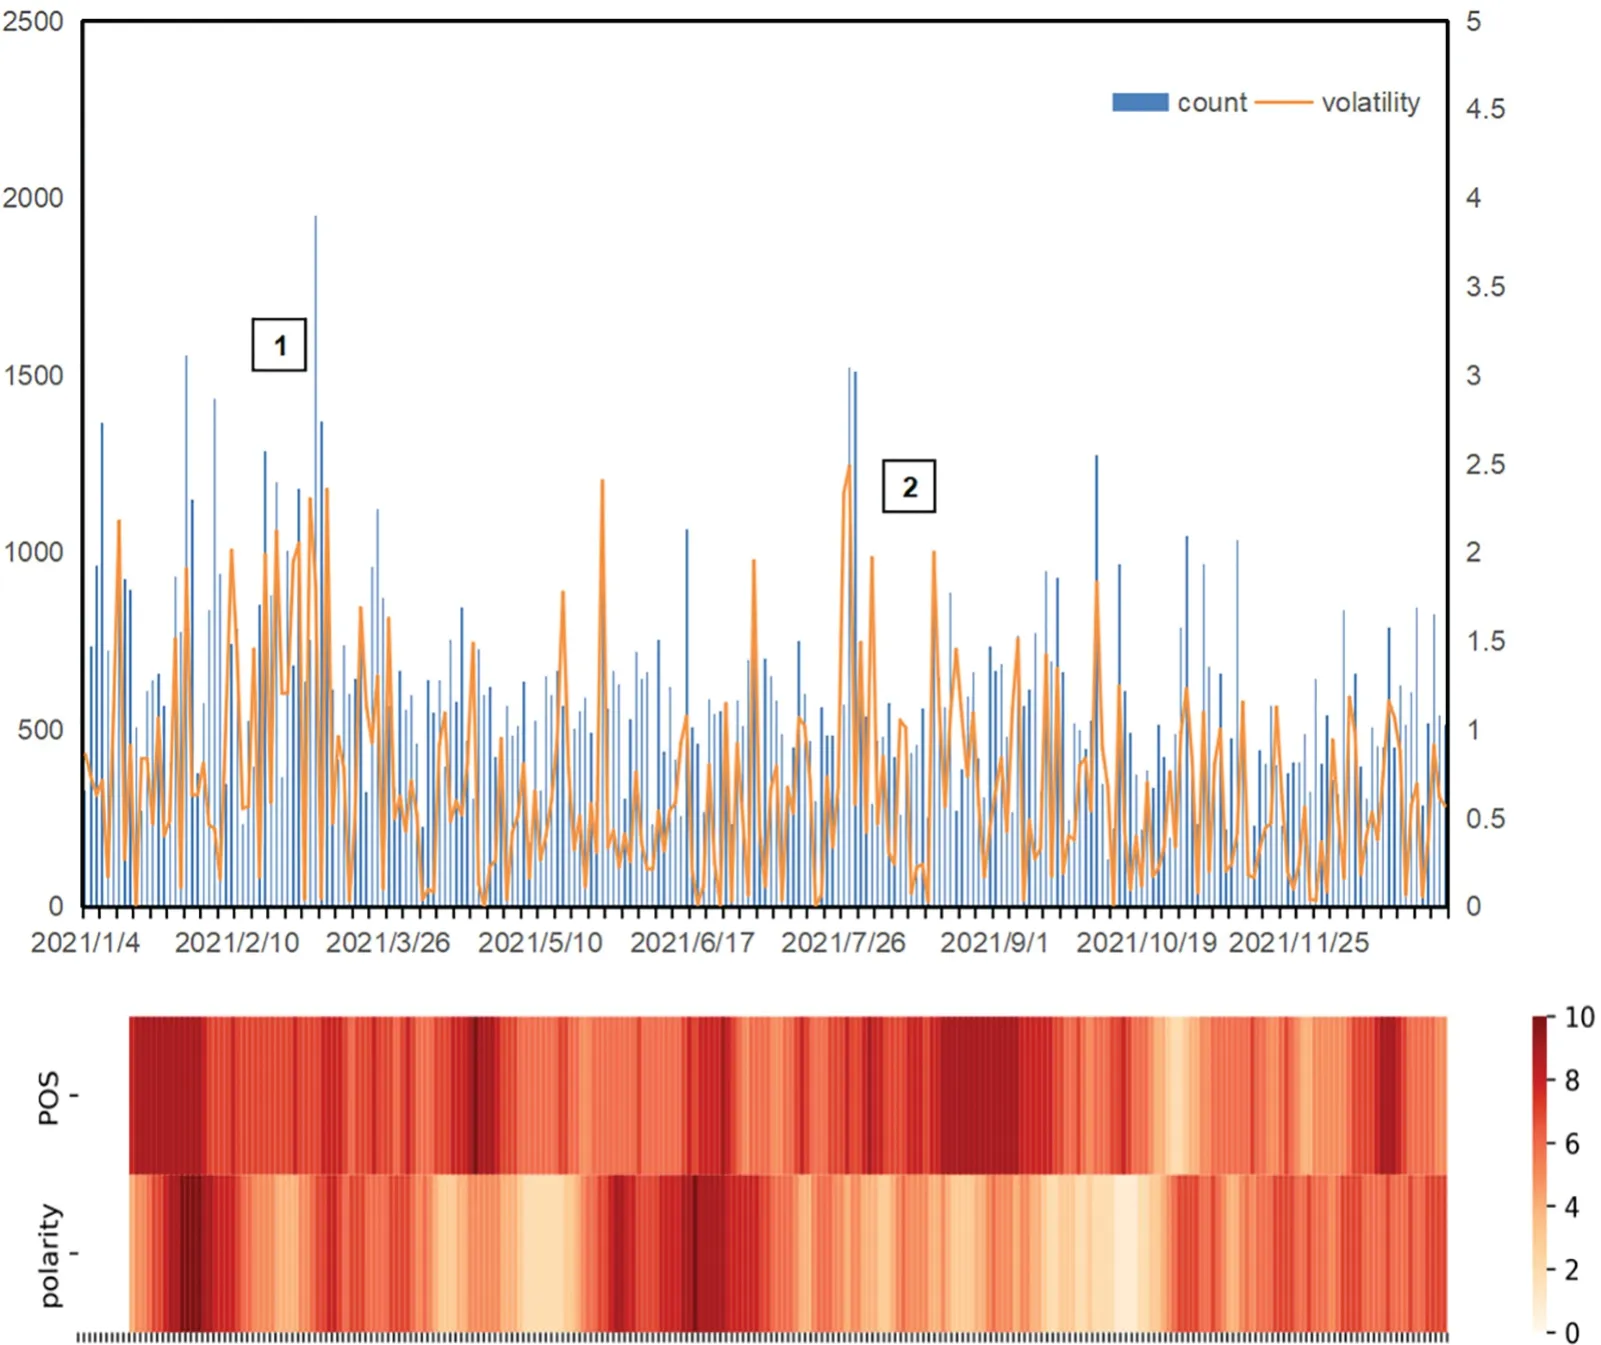
Figure 6: Relationship between the number of daily investor comments,stock market volatility,and the accuracy of ten-day forecasts
Fig.7 focuses on the weight distribution of the multi-head attention mechanism in the hybrid method and presents the weight distribution,with the two heads focusing on public opinion sentiment indicators and technical indicators,respectively.The different distribution of weights in each head reflects that the public opinion sentiment head and the technical head have different attention weights.In the public opinion sentiment head in Fig.7a,the more significant weight is represented by a relatively vertical straight line,representing POS [2],the third dimension in the public opinion sentiment vector,which plays a higher role in prediction.At the same time,POS[7]also has a certain weight of attention and plays a role in prediction.In contrast,in the technical head in Fig.7b,the weights are more evenly distributed than in the public opinion sentiment head,with some weight attention given to different aspects.Therefore,our multi-head attention method can aggregate data from both aspects with different attention directions.
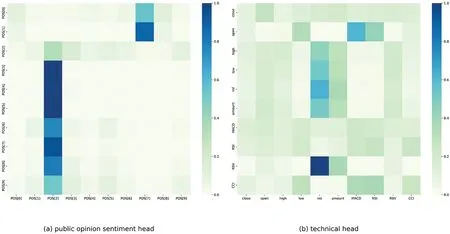
Figure 7:Distribution of multi-head attention weights
Fig.8 presents the box plots of the error values between the predicted price and the actual closing price of the structured multi-head attention prediction method based on the adaptive public opinion sentiment vector proposed in this paper and each benchmark algorithm.
The box plots in Fig.8 visually depict the distribution of daily errors for each model,including the evaluation metrics’upper and lower bounds,median,and outlier points.As can be seen from the box plots,the prediction method proposed in this paper does not exhibit significant deviations,and the upper and lower errors are smaller than those of the benchmark algorithm.This indicates that the proposed method in this paper has a high degree of fit.Furthermore,the prediction using X1 as input data,i.e.,the public opinion sentiment vector,yields better results than X0,i.e.,using only technical indicators.When using the X1 data,the SVR algorithm has reduced the upper and lower error limits and has less deviation.The LSTM algorithm has slightly reduced deviation and upper and lower error limits.After the BiLSTM algorithm uses X1 as the input data,the bias is significantly reduced,and the upper and lower bounds error is reduced.After using the attention mechanism,the AttLSTM algorithm produces some bias,but the upper and lower bound errors are smaller and closer.In contrast,the proposed method in this paper not only produces no bias but also has smaller upper and lower bound errors than all the benchmark algorithms and has better prediction results.
The average MAPE,RMSE,and F-score results obtained from ten experiments conducted with the hybrid method and the comparison experiment are presented in Table 6.
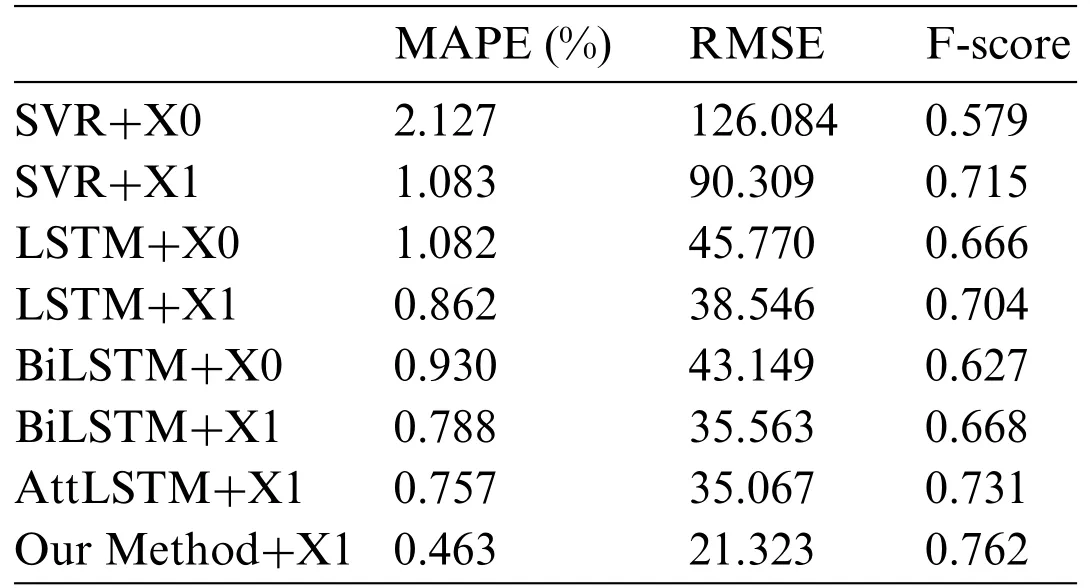
Table 6: Average evaluation of each benchmark algorithm

Figure 8:The error value between the prediction result and the actual closing price of each algorithm
In Table 6 of the study,the performance of the proposed method is compared with several benchmark algorithms.To begin with,SVR,LSTM,and BiLSTM are selected as the benchmark algorithms and are compared for predictions made using only technical indicators(algorithm+X0)and for predictions made by combining public opinion sentiment vectors and technical indicators(algorithm+X1).The comparison results demonstrate that using both public opinion sentiment vectors and technical indicators leads to a lower Mean Absolute Percentage Error (MAPE),Root Mean Squared Error(RMSE),and higher F-score when compared to using only technical indicators.These results indicate that the public opinion sentiment vector contains valuable information about the investor market and that incorporating it into the prediction model results in improved forecasting outcomes.Furthermore,the performance of each benchmark algorithm when combining public opinion sentiment vectors is compared.The results of the comparison demonstrate that the proposed method,which uses the structured multi-head attention mechanism,outperforms the other benchmark algorithms.This is due to the structured multi-head attention mechanism’s ability to extract and separate market opinion and technical indicators and to effectively use information from both the public opinion sentiment and technical sides to make predictions.Hence,the proposed method in the paper provides an even better prediction effect.
Overall,the method proposed in this paper can better combine public opinion sentiment and technical data,and achieve the lowest MAPE,RMSE,and highest F-score values,resulting in the best prediction results.
4.3 Market Trading Backtesting
This study uses data from the SSE Composite Index from January 07,2021,to December 31,2021,for backtesting purposes.A timing trading strategy is developed and implemented,wherein a buy signal is generated when the model predicts an increase above a specified threshold,a sell signal is formed when the model predicts a decrease above the threshold,and the position is maintained unchanged for the remaining period.
Three key indicators-return,maximum retracement,and Sharpe ratio-are selected to evaluate the backtesting strategy performance.Return,as a percentage of total capital,represents the net profit,and a higher value is desirable.A maximum retracement is defined as the maximum value of the retracement of return when the net value of the product reaches its lowest point over a selected period,with a lower value being preferable.Lastly,the Sharpe ratio indicates the excess reward generated for each unit of total risk taken,with a higher value being desirable.The backtesting strategy metrics are presented in Table 7.
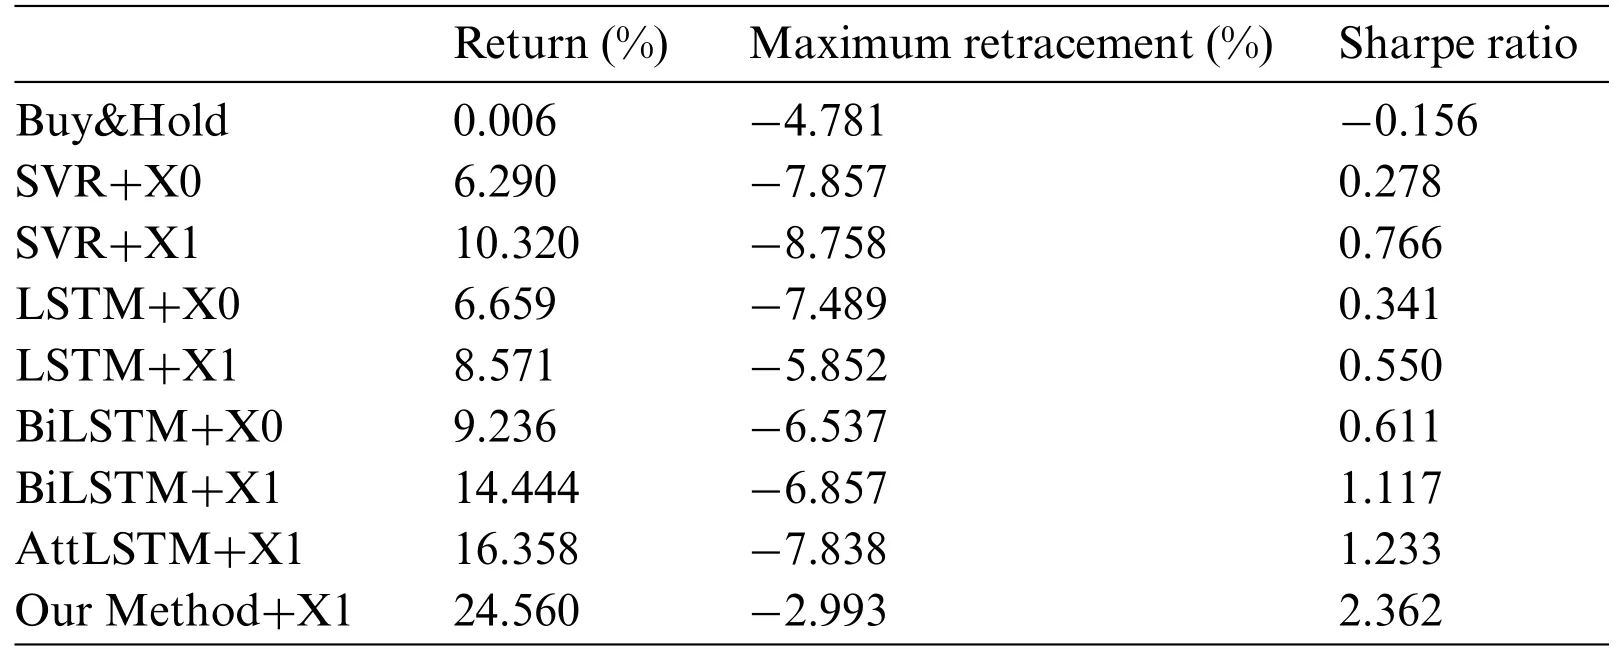
Table 7: Evaluation of backtesting strategy indicators
As observed from Table 7,the returns and Sharpe ratios of the proposed method in this study are superior to those of the benchmark algorithms during the backtesting phase.Additionally,the maximum retracement of the proposed method is smaller than that of the benchmark strategies,indicating that the risk can be effectively mitigated in the context of stock market quantification.The performance of the strategy returns and daily heat map formed with the funds at the close of the trading day are presented in Fig.9.
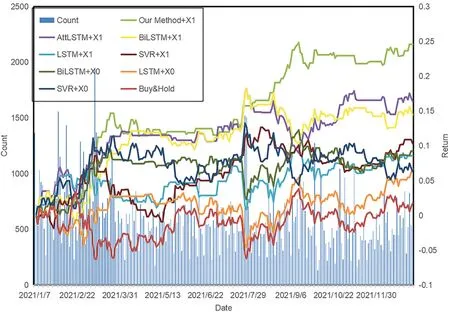
Figure 9:SSE composite index strategy backtesting return and daily heat
As illustrated in Fig.9,the market sentiment appears to be more dynamic between January and March and August and October of 2021.The results show that the algorithmic model using opinion vectors performed better during the March 2021 trading day compared to the model that did not use opinion vectors,thereby highlighting the effectiveness of opinion vectors in expressing intense public sentiment.The proposed method in the study effectively addresses market sentiment fluctuations by promptly closing positions to minimize losses and displaying a superior risk response-ability.Furthermore,during the September 2021 trading day,the proposed approach effectively leverages its feature aggregation capabilities to capture opportunities in public sentiment,resulting in superior returns,despite each algorithm experiencing different levels of volatility.
5 Conclusion and Future Work
In this study,we propose a novel,structured multi-head attention stock index prediction method that incorporates adaptive public opinion sentiment vectors to predict the Chinese stock market.This approach considers the complex sentiments of the market and investors through opinion analysis while enhancing the model’s predictive power through the convergence capability of the multi-head attention mechanism by combining public opinion sentiment indicators with technical indicators.
Concerning the correlation between market volatility and public opinion,the experiments presented in this paper demonstrate a correlation between public opinion and market volatility.Furthermore,the results indicate that incorporating public opinion in the forecasting process leads to more effective results when market discussions are active.The figure in this paper,which depicts the construction of a structured multi-head attention model,illustrates that the model converges features into two heads,generating different weights to support forecasting.
However,this study also has some limitations that should be acknowledged.One limitation is that there may be instances where public opinion is used to manipulate stocks,which may interfere with the analysis results.This issue could be further analyzed in future studies.Additionally,future research needs a more detailed discussion of individual stocks with less rich corpus data and a wider variety of factors(e.g.,financial factors,risk factors).
Acknowledgement:I would like to express my heartfelt gratitude to all those who have supported me throughout the process of writing this thesis.I am deeply thankful to my wife,Dr.Jie Zhou,whose invaluable inspiration has been a guiding force in my research.Additionally,I extend my thanks to my son,Siyuan Zhao,whose smile has been a constant source of motivation for my studies.Lastly,my sincere appreciation goes to my parents,who have always been there to provide unwavering support,assistance,and care in my life.
Funding Statement:This research was funded by the Major Humanities and Social Sciences Research Projects in Zhejiang higher education institutions,grant number 2023QN082,awarded to Cheng Zhao.The National Natural Science Foundation of China also provided funding,grant number 61902349,awarded to Cheng Zhao.Further information about the funding organizations can be found on their respective websites:http://jyt.zj.gov.cn/and https://www.nsfc.gov.cn/.
Author Contributions:The authors confirm contribution to the paper as follows: study conception and design:Cheng Zhao,Zhe Peng,Yuefeng Cen;data collection:Cheng Zhao,Yuefeng Cen,Zuxin Wang;analysis and interpretation of results:Cheng Zhao,Zhe Peng,Xuefeng Lan,Zuxin Wang;draft manuscript preparation:Cheng Zhao,Zhe Peng,Xuefeng Lan.All authors reviewed the results and approved the final version of the manuscript.
Availability of Data and Materials:The data that support the findings of this study are openly available in Oriental Fortune and JoinQuant(https://www.joinquant.com/).
Conflicts of Interest:The authors declare that they have no conflicts of interest to report regarding the present study.
杂志排行

Computers Materials&Continua的其它文章
- Fuzzing:Progress,Challenges,and Perspectives
- A Review of Lightweight Security and Privacy for Resource-Constrained IoT Devices
- Software Defect Prediction Method Based on Stable Learning
- Multi-Stream Temporally Enhanced Network for Video Salient Object Detection
- Facial Image-Based Autism Detection:A Comparative Study of Deep Neural Network Classifiers
- Deep Learning Approach for Hand Gesture Recognition:Applications in Deaf Communication and Healthcare