ldentification of the key genes and mechanisms associated with transcatheter arterial chemoembolisation refractoriness in hepatocellular carcinoma
2024-03-08JieZhuangHuangJianDiLiGangChenRongQuanHe
Jie-Zhuang Huang,Jian-Di Li,Gang Chen,Rong-Quan He
Abstract BACKGROUND Transcatheter arterial embolisation (TACE) is the primary treatment for intermediate-stage hepatocellular carcinoma (HCC) patients while some HCC cases have shown resistance to TACE.AIM To investigate the key genes and potential mechanisms correlated with TACE refractoriness in HCC.METHODS The microarray datasets of TACE-treated HCC tissues,HCC and non-HCC tissues were collected by searching multiple public databases.The respective differentially expressed genes (DEGs) were attained via limma R package.Weighted gene co-expression network analysis was employed for identifying the significant modules related to TACE non-response.TACE refractoriness-related genes were obtained by intersecting up-regulated TACE-associated and HCC-associated DEGs together with the genes in significant modules related to TACE nonresponse.The key genes expression in the above two pairs of samples was compared respectively via Wilcoxon tests and standard mean differences model.The prognostic value of the key genes was evaluated by Kaplan-Meier curve.Multivariate analysis was utilised to investigate the independent prognostic factor in key genes.Single-cell RNA (scRNA) sequencing analysis was conducted to explore the cell types in HCC.TACE refractoriness-related genes activity was calculated via AUCell packages.The CellChat R package was used for the investigation of the cell-cell communication between the identified cell types.RESULTS HCC tissues of TACE non-responders (n=66) and TACE responders (n=81),HCC (n=3941) and non-HCC (n=3443) tissues were obtained.The five key genes,DLG associated protein 5 (DLGAP5),Kinesin family member 20A (KIF20A),Assembly factor for spindle microtubules (ASPM),Kinesin family member 11 (KIF11) and TPX2 microtubule nucleation factor (TPX2) in TACE refractoriness-related genes,were identified.The five key genes were all up-regulated in the TACE non-responders group and the HCC group.High expression of the five key genes predicted poor prognosis in HCC.Among the key genes,TPX2 was an independent prognostic factor.Four cell types,hepatocytes,embryonic stem cells,T cells and B cells,were identified in the HCC tissues.The TACE refractoriness-related genes expressed primarily in hepatocytes and embryonic stem cells.Hepatocytes,as the providers of ligands,had the strongest interaction with embryonic stem cells that provided receptors.CONCLUSION Five key genes (DLGAP5,KIF20A,ASPM,KIF11 and TPX2) were identified as promoting refractory TACE.Hepatocytes and embryonic stem cells were likely to boost TACE refractoriness.
Key Words: Hepatocellular carcinoma;Transcatheter arterial embolisation refractoriness;Weighted gene co-expression network analysis;Single-cell RNA sequencing;AUCell;CellChat
lNTRODUCTlON
Hepatocellular carcinoma (HCC) is a major primary liver tumour,accounting for more than 90% of primary liver tumour cases[1].HCC is currently the fifth most common cancer worldwide and the second leading cause of cancer death in men,with the five-year survival rate of 18% second only to pancreatic cancer[1].The complex pathogenesis of HCC and its various risk factors like chronic hepatitis B virus infection and alcohol abuse lead to the increasing incidence of HCC[2,3].A retrospective study showed that the incidence of HCC increased markedly in America from 1975 to 2016[4].It is worth noting that HCC is generally diagnosed in its advance stage[5].The appearance of symptoms stage means the rapid progress of HCC with the poor therapeutic effect and slim survival[6].
Transcatheter arterial embolisation (TACE) is a strategy in which catheters,with the support of various embolisation drugs,are placed in the large arteries,typically the femoral arteries,to block the tumour’s blood supply[7,8].The selection of the treatment is based on the Barcelona Clinic Liver Cancer staging system,which was created according to the number size of the HCC and the performance of the patient[9].TACE is a standard therapy for intermediate-stage HCC patients[10].Currently,surgical treatment,liver transplantation and ablation are available for early-HCC patients and contribute to a high survival rate[8,11].However,metastatic disease may be a barrier to surgical therapy[12].Local ablation is regarded as a safer alternative to surgery,but it is also not suitable for patients who have tumours in the subcapsular or domed position or near the main bile duct,large blood vessels or the intestine[13].Patients who cannot benefit from the above treatments despite the early stage of the disease may be candidates for TACE[14].Chemotherapy is universally considered the first choice for advanced HCC when there is a low pharmaceutical response or the formation of portal vein tumour thrombosis[15].In clinical practice,multiple combinations of liver-directed therapies (LDT) pave the way for the curative treatment[16],and TACE is still the most widely used as an LDT for locally advanced HCC patients[17].Therefore,TACE is an important method for treating HCC at all stages.
Unfortunately,some investigations have shown that a load of HCC patients did not respond to TACE,which reduces the efficacy of the systematic therapy significantly[18].One recent study employed a cohort of HCC patients after TACE treatment,and a series of vitro experiments revealed that pyruvate kinase M1/2 was highly expressed,which may promote HCC tolerance to TACE through glycolysis dysregulation[19],and was associated with a low survival rate in TACE non-response HCC patients.Additionally,another study found that the low expression of miRNA-125b induced an HCC tolerance to TACE through a transcriptome analysis of 680 HCC patients[20].However,HCC is featured in the high heterogeneity of genetic drivers leading to therapeutic susceptibility[21].Therefore,individual genes heterogeneity requires the exploration of other potential factors through systematic measures.
In this study,we aimed to identify the key genes of TACE refractoriness in HCC.Additionally,the potential mechanisms of TACE refractoriness in HCC were explored.Finally,potential therapeutic drugs against TACE refractoriness in HCC were discovered.The flow chart of this study is shown in Figure 1.
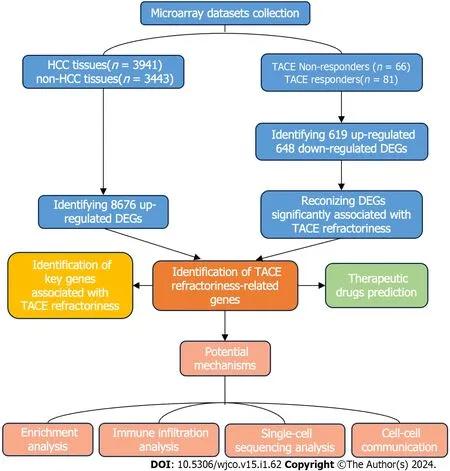
Figure 1 The flow chart of the present study. HCC: Hepatocellular carcinoma;DEGs: Differentially expressed genes;TACE: Transcatheter arterial chemoembolisation;WGCNA analysis: Weighted gene co-expression network analysis.
MATERlALS AND METHODS
Data collection and processing
We retrieved the datasets including TACE non-responders and TACE responders from the Cancer Genome Atlas (TCGA),Gene Expression Omnibus (GEO),International Cancer Genome Consortium and ArrayExpress databases,with the query formulation 'Hepatocellular carcinoma AND Transcatheter arterial embolisation'.The datasets included were required to belong toHomosapiensand contained HCC tissues from TACE non-responders and TACE responders who had not received any prior treatment.Simultaneously,we collected HCC and its control samples from the TCGA,GEO,Genotype-tissue Expression (GTEx) and ArrayExpress databases with keywords ‘hepatocellular carcinoma’ based on the following criteria: (1) The matrix must beHomosapiens;(2) the data sets should include HCC and normal liver tissues or one of the above groups and can be merged;and (3) the collected samples should not be influenced by any chemicals or physical treatment.Subsequently,the profiles of all of the screened datasets downloaded from the above database were annotated according to the platform annotation files and then conducted by log2(x+1) conversion.To integrate the expression matrix from the same platforms or append the lack of normal liver tissue samples in some matrices,the R software (Version 3.6.2) was used to merge and normalise datasets with different sequencing and background throughlimmaand surrogate variable analysis (sva) packages.
The screening of differentially expressed genes
Thelimmapackage was applied to identify the differentially expressed genes (DEGs).The DEGs between TACE nonresponders and TACE responders (TACE-associated DEGs) had to meet the requirement ofPvalue < 0.05 and |log2(Foldchange)| > 0.5.The DEGs between HCC and non-HCC tissues (HCC-associated DEGs) from the datasets were integrated by calculating the standardised mean difference (SMD).DEGs withP< 0.05 and |SMD| > 0 were recorded as the DEGs in HCC.
Weighted gene co-expression network analysis
Weighted gene co-expression network analysis (WGCNA) is a systematic biological method for calculating the correlation among genes for finding gene clusters (modules) and connecting gene modules with external sample traits using eigengene network methodology[22].In this study,we utilised WGCNA analysis to identify more reliable hub genes associated with TACE refractoriness in HCC.
The co-expression network construction
WGCNA R package was utilised to construct the co-expression network using the expression profile of the TACEassociated DEGs in GSE104580.Firstly,Pearson's correlation matrix and average linkage methods were both used for all pair-wise genes.Secondly,an adjacency matrix was established to calculate the correlation value.The soft threshold was used to emphasise the correlation between two genes and eliminate weak correlations.Thirdly,adjacency was transformed into a topological overlap matrix (TOM) to measure the similarity of the nodes by comparing the weighted correlation between each of the nodes.At the same time,the corresponding dissimilarity (1-TOM) was calculated.
Identification of the clinically significant modules
Module eigengene was the first principal component of the module and was defined as the expression file of the whole genes in the module.The correlation coefficient between module eigengene and the clinical trait,namely the reactivity to TACE,was calculated to identify the clinically significant module.Module membership was regarded as the correlation between the genes and the module eigengene and was used to evaluate whether the genes belonged to the module or not.Additionally,gene significance was defined as the mediatedPin the linear regression between expression and clinical traits.In addition,module significance was the average absolute gene significance of whole genes in the module.Finally,the modules with the top-two correlation coefficients between module eigengene and clinical status TACE nonresponders were selected as the clinically significant modules for further analysis.
The screening of key genes in the protein-protein interaction network
The up-regulated genes in TACE-associated DEGs,up-regulated HCC-associated DEGs and the genes in the clinically significant modules were intersected and their shared genes were considered as TACE refractoriness-related genes.TACE refractoriness-related genes were utilised for protein-protein interaction (PPI) network constructionviaSTRING database.Then,the key genes were identified using the Maximal Clique Centrality (MCC) method of cytoHubba plugin in Cytoscape software (Version 3.7.2).MCC algorithm is a method of scoring each protein in the PPI network.A higher score means the protein is associated with more proteins in the network.
The validation of the key genes in expression and prognosis
The mRNA expression level of the key genes between TACE non-responders and TACE responders was compared throughWilcoxontests.Then,to verify that the key genes were differentially expressed in HCC,SMD model and a 95% confidence interval (95%CI) were carried out using Meta R packages and STATA 12.0 by integrating the datasets containing HCC and non-HCC tissues.A random-effect model or fixed-effect model was selected in the light of theI2test and Chi-square test.The random-effect model was chosen when there was high heterogeneity (I2> 50% orP< 0.05).Otherwise,the fixed-effect model was chosen.Sensibility analysis was conducted to detect the high heterogeneous datasets.The protein expression of key genes in HCC tissues was compared to that in non-HCC tissues by browsing The Human Protein Atlas (THPA) database.We then gathered the clinical information of the HCC tissues in the datasets.The clinical information was required to include survival status and survival time,and only the clinical information in TCGA datasets was eligible.To identify the independent prognostic factors in the key genes,multivariate analysis was used.For survival analysis,the optimum cut-off for division into high expression and low expression group was determined by running Survminer and Survival packages and the hazard ratio (HR) was calculated by Cox-proportional hazards regression model.Finally,the Kaplan-Meier was visualised using the Survival package.
Gene sets enrichment analysis
TACE refractoriness-related genes were utilised in gene ontology (GO) annotation analysis,Kyoto Encyclopaedia of Genes and Genomes (KEGG) pathway using the clusterProfiler R package and Reactome pathway using Reactome pathway database.The terms withP< 0.05 and FDR < 0.25 were considered statistically significant.The top-five GO terms in respect to biological process (BP),cellular component (CC) and molecular function (MF) were investigated.Finally,the KEGG pathways and the top-ten Reactome pathways were visualised.
Single-cell RNA sequencing data pre-processing and cell type identification
To further explore the cell types involved in TACE refractoriness,single-cell RNA sequencing (scRNA-seq) analysis was adopted.The scRNA-seq data were obtained from the GEO database with the search strategy 'ScRNA OR Single Cell AND Hepatocellular Carcinoma'.The samples in the scRNA-seq data had to be HCC samples that were not treated using any chemical or physical factors.The quality control process of the scRNA-seq data was performed with the Seurat R package.Cells with < 500 genes,> 6000 genes or > 20% mitochondrial genes were filtered out.Then,the gene expression matrix was normalised and scaled.Subsequently,the Harmony R package was employed for eliminating batch effect.A uniform manifold approximation and projection (UMAP) analysis was performed for dimensional reduction.The FindClusters function was able to classify the cells into different clusters with a resolution of 0.5,and the annotation of the cell clusters depended on the SingleR package.The activity of TACE refractoriness-related genes in each cell line was determined using the AUCell R package.Cells expressing more TACE refractoriness-related genes had higher area under-the-curve (AUC) values.The ‘AUCell_exploreThresholds’ function was used to determine the threshold for identifying TACE refractoriness-related genes’ active cells.The AUC score of each cell was then mapped to the UMAP plot embedding using the ggplot2 R package to visualise the active clusters.
Cell-cell communication analysis
CellChat,an open R package,was utilised for the analysis of intercellular communications using scRNA-seq data[23].After identifying the cell types in the HCC tissues,the CellChat R package (Version 1.1.3) was employed to investigate the number of interactions,the communication strength and the over-expressed ligands and receptors between each identified cell type.The discovery of overexpressed ligand-receptor pairs was based on the data of ligand-receptor pairs related to ‘Secreted Signalling’ in datasets CellChatDB.The communication probability was calculated by means of the function ‘computeCommunProb’ in the CellChat R package.Subsequently,the cell-cell communication was predicted and aggregated.The number of interactions was visualised to show integrated communication.
Immune infiltration analysis
To elucidate the correlation between the TACE resistance and tumour microenvironment in the HCC,we conducted immune infiltration analysis based on CIBERSORT and xCell algorithm.The CIBERSORT algorithm is a deconvolution method used,in this case,to process marker gene expression values to estimate the proportion of various types of immune cells[24].The xCell algorithm was performed for cell-type enrichment analysis from gene expression data of 64 immune and stroma cell types[25].In this study,the CIBERSORT algorithm assessed the proportions of 22 kinds of immune cells between TACE non-responders and TACE responders.Meanwhile,the relationship between the expression of the five key genes and the 22 kinds of immune cells’ infiltration in the HCC samples from TACE non-responders was explored.The xCell algorithm evaluated the immune score,stromal score,microenvironment score and proportions of the cell types of the scRNA-seq analysis.Statistical significance requiredP< 0.05.
The exploration of potential therapeutic drugs
The pRRophetic R package was adopted to predict the half maximal inhibitory concentration (IC50) of chemotherapeutic agents antagonising HCC in the Genomics of Drug Sensitivity in Cancer database.IC50represented the effectiveness of each kind of chemotherapeutic agent inhibiting specific biological or biochemical functions.The comparison of the IC50s of the TACE non-responders group and the TACE responders group was tested byWilcoxonsigned-rank test.
RESULTS
Data collection and differentially expressed gene screening
The gene expression matrix GSE104580 including HCC samples of 66 TACE non-responders and 81 TACE-responders was obtained from the GEO database.The screening procedure can be seen in Figure 2.Additionally,a total of 3941 HCC and 3443 non-HCC samples were obtained from the TCGA,GEO,GTEx and ArrayExpress databases.The 85 studies that included HCC and non-HCC tissues were collected according to the procedure in Figure 3.The detailed information of the 84 datasets (datasets from TCGA and GTEx databases have been merged as one dataset) are listed in Supplementary Table 1.A total of 619 up-regulated and 648 down-regulated TACE-associated DEGs were screened and visualised (Figure 4A).The expression levels of the 30 top up-regulated and down-regulated DEGs were respectively performed (Figure 4B).In addition,8676 up-regulated and 7125 down-regulated HCC-associated DEGs were obtained after integrating DEGs from 85 studies.
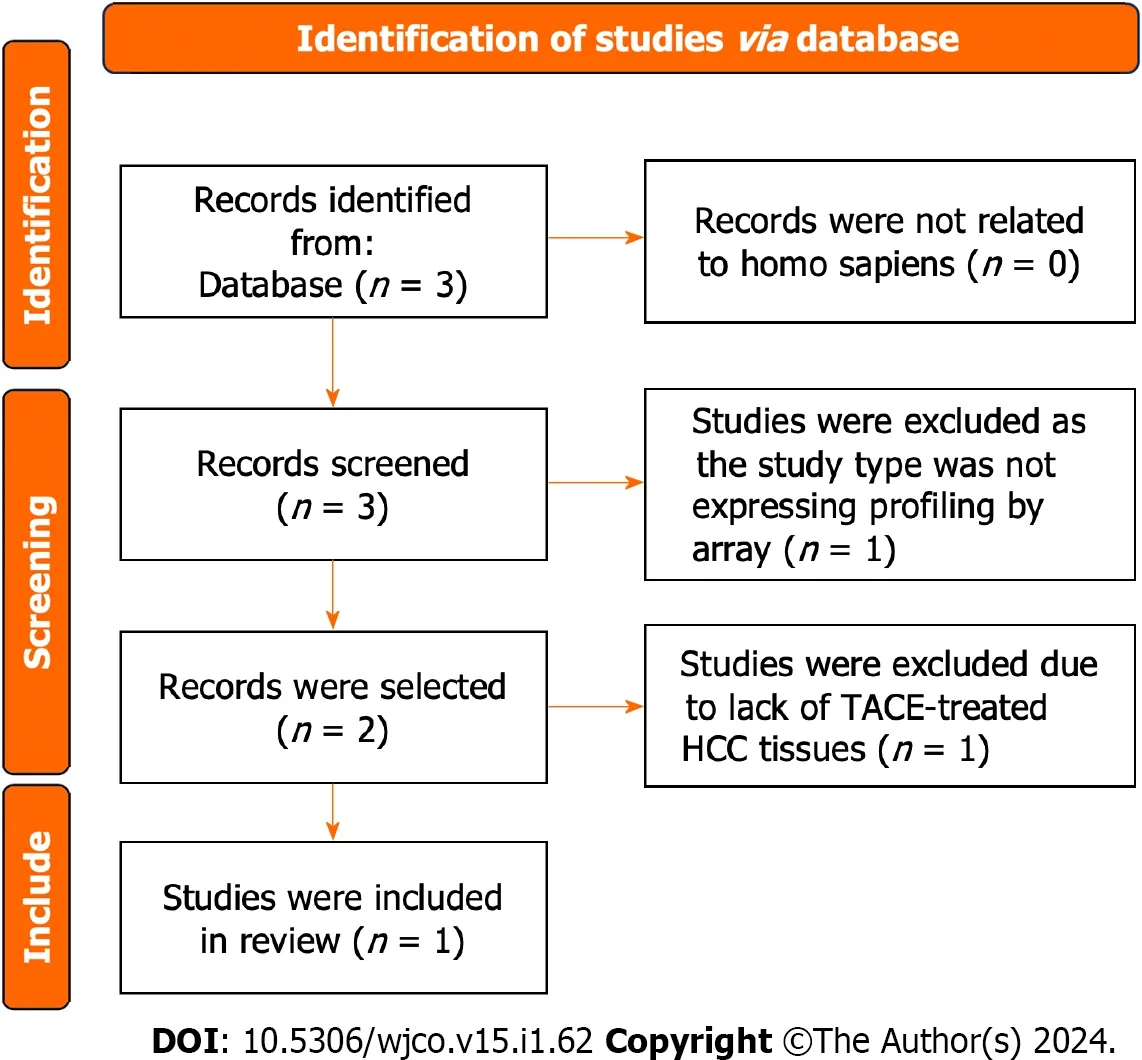
Figure 2 Flow chart showing the collection of the transcatheter arterial embolisation-treated hepatocellular carcinoma samples. Finally,one study was included.HCC: Hepatocellular carcinoma;TACE: Transcatheter arterial chemoembolization.
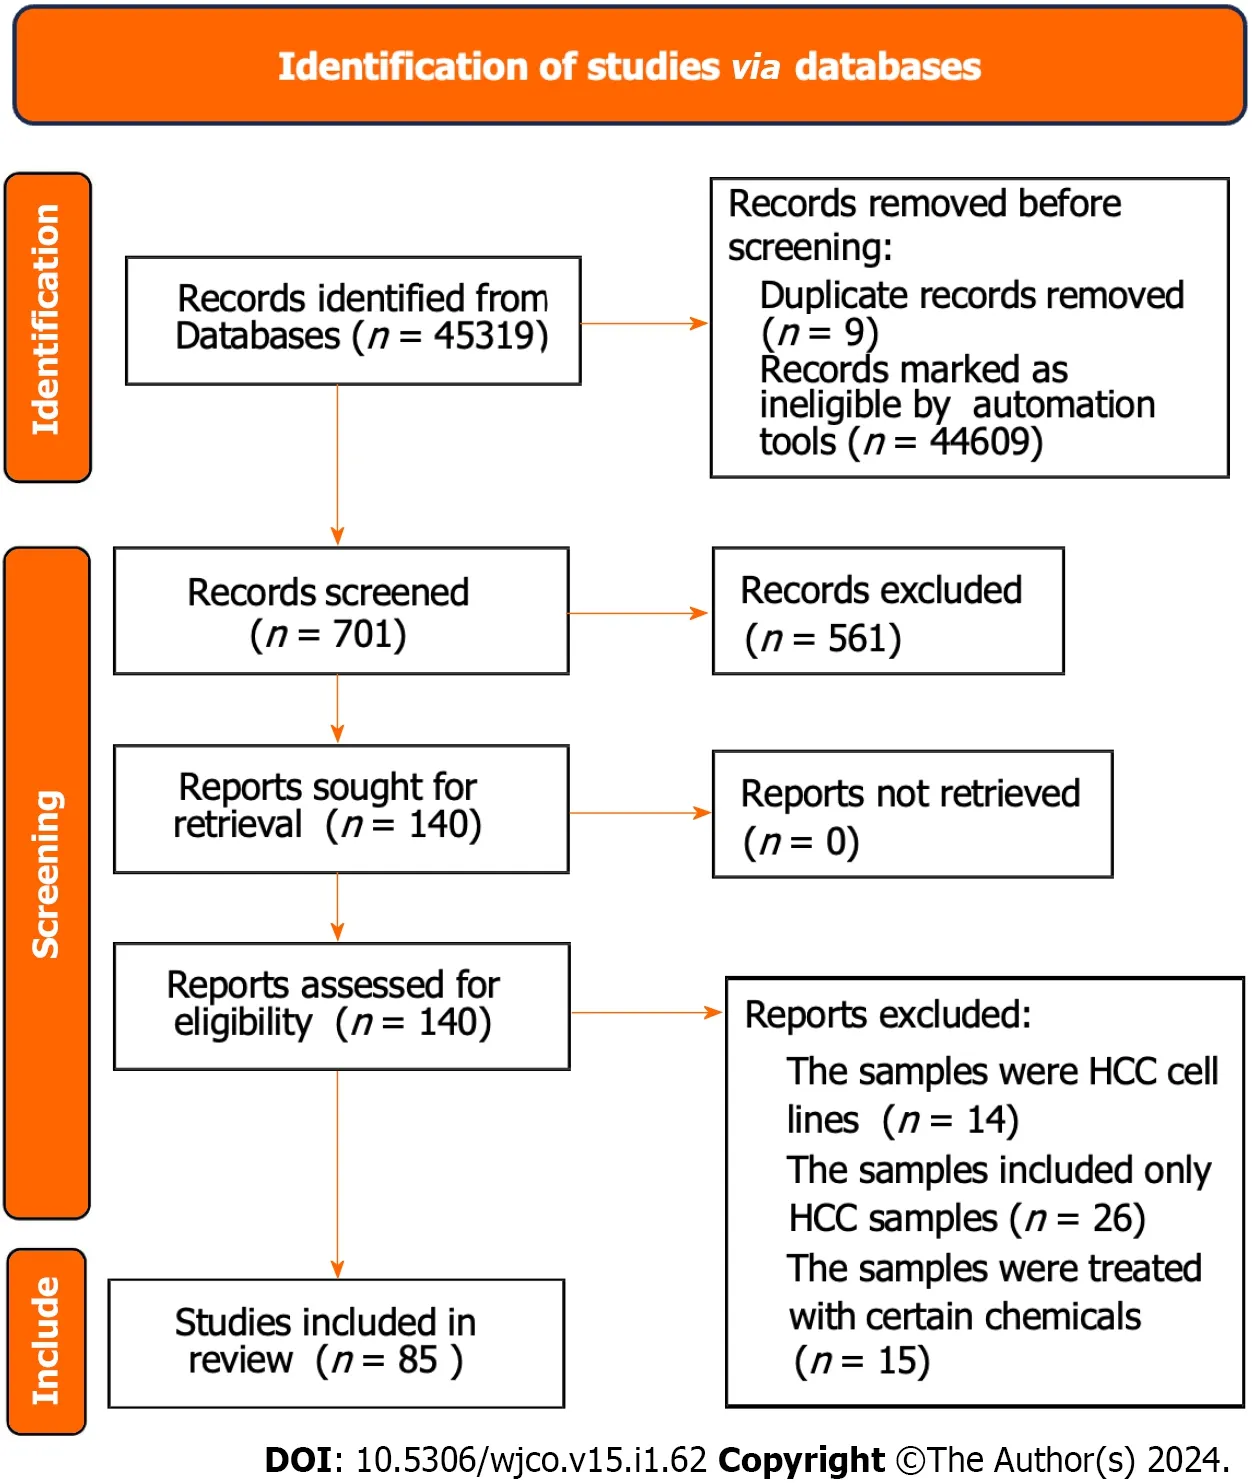
Figure 3 Flow chart of the acquisition of hepatocellular carcinoma and non-hepatocellular carcinoma samples via database. The information from 85 studies is displayed in Supplementary Table 1.HCC: Hepatocellular carcinoma.
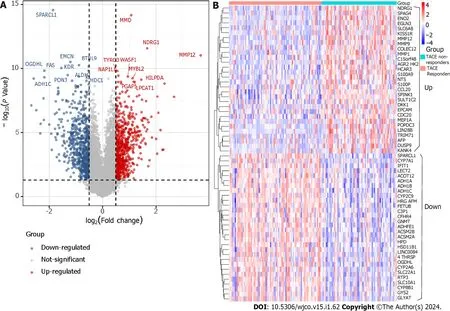
Figure 4 Differentially expressed genes screening. A: The screening of differentially expressed genes (DEGs) between transcatheter arterial embolisation (TACE) non-responders and TACE responders (TACE-associated DEGs) in GSE104580.B: The expression level of the top-30 up-regulated and down-regulated TACE-associated DEGs.
Constructing the co-expression modules
The expression file of 1267 TACE-associated DEGs and the clinical traits in GSE104580 were used for the WGCNA analysis.The soft-thresholdβ=7 with the highest scan-free topology model fit (R2=0.88) and the mean connectivity lower than 100 was set to construct a scan-free network (Figure 5A and B).Subsequently,the adjacency matrix was built and turned into a TOM to establish a gene-clustering dendrogram (Figure 5C).As shown in Figure 5C,each colour in the merge-dynamic row corresponds to a gene module after they were merged based on the cut line 0.25,and,finally,a total of five modules were identified.
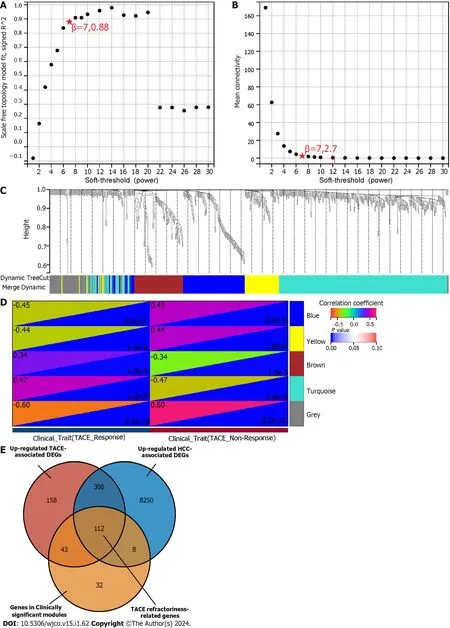
Figure 5 Weighted gene co-expression network analysis and identification of transcatheter arterial embolisation refractoriness-related genes.A: The scale-free index for various soft-threshold powers;B: Analysis of the mean connectivity for various soft-threshold powers;C: Gene clustering dendrogram,with dissimilarity based on topological overlap,together with assigned module colours;D: Module-trait association.Blue and grey modules were identified as the clinically significant modules due to their highest coefficient correlations;E: The identification of 112 TACE refractoriness-associated genes.TACE: Transcatheter arterial embolisation.
The identification of clinically significant modules and the key genes
The clinical traits,namely reactivity to TACE in GSE104580,were combined with the five identified modules to screen for the clinically significant module(s) (Figure 5D).Finally,the blue and grey modules were identified as the clinically significant modules due to having the highest correlation coefficient with the clinical trait TACE non-responders.A total of 195 genes were in the blue and grey modules.After intersecting 619 up-regulated TACE-associated DEGs,8676 upregulated HCC-associated DEGs and 195 genes in the clinically significant modules,a total of 112 shared genes were identified as TACE refractoriness-related genes for further analysis (Figure 5E).According to the scoring results from the MCC algorithm,the top-five genes had relatively high scores,while the rest had extremely low scores.To ensure reliability and accuracy,we selected the top-five genes as the key genes among the TACE refractoriness-related genes.The five key genes,DLG associated protein 5 (DLGAP5),Kinesin family member 20A (KIF20A),Assembly factor for spindle microtubules (ASPM),Kinesin family member 11 (KIF11) and TPX2 microtubule nucleation factor (TPX2),were identified using the MCC methods in the CytoHubb plugin contained in Cytoscape software (Figure 6A).
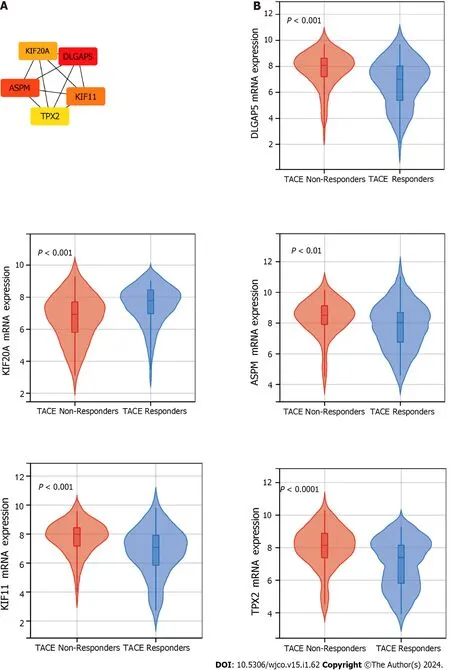
Figure 6 The identification and mRNA expression of five key genes in transcatheter arterial embolisation treated hepatocellular carcinoma. A: Five key genes were identified using Maximal Clique Centrality method of the cytoHubba plugin.B: The mRNA expression level of the five key genes in hepatocellular carcinoma samples of transcatheter arterial embolisation (TACE) non-responders and TACE responders.DLGAP5: DLG-associated protein 5;KIF20A: Kinesin family member 20A;ASPM: Assembly factor for spindle microtubules;KIF11: Kinesin family member 11;TPX2: TPX2 microtubule nucleation factor.
The expression validation of key genes in TACE-treated HCC samples
To ascertain the key genes’ differential expression in the HCC samples of the TACE non-responders and TACE responders,the mRNA expression of DLGAP5,KIF20A,ASPM,KIF11 and TPX2 was analysed.The results showed that the five key genes were all more highly expressed in the TACE non-responders group compared with TACE responders group (Figure 6B).
The expression validation of key genes in HCC via integrated data
After integrating all enrolled data including HCC and non-HCC tissues,we found that the SMD and 95%CI of the five key genes under random effects were as follows: DLGAP5 (SMD: 1.54,95%CI: 1.38-1.90),KIF20A (SMD: 1.88,95%CI: 1.63-2.13),ASPM (SMD: 2.00,95%CI: 1.74-2.25),KIF11 (SMD: 1.45,95%CI: 1.20-1.70) and TPX2 (SMD: 1.64,95%CI: 1.43-1.85) (Figure 7).These indicated that the expression level of the five key genes was remarkably higher in the HCC than in the non-HCC tissues.The protein expression of key genes DLGAP5,KIF20A,KIF11 and TPX2 in the HCC tissues was higher than in the non-HCC tissues (Figure 8).The IHC resource for protein expression of ASPM was lack in THPA database.
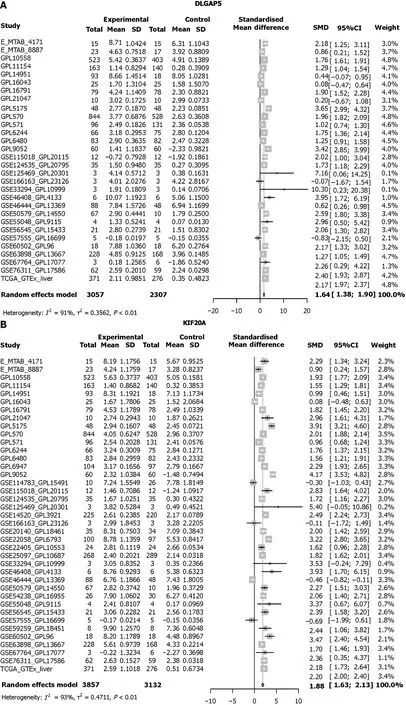
Figure 7 The expression of five key genes in hepatocellular carcinoma. A-E: The expression level of the five key genes in hepatocellular carcinoma (HCC) samples via the integration of all of the included HCC samples.DLGAP5: DLG associated protein 5;KIF20A: Kinesin family member 20A;ASPM: Assembly factor for spindle microtubules;KIF11: Kinesin family member 11;TPX2: TPX2 microtubule nucleation factor;SD: Standard deviation;SMD: Standard mean difference;CI: Confidence interval.
The prognostic value of key genes
TPX2 was considered an independent prognostic factor in HCCviamultivariate analysis (Figure 9A).The results showed that a high expression of the key genes was correlated with a low overall survival.To verify the key genes participating in HCC poor prognosis,the survival curves are shown in Figure 9B-F.In addition,HR was as follows: DLGAP5 (HR: 2.197,P< 0.0001),KIF20A (HR: 3.940,P< 0.0001),ASPM (HR: 2.702,P=0.0011),KIF11 (HR: 4.021,P< 0.0001) and TPX2 (HR: 3.287,P< 0.0001).
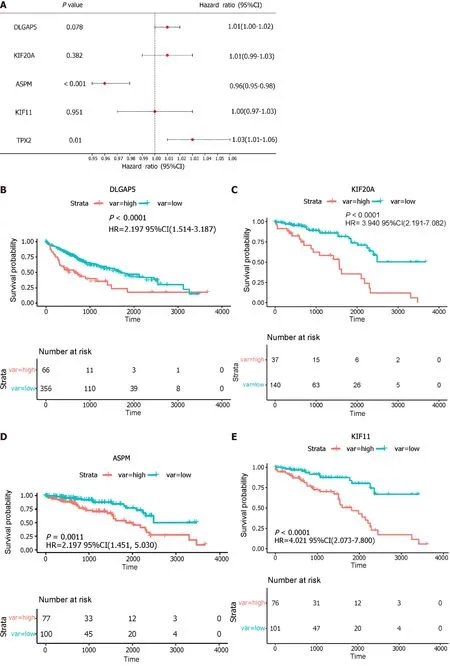
Figure 9 The Kaplan-Meier curve analysis. A: The multivariate analysis of five key genes;B-F: Survival curves for the five key genes.DLGAP5: DLG associated protein 5;KIF20A: kinesin family member 20A;ASPM: Assembly factor for spindle microtubules;KIF11: Kinesin family member 11;TPX2: TPX2 microtubule nucleation factor;HR: Hazard ratio;CI: Confidence interval.
GO enrichment and pathway analysis
For BP,the 112 TACE refractoriness-related genes were mainly enriched in nuclear division,organelle fission,mitotic nuclear division,chromosome segregation and mitotic sister chromatid segregation.CC involved spindle,chromosomal region,chromosome,centromeric region,microtubule and midbody.As for MF,these TACE refractoriness-related genes were associated with microtubule binding,tubulin binding,microtubule motor activity,cytoskeletal motor activity and peptidase regulator activity (Figure 10A).With regards to the pathways,these TACE refractoriness-related genes were mainly active in cell cycle pathways in the KEGG pathway enrichment analysis,and the relevant reactome pathways are shown in Figure 10B.
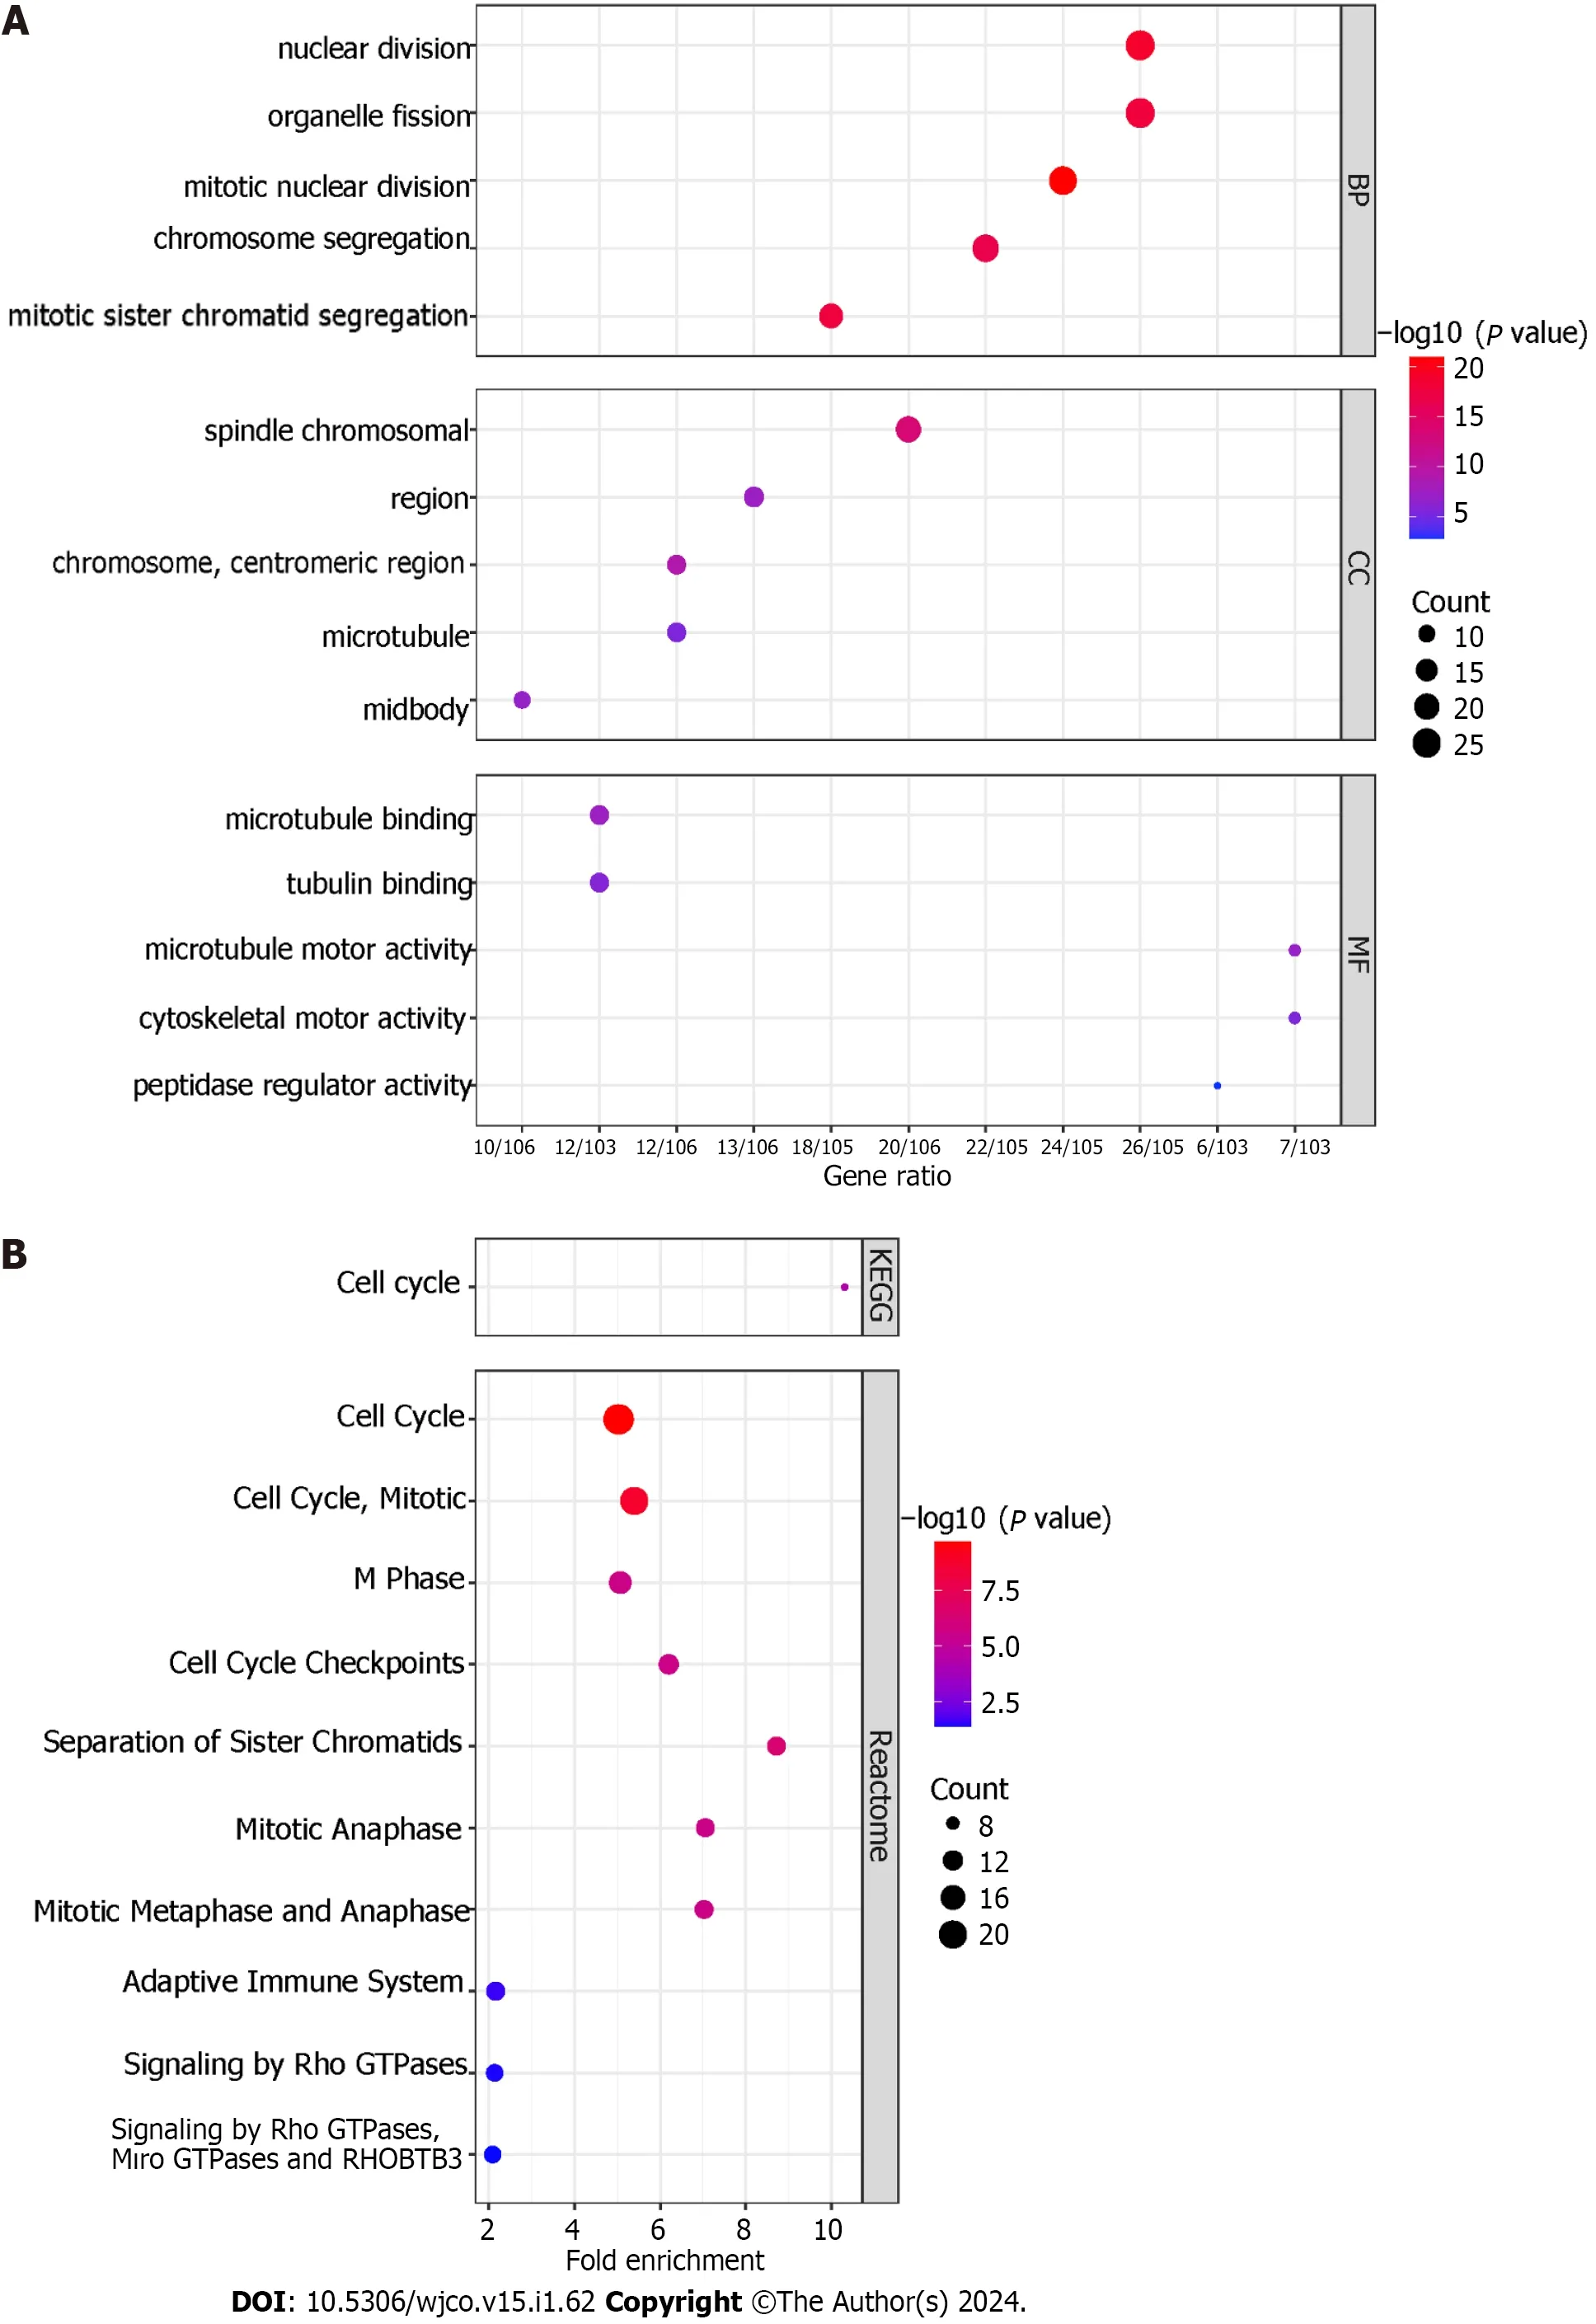
Figure 10 Enrichment analysis. A: Gene Ontology analysis of transcatheter arterial chemoembolisation (TACE) refractoriness-related genes.The top-five biological processes,the top-five cellular components,and the top-five molecular functions are shown;B: The Kyoto Encyclopaedia of Genes and Genomes and Reactome pathways of TACE refractoriness-related genes.
ScRNA analysis and AUCell
The dataset GSE103867 satisfied our requirements and was obtained for scRNA analysis.After quality control,a total of 3363 cells from HCC samples were identified.Four cell types were identified: hepatocytes,embryonic stem cells,T cells and B cells (Figure 11A).The expression level of five key genes in the four cell types is shown in Figures 11B and C.The AUCell R package was used for determining the TACE refractoriness-related activity in each cell line (Figure 11D).TACE refractoriness-related genes were mainly active in hepatocytes and embryonic stem cells (Figure 11E).
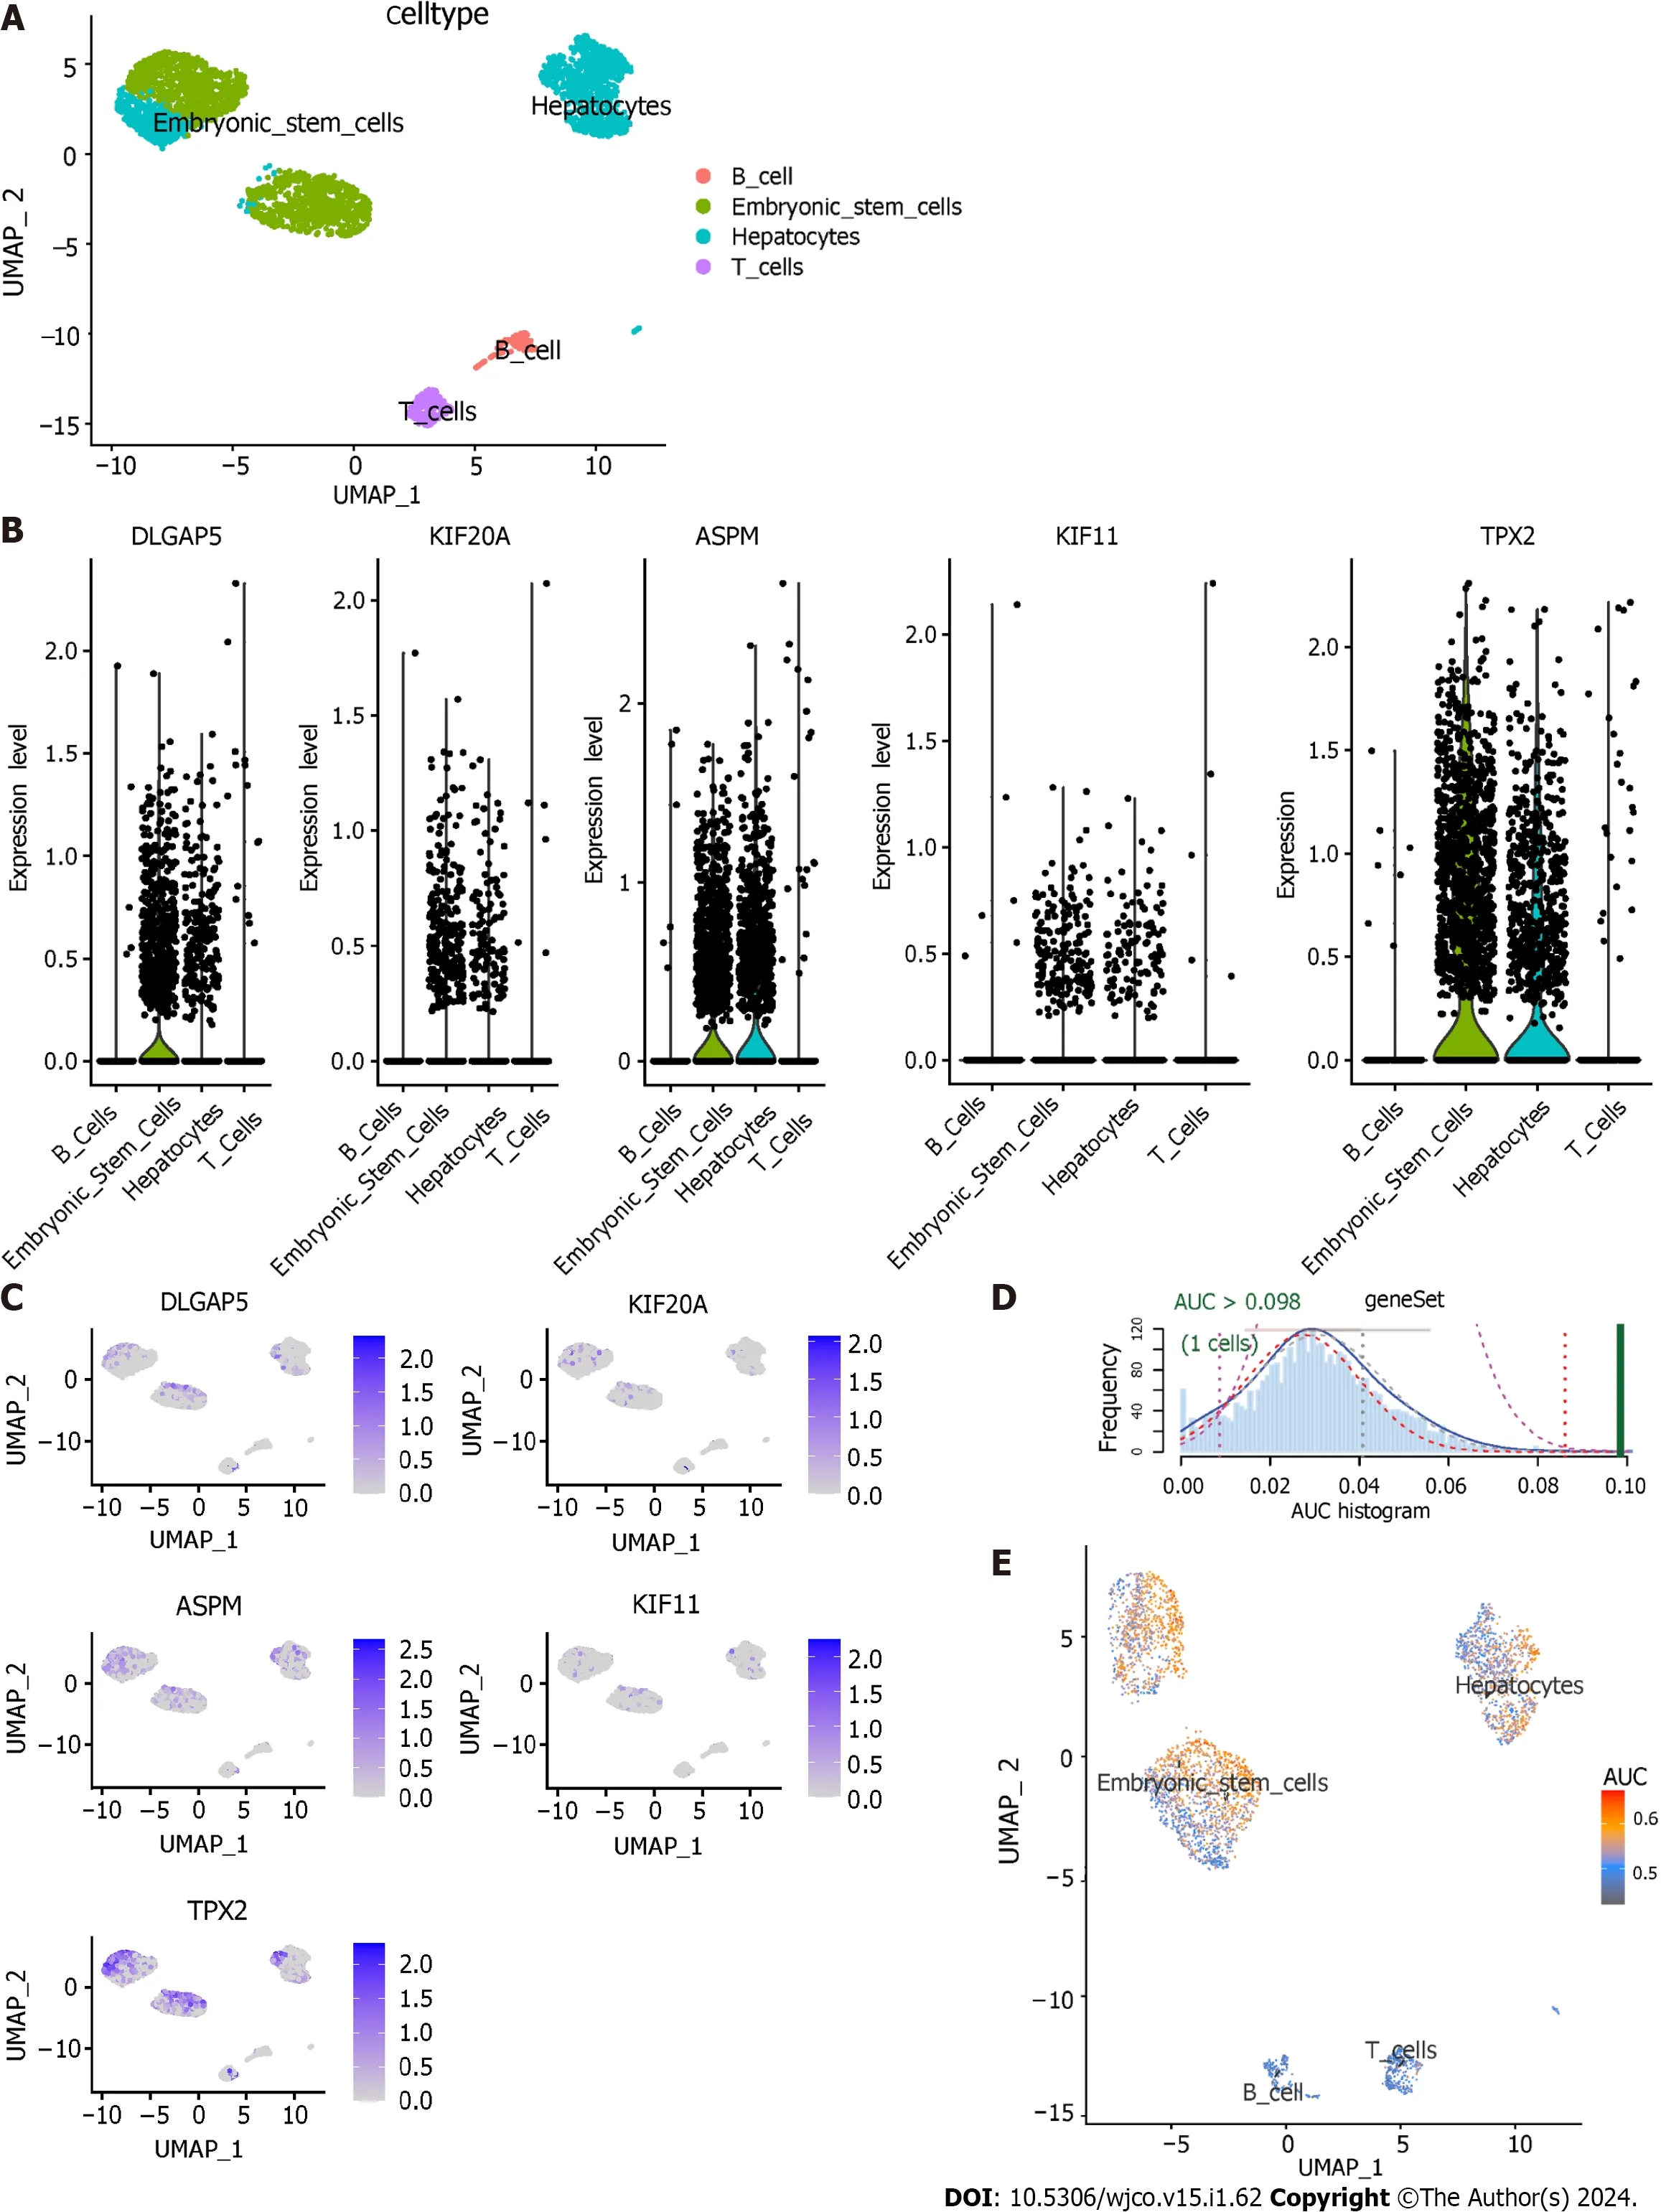
Figure 11 Single-cell RNA sequencing analysis and AUCell. A: Uniform manifold approximation and projection (UMAP) plot showing four cell types in hepatocellular carcinoma samples;B: Violin plots showing the expression level of five key genes in four cell types.C: Expression level of five key genes in four cell types were drawn on UMAP;D: AUCell score distribution curves of 112 transcatheter arterial chemoembolisation (TACE) refractoriness-related genes;E: Scatter plot showing the distribution of AUCell scores in 112 TACE refractoriness-related genes.DLGAP5: DLG associated protein 5;KIF20A: Kinesin family member 20A;ASPM: Assembly factor for spindle microtubules;KIF11: Kinesin family member 11;TPX2: TPX2 microtubule nucleation factor;AUC: Area under the curve.
Prediction of cell-cell communication
As shown in Figure 12A-F,hepatocytes as providers of ligands and embryonic stem cells as the providers of receptors had the highest interaction strength.When hepatocytes expressed ligands and embryonic stem cells provided the corresponding receptors,some ligand-receptor pairs like MDK-SDC2 and MDK-NCL had the greatest communication probability of accomplishing cell-cell communication (Figure 12G).

Figure 12 Cell-cell communication.A and B: The aggregated intercellular communication between any two cell groups.The colours of the periphery circle referred to one cell group and the vertex of periphery circle represented the numbers of cells.The cells in the starting site of edge expressed ligand and the cells the arrow pointed in expressed receptor.The thickness of the line signified the numbers of ligand-receptor pairs,and the thicker the line meant more ligand-receptor pairs;B: The thickness of edge represented the interaction strength of any two cell groups.The thicker the edge was,the bigger the interaction strength;C-F: The intercellular communication of each cell group.Hepatocytes providing ligands had strongest communication with embryonic stem cells that expressed receptors;G: The identification of ligand-receptor pairs between hepatocytes and embryonic stem cells.(Ligands provider)→(receptors provider).
Immune landscape exploration for refractory TACE-treated HCC
TACE non-responders had a higher level of infiltration of follicular helper T cells,macrophages M0 and active mast cells than TACE responders.While TACE non-responders were associated with a lower level of infiltration of active memory CD4+T cells,macrophages M1 and M2 macrophages (Figure 13A).The analysis of the connection between the expression of key genes and the infiltration of 22 kinds of immune cell in CIBERSORT algorithm was performed (Figure 13B-F).The correlation among hepatocytes,phenotypes of T cells and phenotypes of B cells was computed using the xCell algorithm (Figure 14A).TACE non-responders were calculated as having lower stroma and microenvironment scores (Figure 14B).
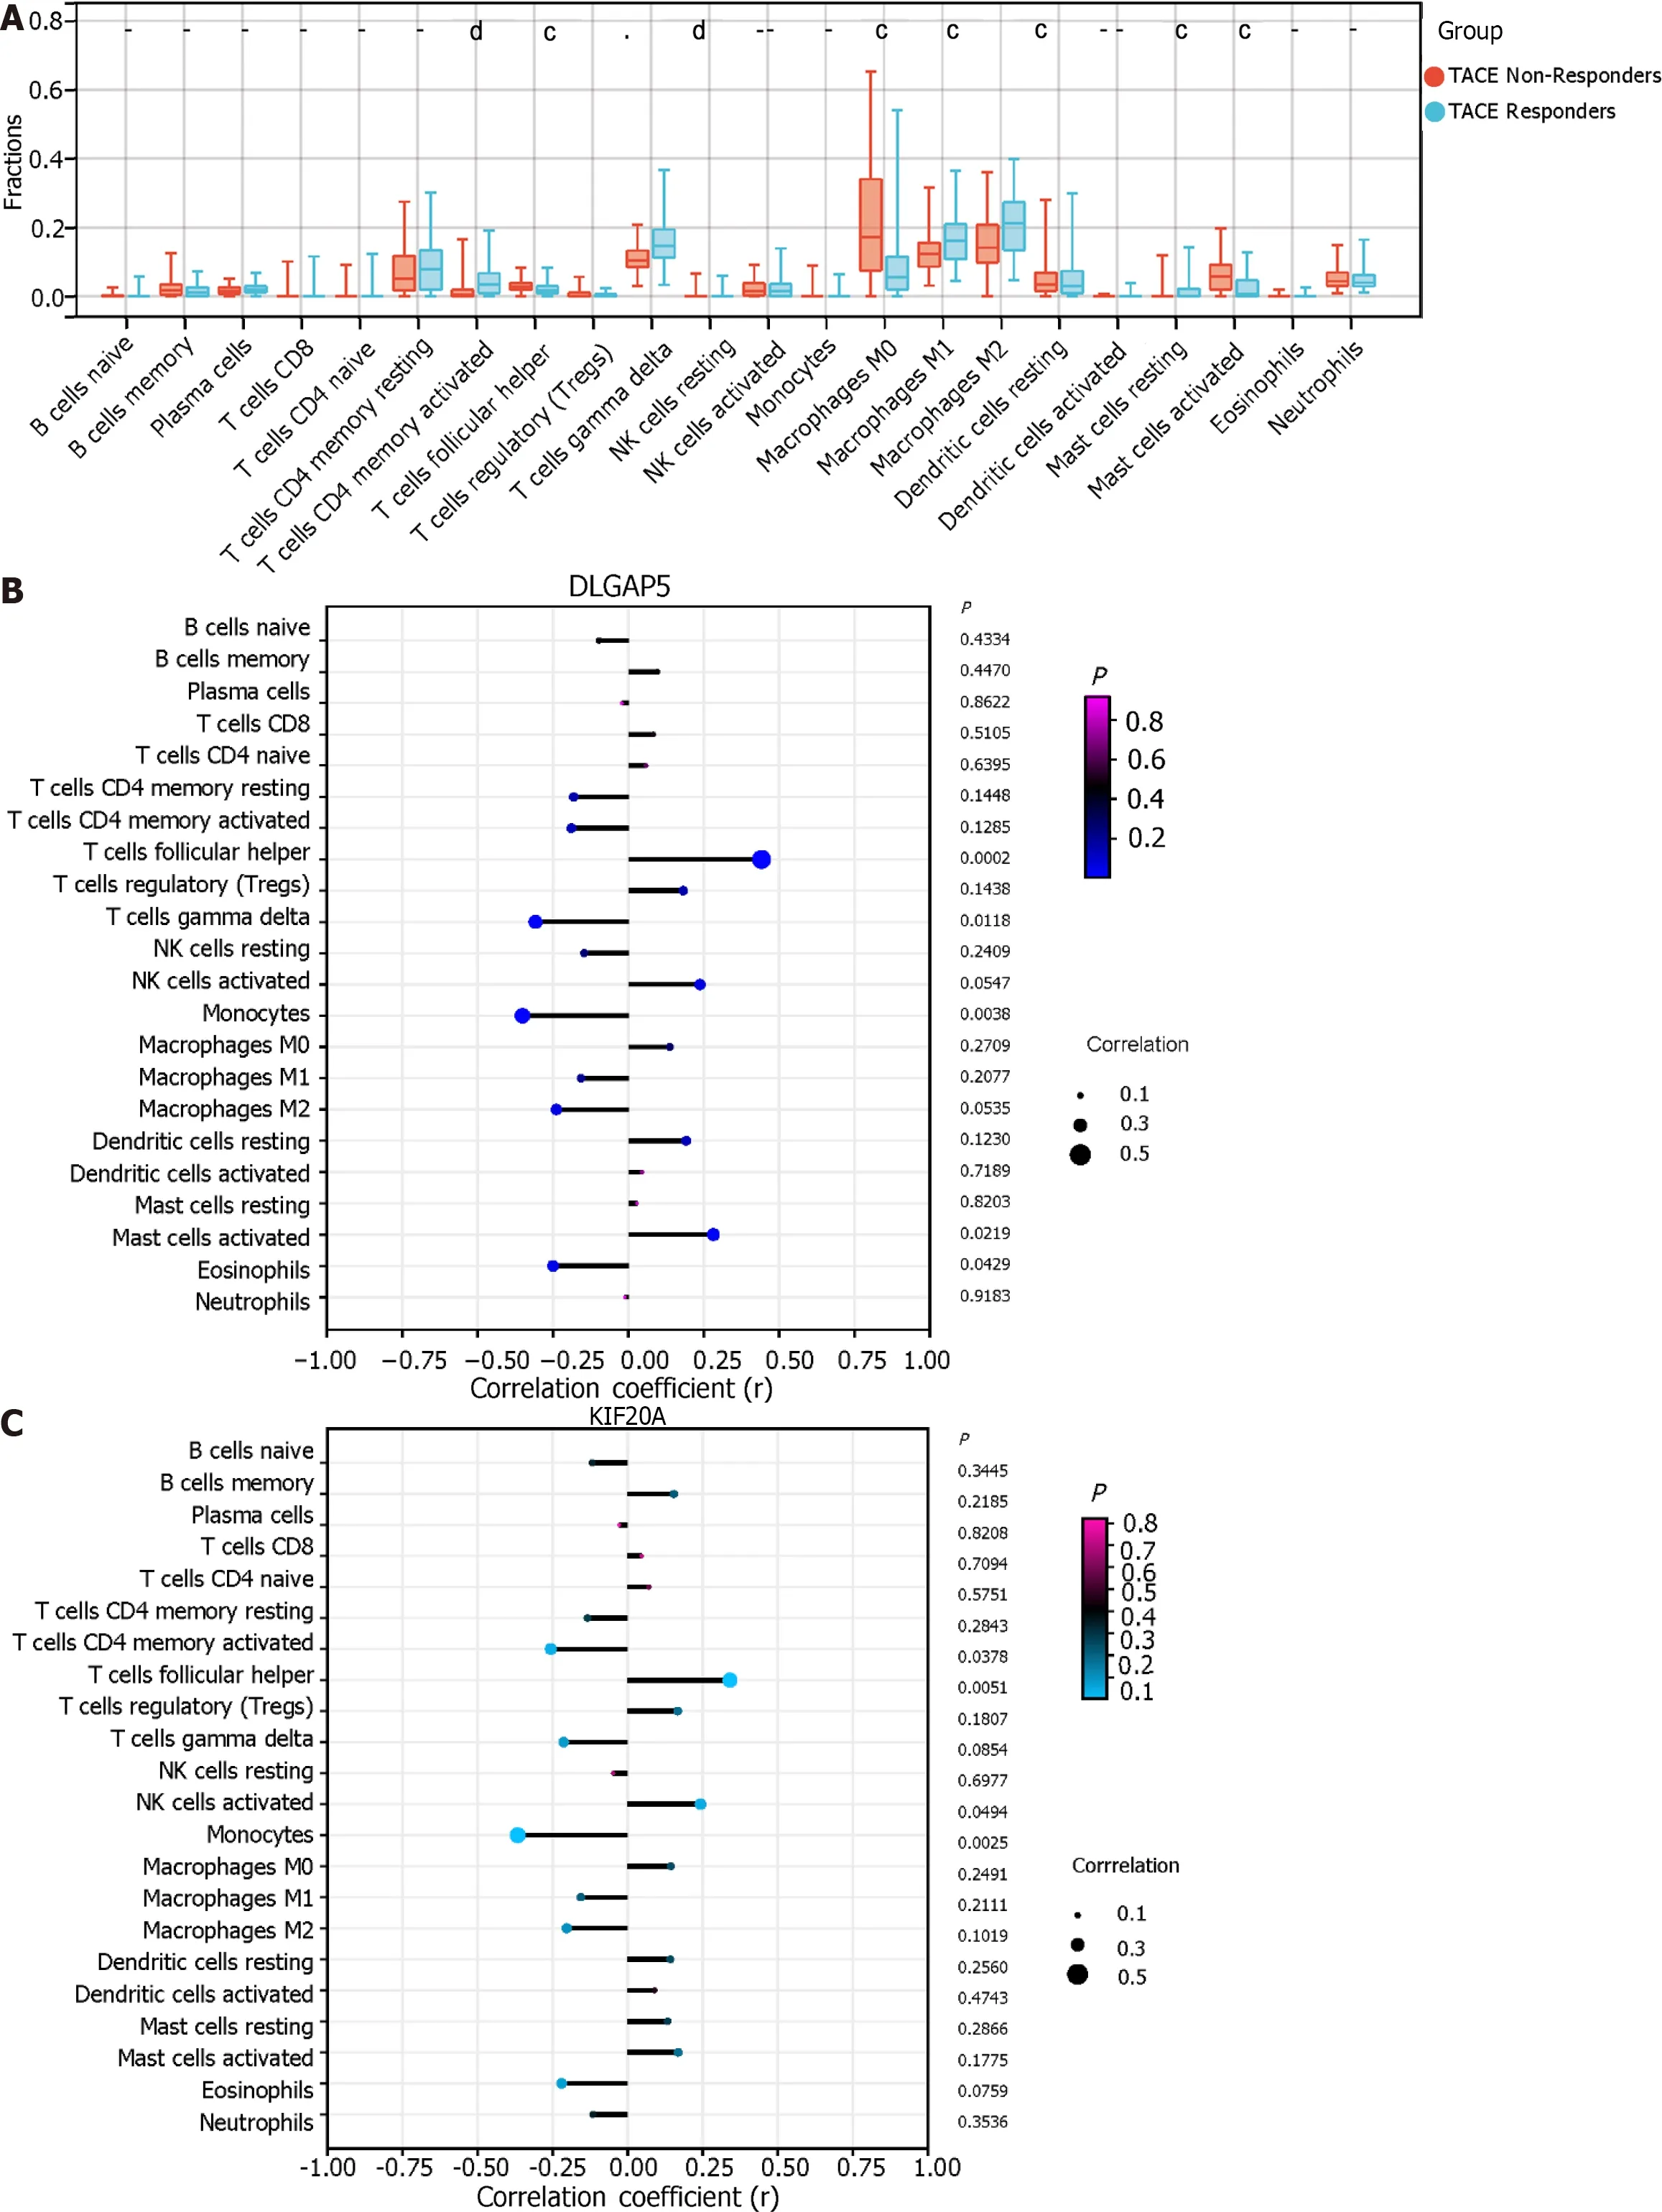
Figure 13 lmmune infiltration analysis. A: The immune landscape of 22 kinds of immune cells between transcatheter arterial chemoembolisation (TACE) nonresponders and TACE responders using CIBERSORT algorithm.(aP < 0.05,bP < 0.01,cP < 0.001,dP < 0.0001);B-F: The relationship between expression of five key genes and the infiltration of 22 kinds of immune cells in TACE non-responders group.DLGAP5: DLG associated protein 5;KIF20A: Kinesin family member 20A;ASPM: Assembly factor for spindle microtubules;KIF11: Kinesin family member 11;TPX2: TPX2 microtubule nucleation factor;AUC: Area under the curve.
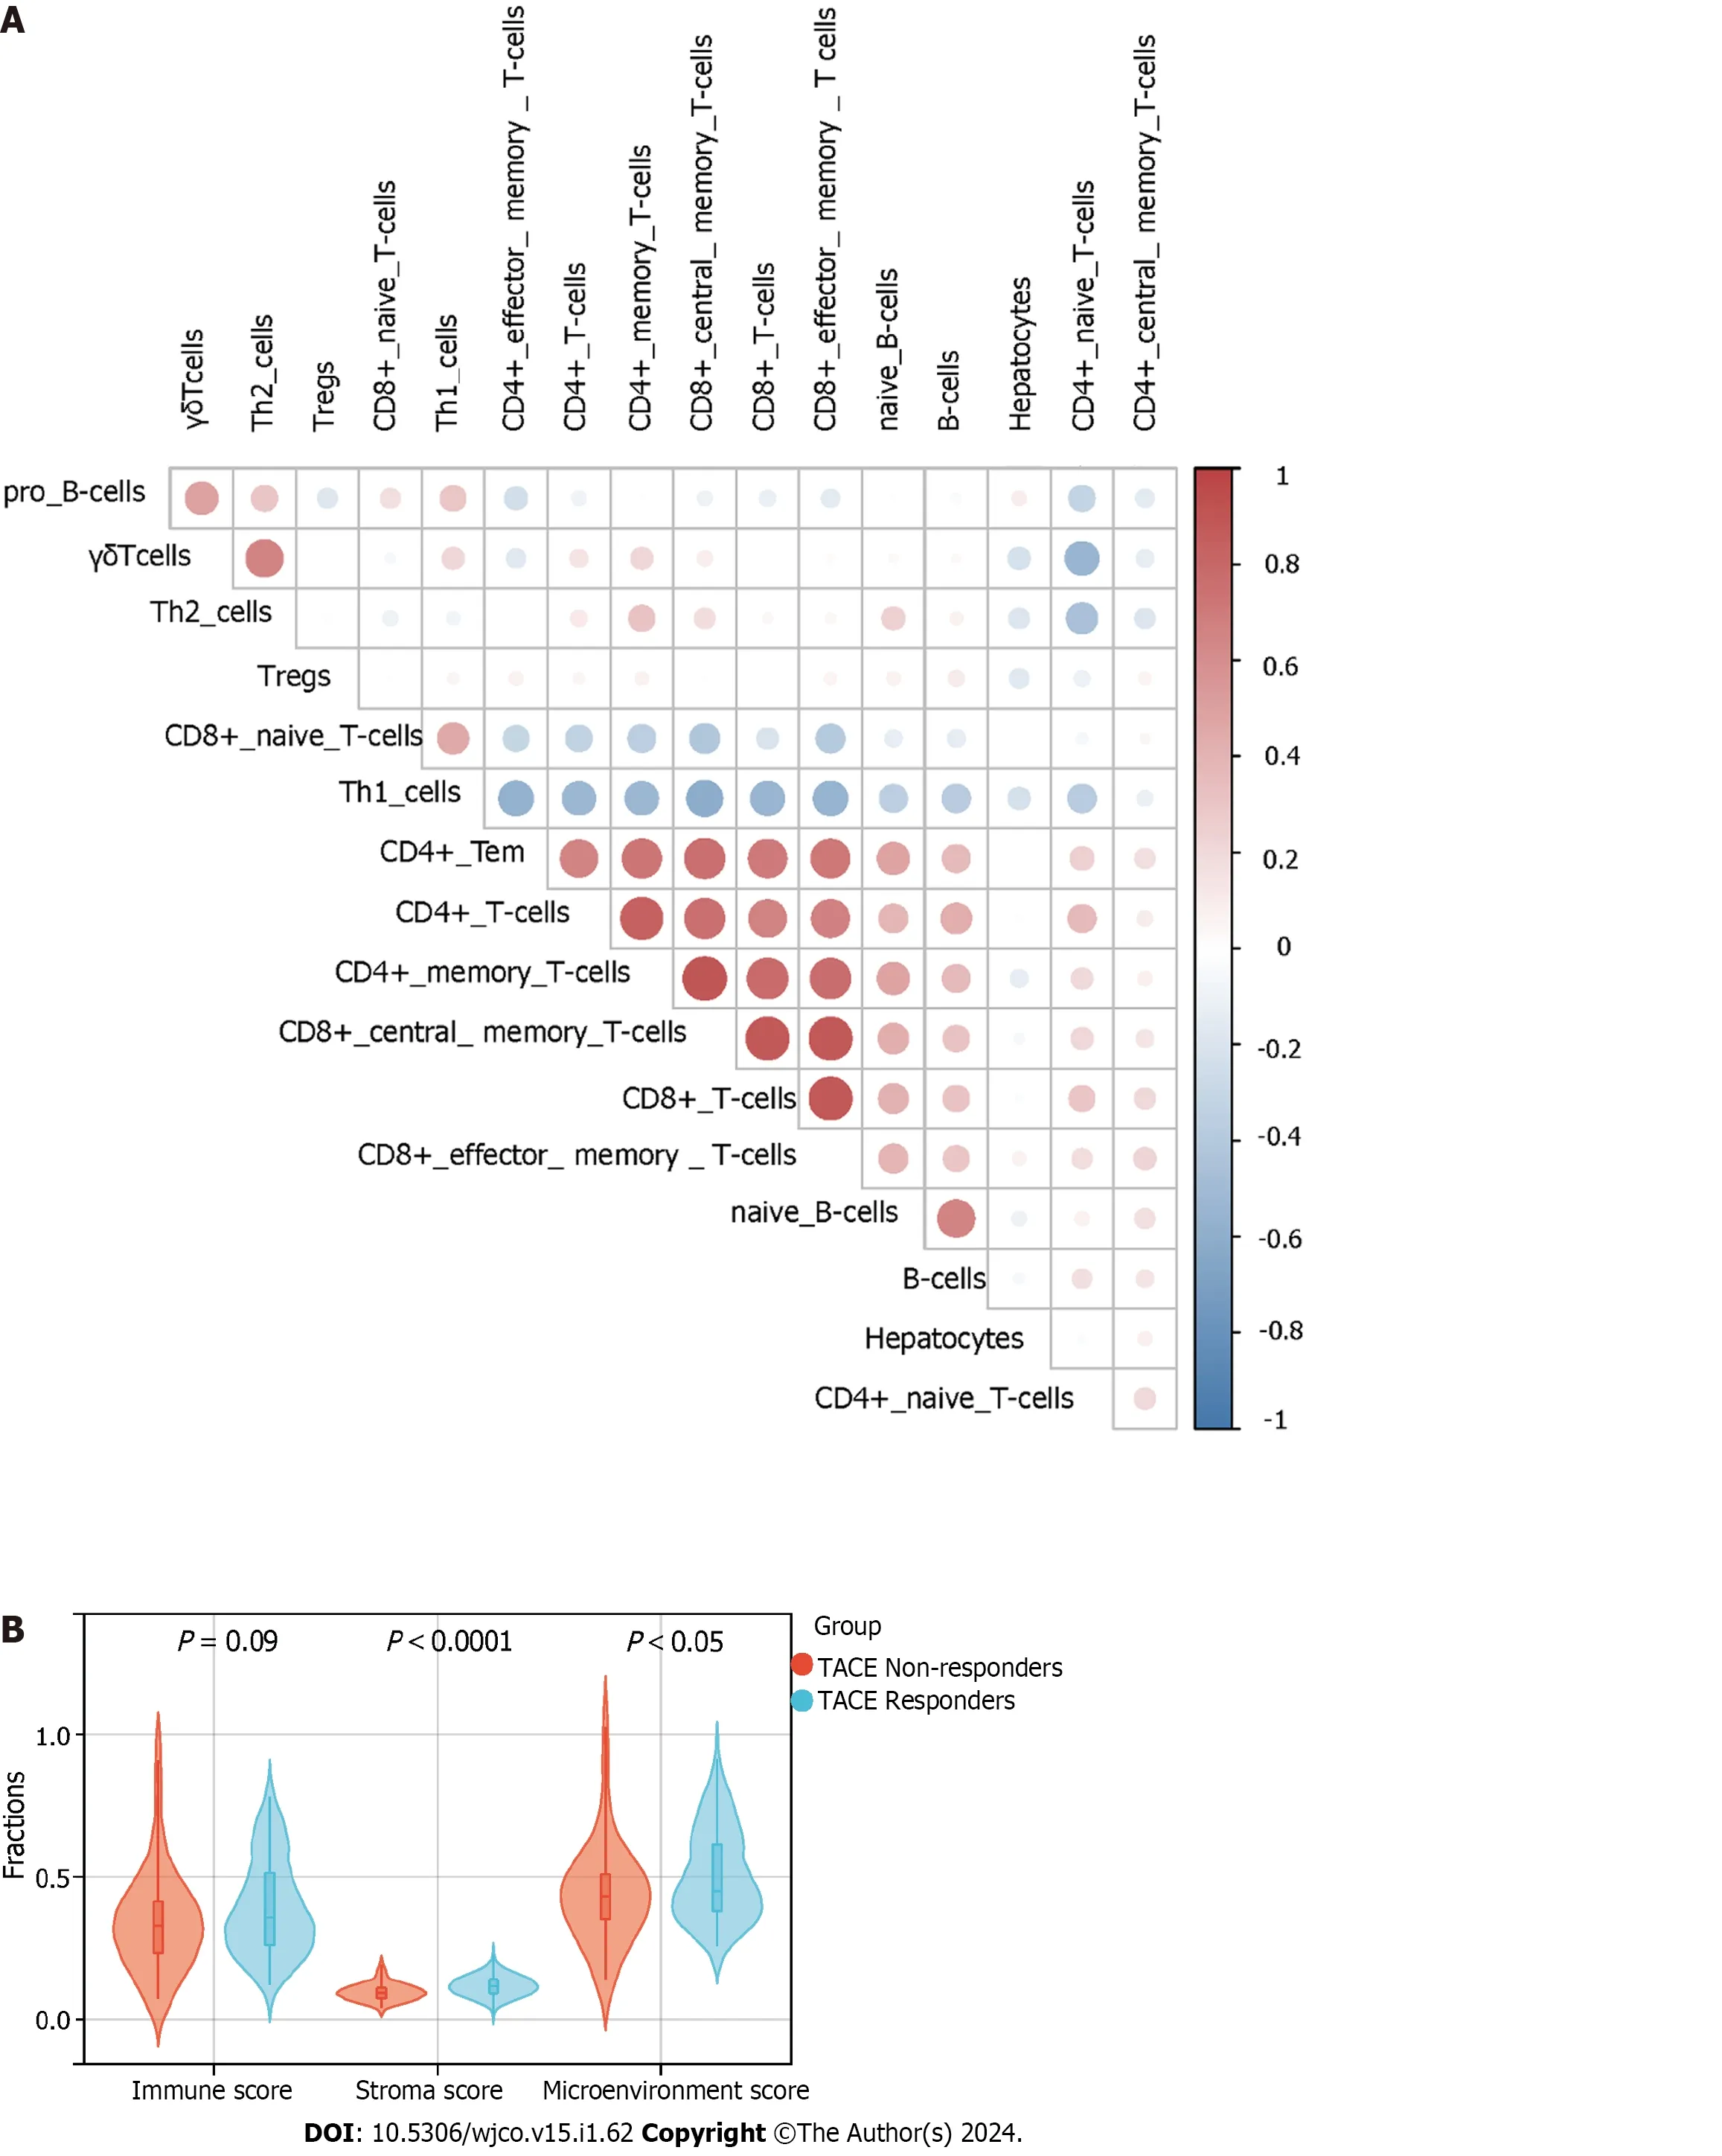
Figure 14 xCell immune infiltration analysis. A: The correlation between hepatocytes,phenotypes of T cells and phenotypes of B cells by xCell algorithm;B: The comparison of immune,stromal and microenvironment score between transcatheter arterial chemoembolisation (TACE) non-responders and TACE responders by xCell algorithm.
The potential therapeutic drugs discovery
There were 27 kinds of drugs used in the treatment of HCC in the pRRophetic R package.The IC50values of the 27 chemotherapeutics were compared between TACE non-responders and TACE responders.Five chemotherapeutics (CCT007093,Dasatinib,Erlotinib,Bortezomib and Lapatinib) had the potential for reversing TACE non-response (Figure 15).
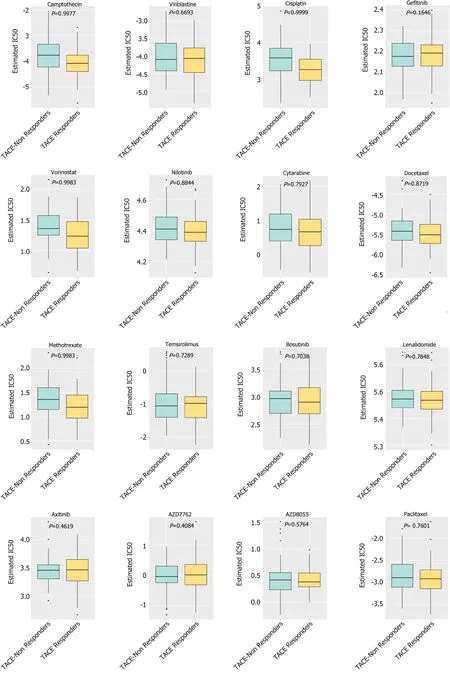
Figure 15 The prediction of potential drugs for refractory transcatheter arterial chemoembolisation treated hepatocellular carcinoma. IC50: Half maximal inhibitory concentration.
DlSCUSSlON
In this study,we have achieved the following targets: (1) Five key genes (DLGAP5,KIF20A,ASPM,KIF11 and TPX2) were identified among TACE refractoriness-related genes and all overexpressed in the TACE non-responders group and the HCC group;(2) a higher expression of five key genes predicted a worse overall survival (OS) probability in HCC,and TPX2 was considered to be an independent prognostic factor in HCC;(3) cell cycle pathway was likely to play a role in resisting TACE therapy with enrichment analysis using TACE refractoriness-related genes;(4) four cell types,hepatocytes,embryonic stem cells,T cells and B cells,were identified in HCC samplesviascRNA sequencing analysis,and hepatocytes and embryonic stem cells were seen as possibly promoting TACE refractorinessviaAUCell and CellChat analysis;(5) the immune environment landscapes of the TACE non-response group and the TACE response group were revealed;(6) some compounds,like CCT007093,Dasatinib,Erlotinib,Bortezomib and Lapatinib,might be effective for the TACE non-response group according to drug-sensitivity analysis.
Some advanced imaging techniques have been reported as predicting the therapeutic response of TACE in HCC through the detection of liver hemodynamics,water molecule diffusion capacity,metabolic changes and blood-oxygen level[26].One study found that the blood-oxygen level significantly decreased in the cancerous region of 30 HCC patients after receiving TACE but saw no notable changes in 30 healthy volunteers[27].TACE creates a hypoxic microenvironment due to arterial embolisation,which contributes to a surge in the vascular endothelial growth factor,p53,which enlarges tumour size and decreases the survival rate[28,29].Chengetal[30] found that TPX2,as one of the hypoxia-related genes,was obviously and clearly expressed in a high-risk HCC group and participated in TACE refractoriness.Our study has identified TPX2 as a key gene for possibly inducing TACE refractoriness.
On the basis of some studies,autophagy may be a significant mechanism mediating the therapeutic efficacy of TACE in HCC.Autophagy protects the cancer cells from abominable conditions such as hypoxia,starvation and cell apoptosis induced by chemotherapy and enhances the cancer cells’ resistance to hypoxic and chemotherapy[27].Maoetal[29] demonstrated that apoptosis-stimulating p53 protein 2 (ASPP2) was low-expression in recurrent HCC patients after TACE treatment and confirmed that ASPP2,as a co-expression factor of the cancer suppressor p53,was responsible for decreasing the autophagy maker Beclin-1.Gaoetal[31] concluded that TACE in combination with the autophagic inhibitor chloroquine shown to be more efficient at curing tumours in rabbit liver than TACE alone.
Further investigation of research showed that MicroRNA (miRNA) also has a substantial effect on the low therapeutic efficacy of TACE in HCC.Weietal[20] found that down-regulated miR-125b was related to the recurrence of HCC after TACE treatment.They concluded that the low miR-125b expression attenuated the HIF1α translation to activate the HIF1 α/pAKT loop and block the autocrine HIF1α/platelet-derived growth factor β (PDGFβ)/pAKT/HIF1α loop of HIF1α translation by targeting PDGFβ.Tumour-initiating cells (T-ICs) or cancer stem cells (CSCs) are a phenotype of cancer cells with a self-renewal and tumorigenesis faculty[32].T-ICs and CSCs are connected to cancer proliferation and anti-cancer therapy resistance[33].Clinical cohort analysis indicates that HCC patients with high miR-186 expression benefit from TACE[34].Yaoetal[34] found that a miR-186 knockdown led to the expansion of CSCs while a high expression of miR-186 inhibited the process.Additionally,other miRNA,like miR-26a,miR-107 and miR-106,were differentially expressed between TACE non-responders and TACE responders,and their differential expression was correlated with OS and progression-free survival[35].
Consistent with the description above,the engagement of T-IC and CSCs is another critical mechanism in the resistance of TACE in HCC.Zengetal[36] stated that the CSC makers like epithelial cell adhesion molecule had a higher expression in TACE-treated specimens than non-TACE specimens,which indicated that HCC with abundant CSCs phenotype had a high risk of recurrence after TACE treatment.Subsequently,Xiangetal[37] explained that a low expression of Srchomology 2 domain-containing phosphatase 2 (Shp2) was favourable for a high therapeutic effect from TACE.As for the mechanism,they found that Shp2 appeared in sorted epithelial cell adhesion molecule-positive or clusters of differentiation 133-positive liver CSCs and in CSC-enriched hepatoma spheroids from patients,and that a high expression of Shp2 promoted the proliferation of liver CSCs by enhancing an accumulation of β-catenin[37].Some transcription factors of embryonic stem cells had the ability to regulate the CSCs in pancreatic cancer[38].Zhouetal[39] identified some potential methylation-related genes that become enriched in the embryonic stem cell pathway to characterise HCC,which indicated embryonic stem cells might play a role in HCC progression.The derivatives of embryonic stem cells were able to generate hepatocytes[40].Hepatocytes were found to create a profound metabolic rewiring when preparing to proliferate in HCC[41].However,there was little evidence to show the function of hepatocytes and embryonic stem cellsin TACE refractoriness.
The metabolic process is considered to play a part in the occurrence of TACE refractoriness in HCC.Aberrant glutamine metabolism (GM) is involved in tumorigenesis and poor prognosis[42,43].Yingetal[43] employed 41 GMassociated genes to construct a transcriptome-based approach named ‘GM score’ and validated it using two independent HCC cohorts.The results showed that a high GM score had a positive correlation with a slim OS of HCC patients after TACE treatment.Therefore,it is plausible that the metabolic process and immune infiltration level may be connected to TACE refractoriness in HCC.
In this study,five key genes have been identified as being highly correlated with TACE refractoriness in HCC,and its potential mechanisms have been discussed.However,some limitations exist in this study.Firstly,although the five key genes (DLGAP5,KIF20A,ASPM,KIF11 and TPX2) were verified as being associated with TACE refractoriness,the clinical applicability of these genes requires more cases as confirmation due to the limited number of TACE-treated patients in this study and the heterogeneity in the diagnosis.Secondly,due to insufficient samples of HCC cells and stroma treated by TACE,we have no scope for the further validation of the five key genes.Thirdly,the results of the AUCell analysis that TACE refractoriness-related genes were mainly active in hepatocytes and embryonic stem cells require further verification due to only one cell reaching the AUC threshold of TACE refractoriness-related genes list.Lastly,the potential mechanisms identified also need further proof through additional vivo and vitro experiments.
CONCLUSlON
Five key genes (DLGAP5,KIF20A,ASPM,KIF11 and TPX2) were all up-regulated to facilitate TACE refractoriness.Hepatocytes and embryonic stem cells had intimate intercellular communication and were likely to boost TACE refractoriness.CCT007093,Dasatinib,Erlotinib,Bortezomib and Lapatinib possibly played a curable role in TACE nonresponders.
ARTlCLE HlGHLlGHTS
Research background
Transcatheter arterial embolisation (TACE) is a primary therapeutic strategy for hepatocellular carcinoma (HCC) patients in the intermediate and advanced stages.In China,TACE refractoriness is defined as the intrahepatic target lesion that remains in a disease progression state after receiving standardised and refined TACE treatment for three or more times consecutively.
Research motivation
It is essential to identify biomarkers for predicting TACE refractoriness and to explore the potential mechanisms of TACE refractoriness.
Research objectives
The purpose of our study is to identify the key genes associated with TACE refractoriness and investigate the potential mechanisms of TACE refractoriness.
Research methods
The gene expression profile was obtained from the public databases.Weighted gene co-expression network analysis and the cytoHubba plugin were utilised to identify the key genes in TACE refractoriness.Multivariate Cox regression and Kaplan-Meier were employed.ScRNA analysis was used for exploring the potential mechanisms of TACE refractoriness.
Research results
Five key genes (DLGAP5,KIF20A,ASPM,KIF11,and TPX2) were all up-regulated in TACE non-responders,which predicted poor prognosis.TPX2 is recognised as an independent prognostic factor.TACE refractoriness-related genes were mainly active in hepatocytes and embryonic stem cells.Hepatocytes and embryonic stem cells showed strong cellular interactions in HCC.
Research conclusions
Five key genes (DLGAP5,KIF20A,ASPM,KIF11,and TPX2) were identified as being associated with TACE refractoriness.Hepatocytes and embryonic stem cells probably promoted TACE refractoriness.
Research perspectives
More vivo and vitro experiments are essential to elaborate and verify the significance of the key genes and the potential mechanisms involved in TACE refractoriness.
ACKNOWLEDGEMENTS
The authors thank Guangxi Key Laboratory of Medical Pathology for their technical support.
FOOTNOTES
Author contributions:Huang JZ and Li JD took part in data collection,statistical analysis,interpretation and paper drafting;He RQ and Chen G were responsible for study design,statistical analysis guidance and paper correction.
Supported byGuangxi Higher Education Undergraduate Teaching Reform Project,No.2021JGA142;Guangxi Educational Science Planning Key Project,No.2022ZJY2791;Guangxi Medical University Education and Teaching Reform Project,No.2021XJGA02;and Guangxi Zhuang Autonomous Region Health Commission Self-financed Scientific Research Project,No.Z20201147.
lnstitutional review board statement:The study did not involve any human or animal related experiments,so no statement of ethics will be provided.
lnformed consent statement:The letter is to state that “informed consent” is not apply for our manuscript because the data of this study are from the public database TCGA,GEO and GTEx database.
Conflict-of-interest statement:We have no financial relationships to disclose.
Data sharing statement:The datasets analysed in this study are publicly available in the TCGA (https://portal.gdc.cancer.gov/),GEO (https://www.ncbi.nlm.nih.gov/geo/) and GTEx (https://gtexportal.org/home/) databases.
Open-Access:This article is an open-access article that was selected by an in-house editor and fully peer-reviewed by external reviewers.It is distributed in accordance with the Creative Commons Attribution NonCommercial (CC BY-NC 4.0) license,which permits others to distribute,remix,adapt,build upon this work non-commercially,and license their derivative works on different terms,provided the original work is properly cited and the use is non-commercial.See: https://creativecommons.org/Licenses/by-nc/4.0/
Country/Territory of origin:China
ORClD number:Jie-Zhuang Huang 0009-0006-8471-3826;Jian-Di Li 0000-0001-7050-371X;Gang Chen 0000-0003-2402-2987;Rong-Quan He 0000-0002-7752-2080.
S-Editor:Liu JH
L-Editor:A
P-Editor:Zhang XD
杂志排行

World Journal of Clinical Oncology的其它文章
- Prognostic factors of breast cancer brain metastasis
- Radiotherapy for hyoid bone metastasis from lung adenocarcinoma: A case report
- What are the changes in the hotspots and frontiers of microRNAs in hepatocellular carcinoma over the past decade?
- Fatty acid binding protein 5 is a novel therapeutic target for hepatocellular carcinoma
- Gene signatures to therapeutics: Assessing the potential of ivermectin against t(4;14) multiple myeloma
- Predicting colorectal cancer prognosis based on long noncoding RNAs of disulfidptosis genes