PAPS: Progressive Attention-Based Pan-sharpening
2024-03-01YananJiaQimingHuRenweiDianJiayiMaSeniorandXiaojieGuoSenior
Yanan Jia , Qiming Hu , Renwei Dian ,,, Jiayi Ma , Senior,, and Xiaojie Guo , Senior,
Abstract—Pan-sharpening aims to seek high-resolution multispectral (HRMS) images from paired multispectral images of low resolution (LRMS) and panchromatic (PAN) images, the key to which is how to maximally integrate spatial and spectral information from PAN and LRMS images.Following the principle of gradual advance, this paper designs a novel network that contains two main logical functions, i.e., detail enhancement and progressive fusion, to solve the problem.More specifically, the detail enhancement module attempts to produce enhanced MS results with the same spatial sizes as corresponding PAN images, which are of higher quality than directly up-sampling LRMS images.Having a better MS base (enhanced MS) and its PAN, we progressively extract information from the PAN and enhanced MS images, expecting to capture pivotal and complementary information of the two modalities for the purpose of constructing the desired HRMS.Extensive experiments together with ablation studies on widely-used datasets are provided to verify the efficacy of our design, and demonstrate its superiority over other state-ofthe-art methods both quantitatively and qualitatively.Our code has been released at https://github.com/JiaYN1/PAPS.
I.INTRODUCTION
HIGH-RESOLUTION multispectral (HRMS) images are important to a wide spectrum of remote sensing applications, such as object detection [1], environmental monitoring[2], [3], land surveying [4], and scene classification [5], to name just a few.However, limited to hardware, instead of HRMS, only multispectral images of low resolution (LRMS)and corresponding panchromatic (PAN) images can be obtained from devices [6].LRMS images are of high spectral but low spatial resolution, while PAN images exhibit high texture features but lack rich spectral messages, as shown in the first two pictures of Fig.1.The goal of pan-sharpening is to construct HRMS images by mining and fusing spatial and spectral information respectively from captured PAN and LRMS images.
Over the past years, a number of deep-learning-based methods have been developed with advanced performance in image fusion tasks [7]-[9], motivating researchers to apply the deep learning techniques to develop pan-sharpening methods.For instance, Masiet al.[10] propose a network namely PNN,which concatenates an up-sampled LRMS image with the corresponding PAN image to construct the HRMS image.However, the architecture including only three convolution units leaves a lot of room for optimization.After that, many followups are proposed to improve the PNN by building deeper networks, such as DRPNN [11] and PANNet [12].Furthermore,Wanget al.[13] devise a densely connected network with 44 convolutional layers.Although deepening networks can somewhat improve performance, it suffers from the increasing difficulty of training.What is more, the respective characteristics of PAN and LRMS images are barely considered.
For the sake of capturing more different and specific information from source images, numerous works [14]-[17] advocate two branches to achieve the goal.For example, TFNet[15] uses a two-stream network to extract features and fuses them to reconstruct the HRMS images.In addition, MPNet[14] adopts 2-D and 3-D convolutions respectively to extract information from PAN and LRMS images for the subsequent fusion.Chenget al.[17] propose a dual-path feature aggregation network to generate fusion results.These methods regard feature extraction and fusion as two independent steps, in which only a small number of features are used.On the other hand, due to the different spatial resolutions of LRMS and PAN images, the above-mentioned methods directly up-sample the LRMS to keep the same sizes as the corresponding PAN images.However, the quality of LRMS images is quite limited by this simple means.To address this issue, some works [18], [19] attempt to use the complementary features of two modalities to boost the information representation.In SDPNet [18], two encoder-decoder networks are designed to extract surface-level characteristics and deep-level features as enhanced information representation.In addition, Wanget al.[19] propose an explicit spectral-to-spatial convolution to aggregate spectral features into a spatial domain instead of upsampling.However, these features are only auxiliary for training instead of explicitly improving the quality of the LRMS images.

Fig.1.Illustration of the pan-sharpening problem.From left to right: up-sampled LRMS image, PAN image, pan-sharpened results by MDCUN [20] and our proposed PAPS-Net, respectively.The last one is the ground truth.Please zoom in the pictures to see more details.

Fig.2.The architecture of PAPS-Net, which is composed of two main modules.The detail enhancement module is used to enrich the details of the LRMS images, while the progressive fusion module further leverages the enhanced MS and PAN images to restore the HRMS images.We design a tri-stream fusion block to progressively exploit the high-quality deep features from both MS and PAN streams.SMSA means a designed spectral and multi-kernel spatial attention block.
To mitigate the aforementioned problems, in this paper, we propose a progressive attention-based pan-sharpening network (PAPS-Net for short), which is considered to obtain higher-quality LRMS images before fusion and exploit features of different depths progressively to construct the HRMS images.As schematically depicted in Fig.2, our PAPS-Net is composed of two main modules: 1) LRMS and corresponding multi-scale PAN images are first fed into the detail enhancement module (DEM) to produce enhanced MS images with the same spatial sizes as PAN images; and 2) the progressive fusion module (PFM) is employed to build HRMS images by gradually extracting features from PAN and enhanced MS images.The complementary information of these two modalities can be progressively integrated in this manner.Taking Fig.1 as an example, our method provides more and clearer information in both spectral and spatial domains than other competitors.In summary, the major contributions of this work are as follows:
1) For better integrating the two modalities, we design a progressive attention-based network for pan-sharpening,namely PAPS-Net.The PAPS-Net consists of two main modules dedicated to enhancing image quality and obtaining critical information from two modalities, respectively.
2) To provide better MS references for fusion, we design a detail enhancement module to enhance LRMS images with higher quality than directly up-sampling.
3) To take full advantage of spectral and spatial information from the enhanced MS and PAN images, the progressive fusion module is proposed with a novel fusion strategy that progressively exploits features of varying depths to reconstruct HRMS images.
4) Extensive experiments are conducted to demonstrate the superiority of our method over other state-of-the-art methods in both quantitative metrics and perceptual quality.
II.RELATED WORK
A. Traditional PAN-Sharpening Methods
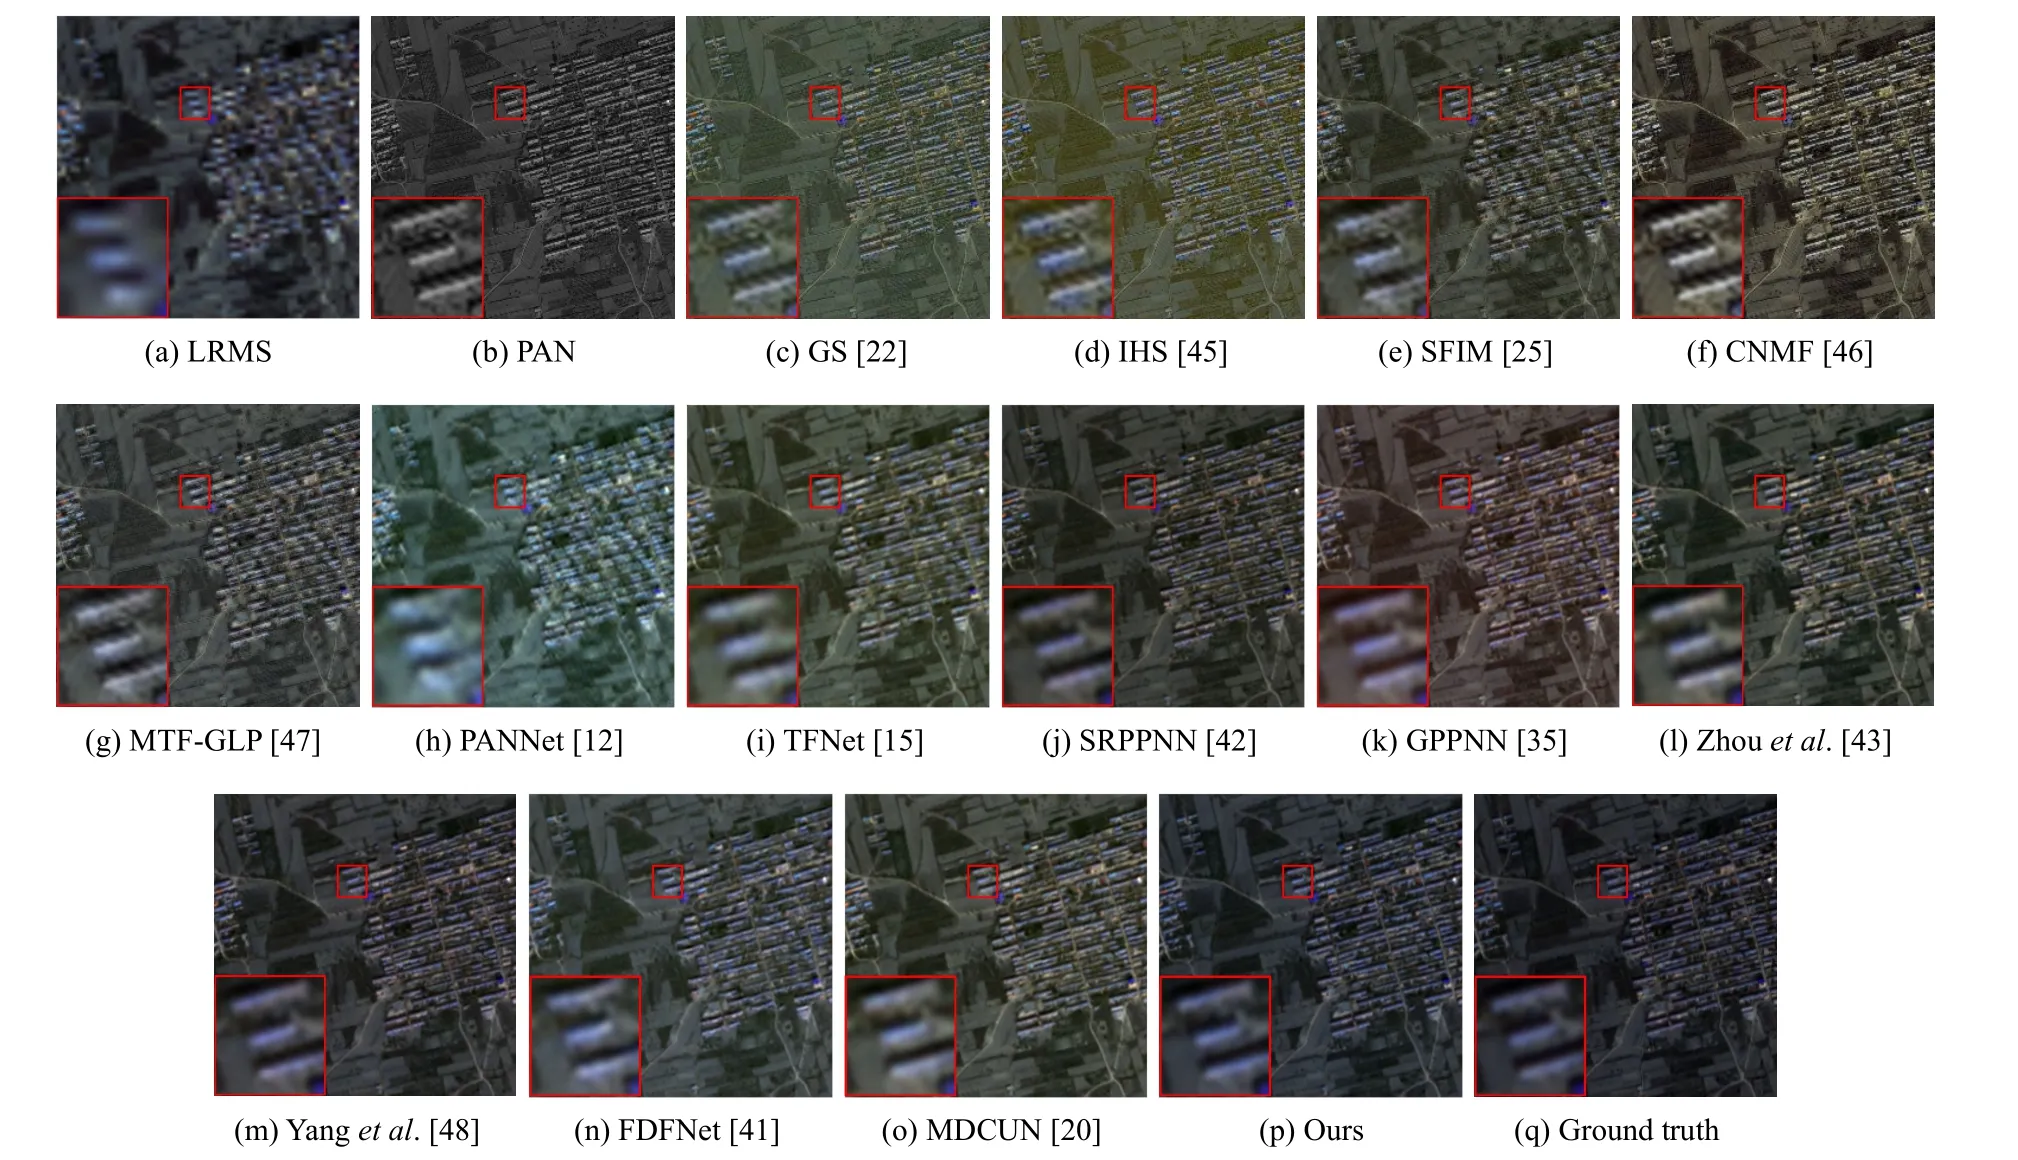
Fig.3.Visual comparison on the GaoFen-2 dataset.Our result shows striking color fidelity against the alternative methods.When compared with the result of FDFNet, the details of our texture are preserved to a greater extent, which can be better observed by zooming in.
Traditional pan-sharpening methods can be divided into component substitution methods, multi-resolution analysis methods, and model-based methods, which construct HRMS images from the views of decomposition, fusion, and transformation of source images, respectively.The component substitution (CS) methods such as intensity-hue-saturation (IHS)[21], Gram-Schmidt (GS) [22], and principal component analysis (PCA) [23], aim to extract specific spatial-informationcontaining components from PAN images and substitute them in LRMS images.Despite the simplicity of implementation,the CS-based approaches hardly consider the shared features of the two modalities during the information substitution,leading to severe spectral distortion, as shown in Figs.3(c)and 3(d).The multi-resolution analysis (MRA) methods extract the spatial features from PAN images by multi-scale transformation.The features of high resolution are then injected into the up-sampled LRMS images.For example,Schowengerdt [24] use a high-pass filter to extract spatial information.Smoothing filter-based intensity modulation(SFIM) [25] is another MRA-based method that utilizes the average smoothing filter to extract features.Although spatial details can be considerably preserved by these methods, spectral information in LRMS images is likely to be corrupted by the injected features.The model-based methods [26]-[29] are under the assumption that the LRMS and PAN images are the spatially and spectrally degraded versions of HRMS images,respectively.Therefore, they create different models to establish the relationship between source images and HRMS images.However, the real situation is more complicated than this simple assumption.Besides, it is often troublesome to design an efficient optimization algorithm for the model.
B. Deep Learning Methods
In recent years, thanks to the nonlinear fitting capability of deep learning networks, researchers have paid more attention to exploiting such techniques for pan-sharpening.There are two main routes based on deep learning: i.e., generative adversarial networks (GAN) and convolutional neural networks(CNN).In the GAN-based category, Liuet al.[30] propose the first GAN-based architecture called PSGAN, in which the discriminator is against the generator for the realness of generated HRMS images.Besides, HPGAN [31] uses a 3-D spectral-spatial generator network to reconstruct the HRMS images under spectral, spatial, and global constraints.Furthermore, an unsupervised method named PANGAN [32] utilizes two discriminators for the generated HRMS images.In detail,the generated images down-sampled along the spatial and channel dimensions are assigned to two independent discriminators to be distinguished from LRMS and PAN images,respectively.However, GAN-based methods are prone to model collapse [33] and gradient degradation [34] during the training process, which requires considerable manual intervention.As for CNN-based methods, Zhanget al.[9] propose a fast network based on proportional maintenance of gradient and intensity.Xuet al.[35] combine deep learning with model-based methods using deep unrolling techniques.Besides,Zhang and Ma [36] propose a residual learning network based on gradient transformation prior for pan-sharpening.To take full advantage of source images, many approaches utilize multi-scale or multi-path architectures.For example, different scales of source images by down-sampling the PAN images and up-sampling the LRMS images are used to progressively construct the ideal HRMS images in CPNet [37] and MUCNN[19].Similarly, Zhanget al.develop BDPN [38], which employs a cross-direction architecture to fuse source images.Zhouet al.[39] make efforts to enforce the complementary feature learning by two independent convolution branches.Besides, Jinet al.[40] extract multi-scale features via the Laplacian pyramid and build multiple loss functions to describe the information loss for each scale.FDFNet [41] uses a three-path architecture to explore full-depth features.However, all of these methods directly up-sample the LRMS images to ensure the same spatial resolution as PAN images,the quality of which is therefore limited.Unlike existing methods, our proposed PAPS-Net designs a detail enhancement module to create higher-quality LRMS images than up-sampling.Besides, a novel progressive fusion strategy is employed in the progressive fusion module to construct the desired HRMS images.
III.OUR PROPOSED METHOD
A. Motivation
The goal of pan-sharpening is to obtain high-resolution multispectral results from LRMS images and corresponding PAN images.Some methods [12], [15], [42] attempt to interpolate LRMS images directly to keep the identical resolution with PAN images before fusing them.Unfortunately, this simple means may introduce unwanted information and cause the degradation of visual quality (please compare the LRMS and ground-truth images in Figs.1, where the regions of high frequency are contaminated by the interpolations), making the results contain annoying artifacts and vague boundaries.As such, we design a detail enhancement module (DEM) to progressively raise the spatial resolution and enrich the finegrained information of the LRMS images with the compensation of PAN images at multiple scales.As shown in Fig.1(c),our enhanced MS image reduces discontinuous areas in the road regions and holds more information than a simple bilinear interpolation (Fig.1(a)).Moreover, there is a trend in previous methods [10], [12], [13] that the two images with different modalities are concatenated before being fed into the networks, despite the diversities of modalities.This manner may fail to fuse critical information of the two modalities and hence lead to ambiguous signals.Besides, most existing methods [15], [42], [43] seldom make full use of the features at different depths of the two modalities.As a result, the fusion of pivotal information is often inadequate, which ultimately limits the performance of these methods.Please notice that,MPRNet [44] proposes a progressive multi-stage architecture for image restoration, which utilizes encoder-decoders in earlier stages to extract multi-scale contextualized features.The final stage operates at the original image resolution to generate spatially accurate outputs.However, in remote sensing images, reducing the feature scale may result in the loss of spatial details.Therefore, our progressive fusion module aims to extract complementary information and fuse them progressively at different depths without scaling down the features.Specifically, we break the information flow down into three streams (MS, PAN, and their fusion).In each stream of the two modalities, the respective features are preserved by the tri-stream fusion (TSF) blocks during the feed-forward process.These features are extracted from their streams at multiple depths and then fused into the fusion stream progressively.With this structure, the results can obtain complementary features at varying depths progressively as the number of TSF blocks increases, thereby making the information fusion more sufficient and comprehensive.
B. Network Architecture
The blueprint of PAPS-Net is depicted in Fig.2.As can be viewed, the proposed PAPS-Net is a two-stage architecture consisting of a detail enhancement module (DEM) and a progressive fusion module (PFM).The DEM enhances the LRMS images to the same spatial sizes as PAN images.The PFM utilizes enhanced MS and PAN images to progressively construct HRMS images.In what follows, we explain the details of our design.
1)Detail Enhancement Module(DEM): As previously discussed, one of the disadvantages of the existing methods is that they ignore the image quality degradation caused by directly up-sampling the LRMS images.Aiming to rectify the problem, the LRMS images are intended to be enhanced by the additional information from PAN images before fusing them.We thereby propose a detail enhancement module(DEM) to enrich the textural details of LRMS images with the help of PAN images.However, directly injecting the spatial information from PAN images into LRMS images may cause severe artifacts because of the different characteristics and resolutions between LRMS and PAN images.To settle it, as shown in Fig.2, a multi-scale enhancement structure is designed to progressively increase the resolution and enrich the details of LRMS images.Specifically, we use multi-scale PAN images to obtain hierarchical information and progressively generate enhanced MS images.PAN images are downsampled to get IPAN↓2and IPAN↓4.Firstly, we use a 3×3 convolutional layer with ReLU and the pixel shuffle [49] operation to generate a shallow feature, which can be formulated as
where φ(·) represents the rectified linear unit (ReLU), *denotes the 3×3 convolution.W1is the weights of the filter,C(·)means the concatenation along the channel dimension.To improve the availability of features from different depths, we aggregate features by the aid of dense connection enhancement (DCE) blocks.As shown in Fig.2, a DCE block comprises of six 3×3 convolutional layers, with dense connections added to the three intermediate layers for aggregation.The spatial details in results are further compensated with the high-frequency information of PAN images.The process can be expressed as follows:
where DCE(·) represents the function of the DCE block.H(·)represents the function of obtaining high-pass information from PAN images.To further reinforce MS images at a higher spatial resolution, we take the generated MS image I˜MSand IPAN↓2as inputs.The above steps are then repeated to obtain an enhanced MS image IMSwith the identical resolution to its paired PAN image.

Fig.4.Structure of the SMSA in TSF blocks.
2)Progressive Fusion Module(PFM): Fusion strategy is responsible for the final performance of HRMS images,aggregating critical information from both modalities.Although LRMS images have been enhanced to keep the same resolution as PAN images, simple summation or convolution[10], [11] cannot assure the desired performance due to the diversities between modalities.Therefore, a progressive fusion module (PFM) with a tri-stream architecture is proposed to reconstruct the HRMS images by fusing modality features at different depths in a cascaded manner.As shown in Fig.2, the PFM can be divided into three phases: transformation, tristream fusion, and reconstruction.
In the transformation phase, the enhanced MS imageIMSand the PAN image IPANare transformed into the same feature space, which can be formulated as
whereWmandWprepresent the weights of convolutional layers.These two layers extract shallow features from IMSand IPAN, respectively.The features are then concatenated along the channel dimension before coarsely fused by a 3 ×3 convolutional block parameterized byWfas follows:
As for the tri-stream fusion phase, the integration of features is achieved through the application of tri-stream fusion(TSF) blocks progressively.While some studies, such as [42],[48], propose modifying the feature scale during the feature extraction process, we adopt a different approach.Remote sensing images are known to have an intricate and complex structure, and reducing the feature scale may result in the loss of spatial details.Hence, we choose to maintain the feature scale during feature extraction to better preserve the structural information and spatial details of the fusion results.As depicted in Fig.2, each TSF block is formed by three streams(MS, fusion, and PAN from top to bottom), delivering the signals of two modalities and their fusion without scaling down.The MS and PAN streams extract the features with two convolutional layers.We further incorporate a residual connection to each stream for a higher efficiency of information transmission.The calculation in MS and PAN streams is formulated as
and
whereWm1andWm2represent the weights of different convolutional layers in the MS stream.Wp1andWp2represent the weights of different convolutional layers in the PAN stream.As for the fusion stream, inspired by [50], we also add the attention block to increase the representation power and global perception.The spectral information that is expanded along the channel dimension is further re-weighted by the involved spectral attention mechanism in the spectral and multi-kernel spatial attention (SMSA) block.Besides, we also propose the multi-kernel spatial attention mechanism to increase the perception on spatial positions by using diverse kernels, as shown in Fig.4.Three parameters inConv(·) represent the kernel size, the number of input channels, and the number of the output channels, respectively.FC(·) represents the function of fully connected layers, and the parameter means the number of output channels.In short, the fusion stream can be formulated as
whereWf1andWf2represent the weights of different convolutional layers in the fusion stream.SMSA(·) represents the function of the SMSA block.
As the number of tri-stream fusion blocks increases, more features of different depths can be fused to reconstruct the final HRMS images.In the last phase, the fused feature is mapped into HRMS images by two 3×3 convolutional layers with ReLU and Sigmoid, respectively.
C. Loss Function
Our loss function contains two parts corresponding to two modules.The whole loss function can be expressed as
where LDEMand LPFMstand for the loss functions of the DEM and PFM, respectively.λis employed to balance the two loss term.In our experiments, settingλto 0.1 works well.We constrain the products of the DEM by a multi-scale loss as follows:
where ‖·‖Fdesignates the Frobenius norm.I˜MSand IMSrepresent different sizes of the enhanced MS images.IGT↓2is the product downsampling the ground truth IGTto one-half of the original size.We employ the Frobenius norm to constrain the fidelity of the final results, which can be formulated as
where IHRMSstands for the reconstructed HRMS image.
IV.EXPERIMENTAL VALIDATION
A. Experiment Settings
Datasets and Metrics: Three different satellite image datasets are used to conduct experiments, including GaoFen-2(GF-2), QuickBird (QB), and WorldView-II (WV-II).We split the datasets into training and testing sets as the previous methods do [18], [20], [41], and all the deep-learning-based methods are retrained and evaluated on the same data split for a fair comparison.As the ground-truth HRMS images are inaccessible, we use Wald’s protocol [51] like many other practices [10], [12], [14].Specifically, the original PAN and LRMS images are downsampled by a factor of 4 to simulate their low-resolution version, and the original MS images are adopted as the ground truths.According to our training strategy, the LRMS images are cropped into patches with the pixel size of 64×64, while corresponding PAN and GT patches are with the pixel size of 256×256.The specific information of three datasets is as follows:
· For GF-2 dataset, a large dataset of Beijing city was downloaded from the website1http://www.rscloudmart.com/dataProduct/sample, in which the size of MS images is 6907×7300×4.After the data processing mentioned before,we finally obtained 8612/728/728 pairs of images for training/validation/testing.
· For QB dataset, we acquired a large dataset of the city of Indianapolis from [52], in which the size of MS images is 4096×4096×4.After spliting and cropping, 4137/256/256 pairs of images were obtained for training/validation/testing.
· For WV-II dataset, we downloaded the datasets of the city of Sydney from the website2http://www.digitalglobe.com/samples, in which the size of MS images is 4062×4000×8.The same data processing as that used for GF-2 and QB datasets, resulting in 5198/234/234 pairs of images for training/validation/testing.
In the testing phase, we adopt five metrics from different perspectives to evaluate the reduced-resolution datasets,including the peak signal-to-noise ratio (PSNR) [53], the structural similarity (SSIM) [54], the correlation coefficient(CC) [55], the relative dimensionless global error in synthesis(ERGAS) [56], and the spectral angle mapper (SAM) [57].Specifically, PSNR is a ratio of peak value versus noise in the image, reflecting the distortion of the fused result.SSIM calculates the structural similarity between the fused HRMS image and the ground truth.CC focuses on the linear correlation between the fused HRMS image and the ground truth.SAM and ERGAS measure the angle change and dynamic range change between the fused image and the ground truth,respectively.The first three metrics measure the spatial similarity, while the last two assess the spectral distortion.As for full-resolution datasets, we use theDλ, theDsindices, and the quality-with-no-reference (QNR) [58] to evaluate the performance.Dλcares about the spectral shift between the LRMS image and the fused HRMS image, whileDsconsiders the spatial difference between the PAN image and the HRMS image.QNR is a comprehensive metric measuring both spatial and spectral deviation.Among the above metrics, the smaller the SAM, ERGAS,Dλ, andDsvalues, the higher the fidelity.As for the rest of the metrics, larger values mean higher fidelity.
Training Details:Our PAPS-Net and other deep-learningbased methods are implemented with PyTorch framework and trained on a single NVIDIA GeForce RTX 3060 GPU.The traditional methods are tested with the Intel i5-9400F CPU and 16GB RAM.During training, we use SGD [59] optimizer to optimize the entire network for 100 epochs.Besides, the learning rate is set to 5×10⁻⁴and decays by a factor of 10 every 40 epochs.The batch size is set to 8.The hyper-parametersNis also set to 8.
B. Comparison With State-of-the-Arts
Reduced-Resolution Comparison: To evaluate the performance of our method, five traditional pan-sharpening methods are selected as the competitors, including GS [22], IHS[45], SFIM [25], CNMF [46], and MTF-GLP [47].Besides,seven recent deep-learning-based methods are compared with our method, including PANNet [12], TFNet [15], SRPPNN[42], GPPNN [35], Zhouet al.[43], Yanget al.[48], FDFNet[41], and MDCUN [20].For reduced-resolution evaluation,we compare the performance of the above methods in three datasets, including GF-2, QB, and WV-II.In each testing dataset, the pixel sizes of LRMS, PAN, and GT patches are 64×64, 2 56×256, and 2 56×256, respectively, which stay the same as the training datasets.Tables I-III list the average evaluation metrics of all methods on the three datasets, respectively.It should be highlighted that our method significantly outperforms the other competitors in terms of all the quantitative reference metrics on each testing dataset, which effectively demonstrates the superiority of our framework.To be more intuitive, we make visual comparisons of HRMS results on GF-2, QB, and WV-II datasets in Figs.3, 5 and 6, respectively.It should be noted that our method produces more appealing results in terms of both color fidelity and texture preservation, thanks to the two-stage design and efficient progressive network architecture.However, results from traditional alternative methods, loss the details of texture and suffer from spectral distortion.Specifically, in Figs.5(c), 5(d),and 5(g), noticeable color dissonance and severe spatial noiseappear in the results from GS, IHS, and MTF-GLP.As for the deep learning methods, including Figs.5(h)-5(o), they often fail to restore some high-frequency regions like the path on the grass, which can be observed in zoomed-in patches.
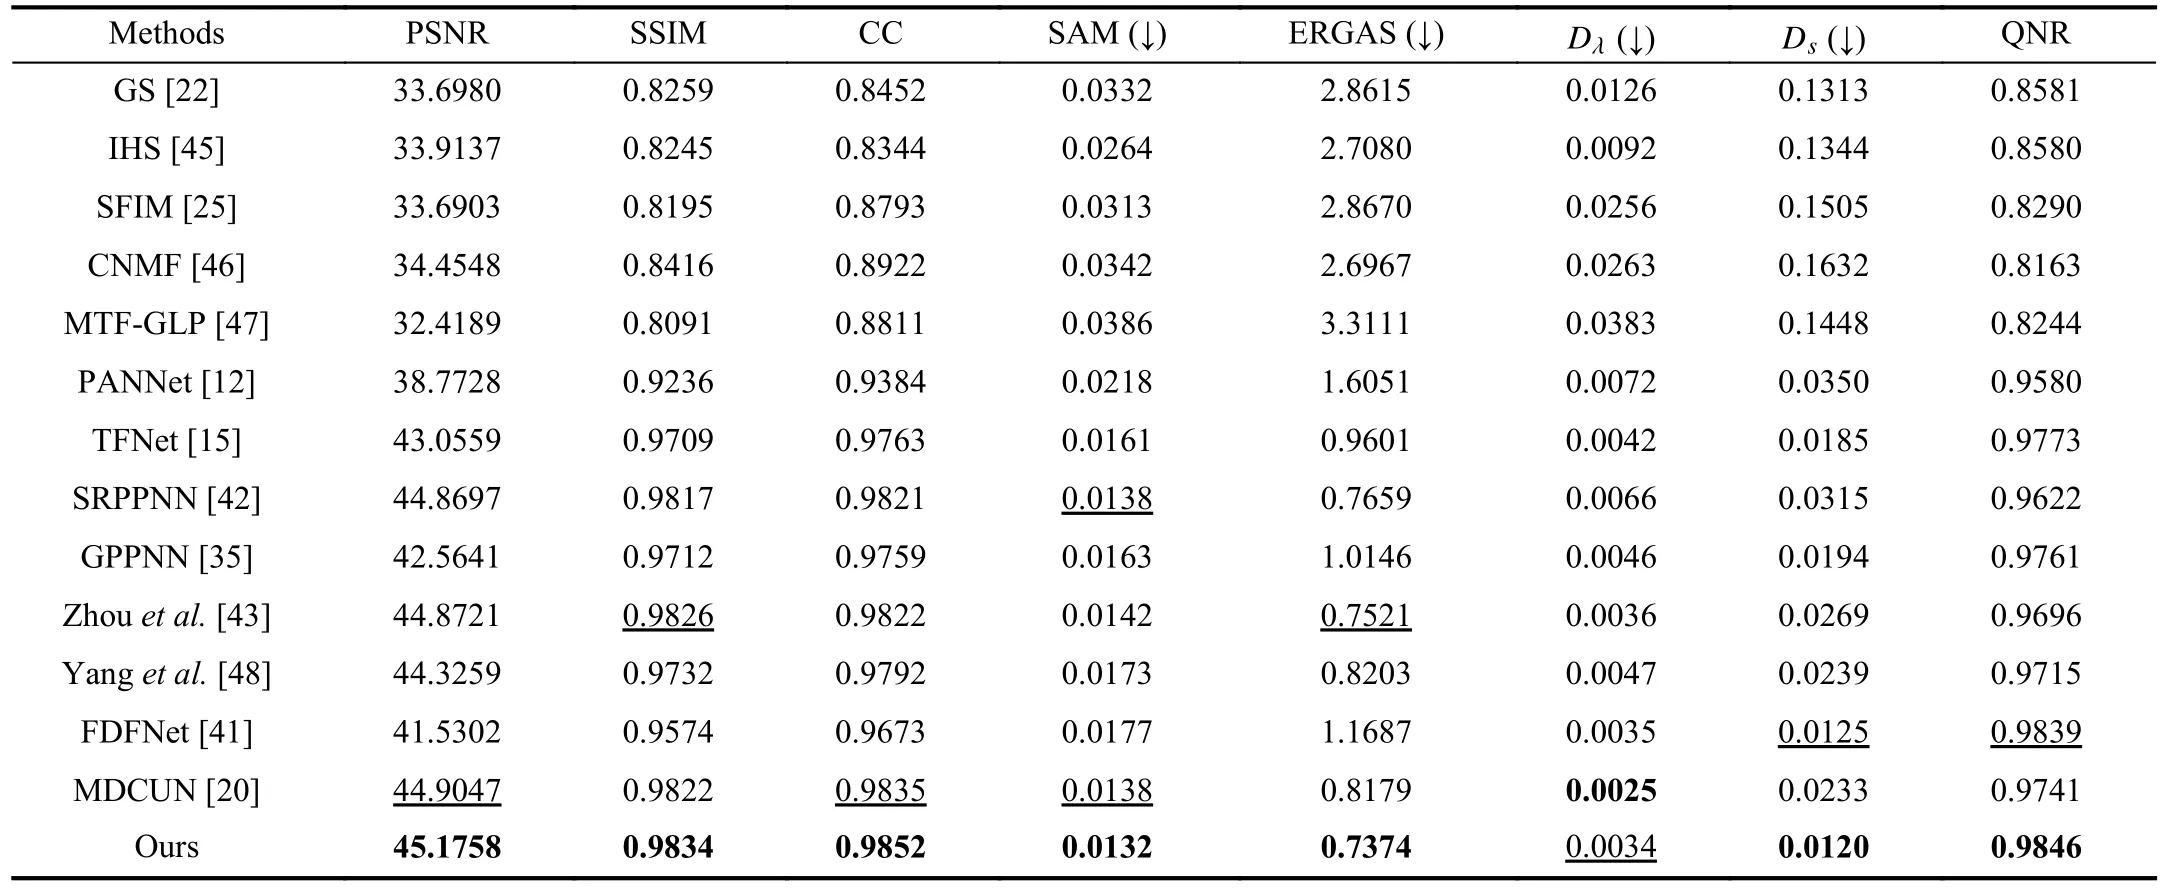
TABLE I QUANTITATIVE ASSESSMENT ON THE GAOFEN-2 DATASET.THE SIGN (↓) INDICATES THAT THE SMALLER THE VALUE,THE BETTER THE PERFORMANCE.THE BEST AND SECOND BEST RESULTS ARE IN BOLD AND UNDERLINE

TABLE II QUANTITATIVE ASSESSMENT ON THE QUICKBIRD DATASET.THE SIGN (↓) INDICATES THAT THE SMALLER THE VALUE,THE BETTER THE PERFORMANCE.THE BEST AND SECOND BEST RESULTS ARE IN BOLD AND UNDERLINE
Our fused results maintain a better visual effect without spectral distortion thanks to the first-step enhancement by the DEM.We can see in Fig.3 that traditional methods suffer from striped artifacts appearing in the PAN image.Although DL-based methods alleviate some of the artifacts, they suffer from severe spectral distortion, as shown in Figs.3(h)-3(o).Our result achieves superior visual quality in terms of both color fidelity and spatial details.The smallest values of SAM and ERGAS also prove the superiority of our method in terms of spectral retention.
By the progressive information extraction and fusion of the PFM, our results keep fine-grained texture details even when the LRMS images have severe spatial artifacts, while the competitors may fail to recover the details.For example, we can see in Fig.6(a) that the LRMS image has obvious striped artifacts.Compared to other methods, the spatial artifacts in our result are better mitigated, and the structure of the details is maintained in the meantime.
Full-Resolution Comparison: To verify the performance of the proposed method PAPS-Net on the full-resolution datasets, the original PAN and LRMS images are cropped into patches with the pixel sizes of 1024×1024 and 256×256,respectively.Note that no interpolation operation participates in preprocessing the full-resolution datasets.The ground-truth images are not available hence.The no-reference metrics are thereby used for the objective evaluation, includingDλ,Ds,and QNR.It can be observed in Tables I-III that our method generalizes well to full-resolution datasets and achieves fair performance in terms of these metrics.Notably, these metrics restrain the inter-spectrum and/or spectrum-PAN relationships of fusion results from deviating original inputs, which may not be good descriptors for fusion results that introduce rich details from PAN images.Literally speaking, making no difference to LRMS images will obtain smallestDλvalue,which is clearly a trivial solution.In the meantime, containing additional information from PAN images may also breaks the balance held by LRMS and degraded PAN images sometimes,leadingtobiggerDs,hence smallerQNR,sinceQNR:=(1-Dλ)α·(1-Ds)β.Therefore, these metricscannotfully represent our extraordinary performance on recovering and compensating details.One is highly recommended to assess our method also in light of its visual performance, which is depicted in Figs.7-9.Our results contain more spatial information and maintain the structure of paths and building textures, as shown in Figs.8(o) and 9(o).Our result in Fig.7 also shows striking color fidelity against the alternative methods.Moreover, the details of our texture are better preserved when compared to GPPNN and FDFNet.

TABLE III QUANTITATIVE ASSESSMENT ON THE WORLDVIEW-II DATASET.THE SIGN (↓) INDICATES THAT THE SMALLER THE VALUE,THE BETTER THE PERFORMANCE.THE BEST AND SECOND BEST RESULTS ARE IN BOLD AND UNDERLINE
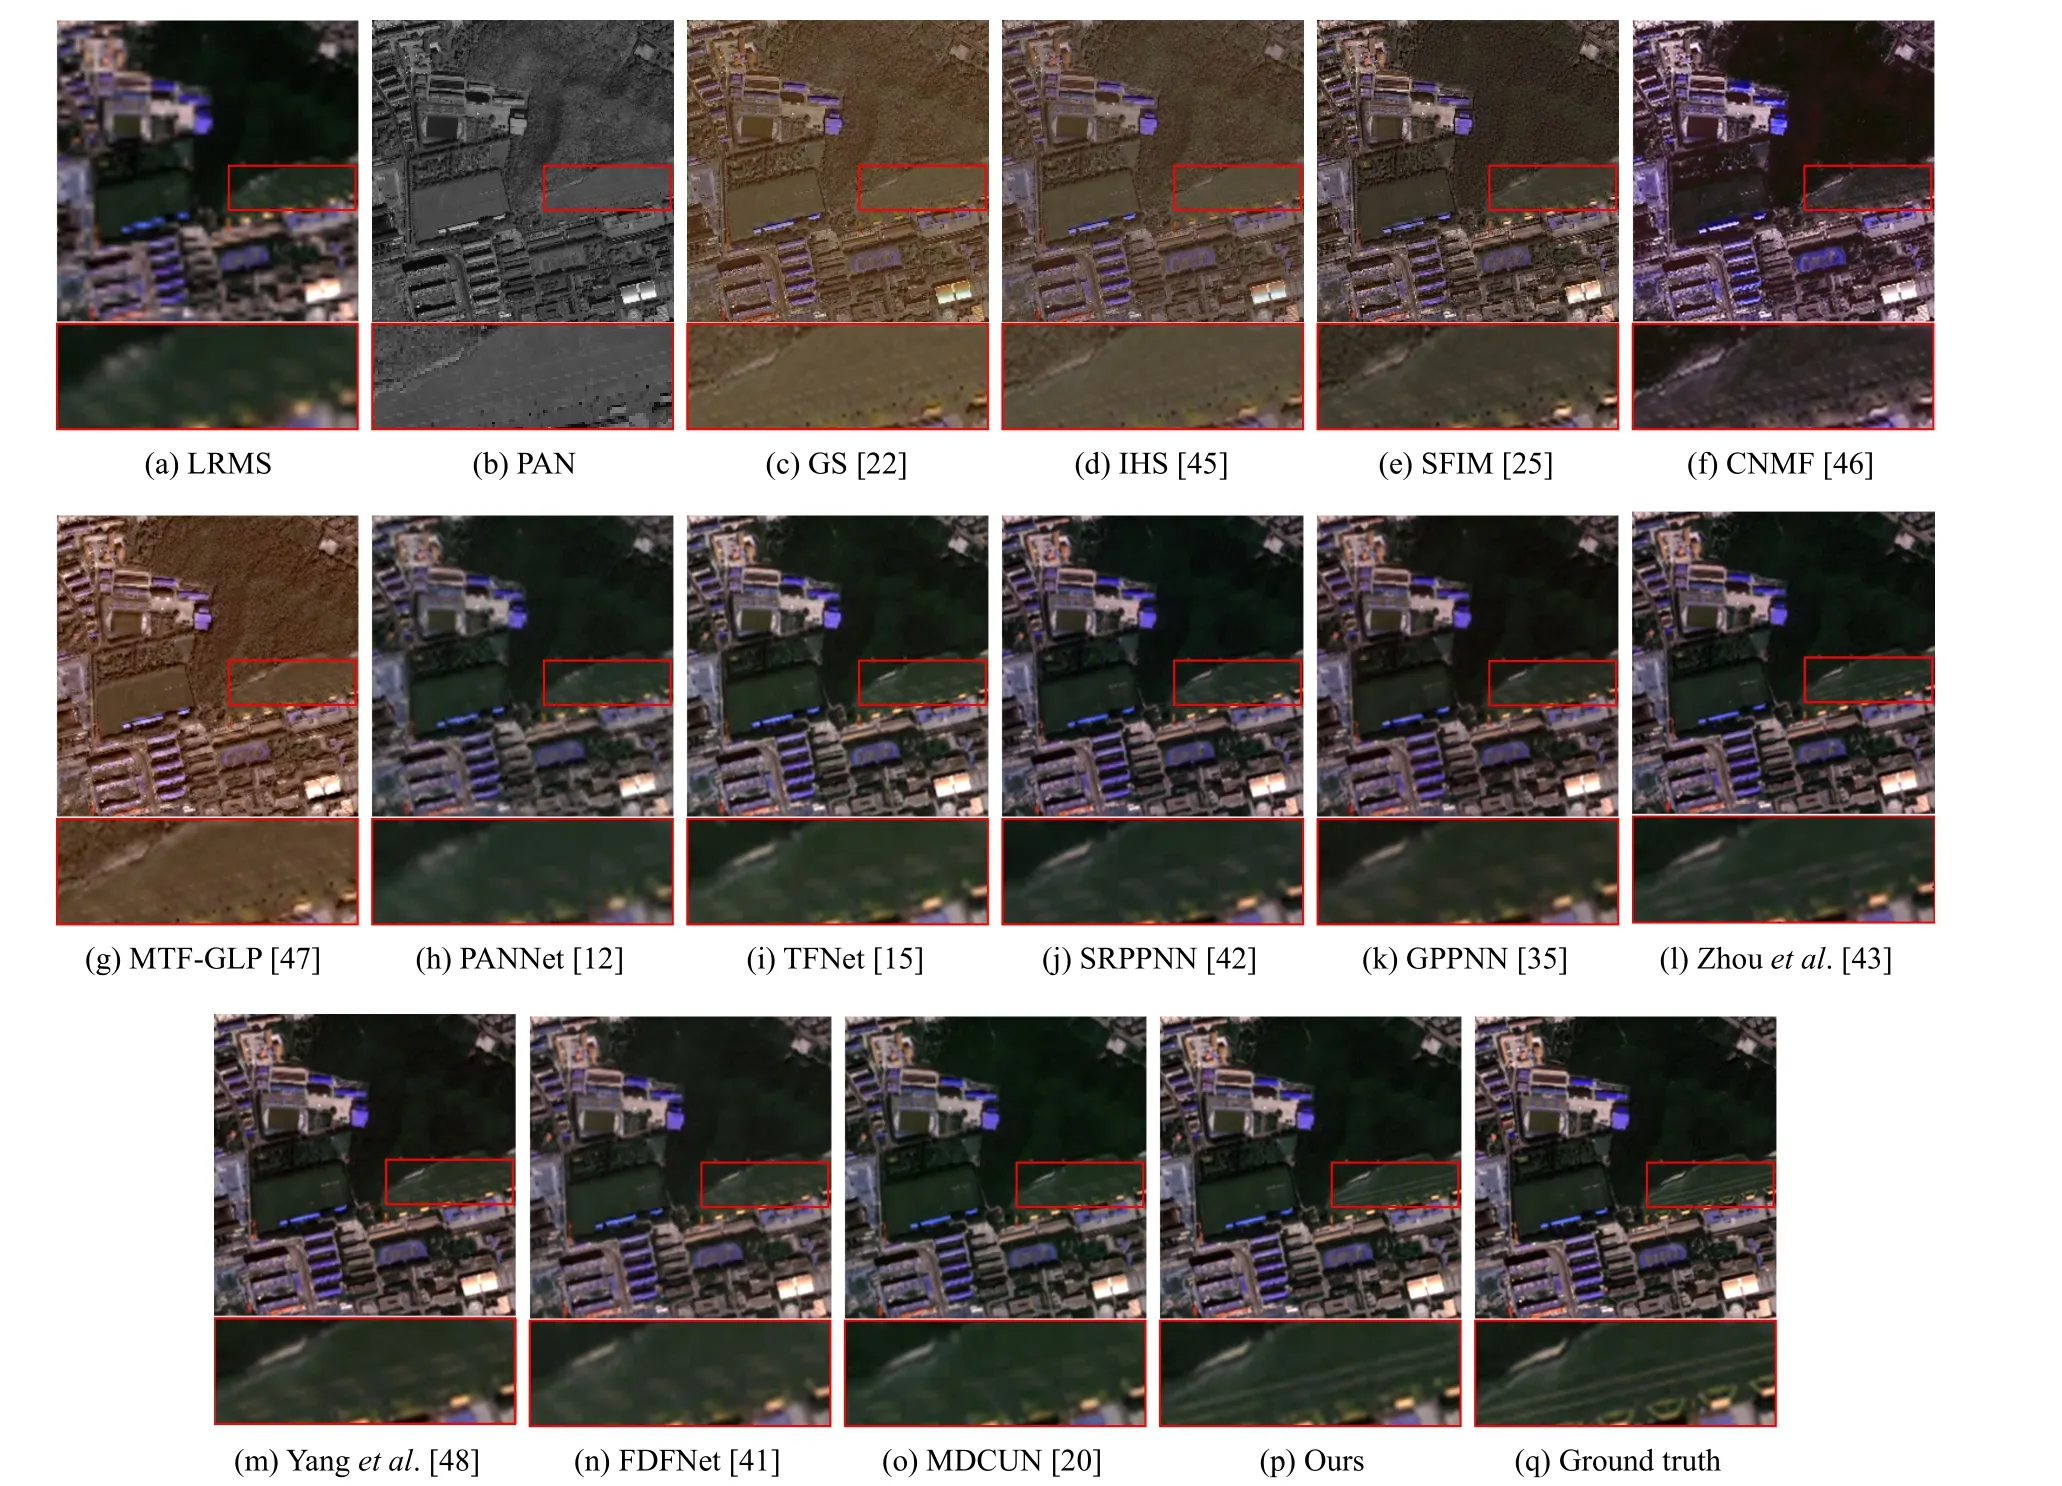
Fig.5.Visual comparison on the QuickBird dataset.Our result achieves the superior visual quality in terms of both color fidelity and the structure preservation.

Fig.6.Visual comparison on the WorldView-II dataset.Our result recovers more texture and maintains more details over other competitors.
Efficiency Comparison: To illustrate the efficiency of our proposed method PAPS-Net, we exhibit the average time of eleven competitors and our PAPS-Net in testing 728 images of the GF-2 dataset.The resolution of HRMS images is 256×256×4.The traditional methods are tested on the Intel i5-9400F CPU, and the DL-based methods are tested on an Nvidia GTX 3060 GPU.In addition, we also compare FLOPs and parameters with six DL-based methods.Table IV demonstrates the results of the efficiency comparison.Owing to the simple structure, PANNet achieves the best performance on FLOPs and parameters.However, its results suffer from severe spectral distortion and spatial artifacts.Our method has higher FLOPs due to using large kernel convolutions in the SMSA, but is still lower than MDCUN.Note that when resources are limited, the number of TSF blocks can be further reduced and the network still performs excellent, as shown in Table V.As for the runtime, our method is also at the top of the comparison methods.Overall, our proposed PAPS-Net achieves a balance between effectiveness and complexity and meets practical requirements.
C. Ablation Study
The Choice of the Number of TSF Blocks in PFM: The TSF block is a key design in our progressive fusion module.Considering that such a building block can be stacked flexibly to meet the efficiency demand and the volume of the dataset, we compare the model performance with different numbers of TSF blocks on the GF-2 dataset.It can be seen from Table V that when the number of TSF blocks increases from 4 to 8, the performance of the network improves significantly.However,as it continues to increase, the improvement is turning weak,while its computational cost becomes gradually unacceptable.Thus we adopt the setting ofN=8 in all of our comparative experiments to balance the performance and computational complexity.
The Necessity of the Two-Stage Design: To verify the validity of each module, ablation studies are conducted in two different configurations.Table VI shows the performance comparison between the different versions, including 1) the version without the PFM, and 2) the version without the DEM,which is the PFM trained with PAN and up-sampled LRMS images.We can see that the full version of our PAPS-Net outperforms the two alternatives, demonstrating that both of the modules are indispensable.As shown in Fig.10, only making use of one of the integral modules is not promising to produce results with high visual quality.The details are often vague when the PFM is missing due to the lack of progressive feature integration.When the DEM is absent, the color tends to be lighter, harming the spectral fidelity.Meanwhile, grid artifacts emerge in both cases when there are large areas of lowfrequency information in the images.Therefore, combining DEM and PFM can boost the fidelity of spectral and spatial features and achieve better fusion results.

Fig.7.Visual comparison on the GaoFen-2 dataset in full-resolution validation.Our result better maintains the spatial details without spectral distortion.
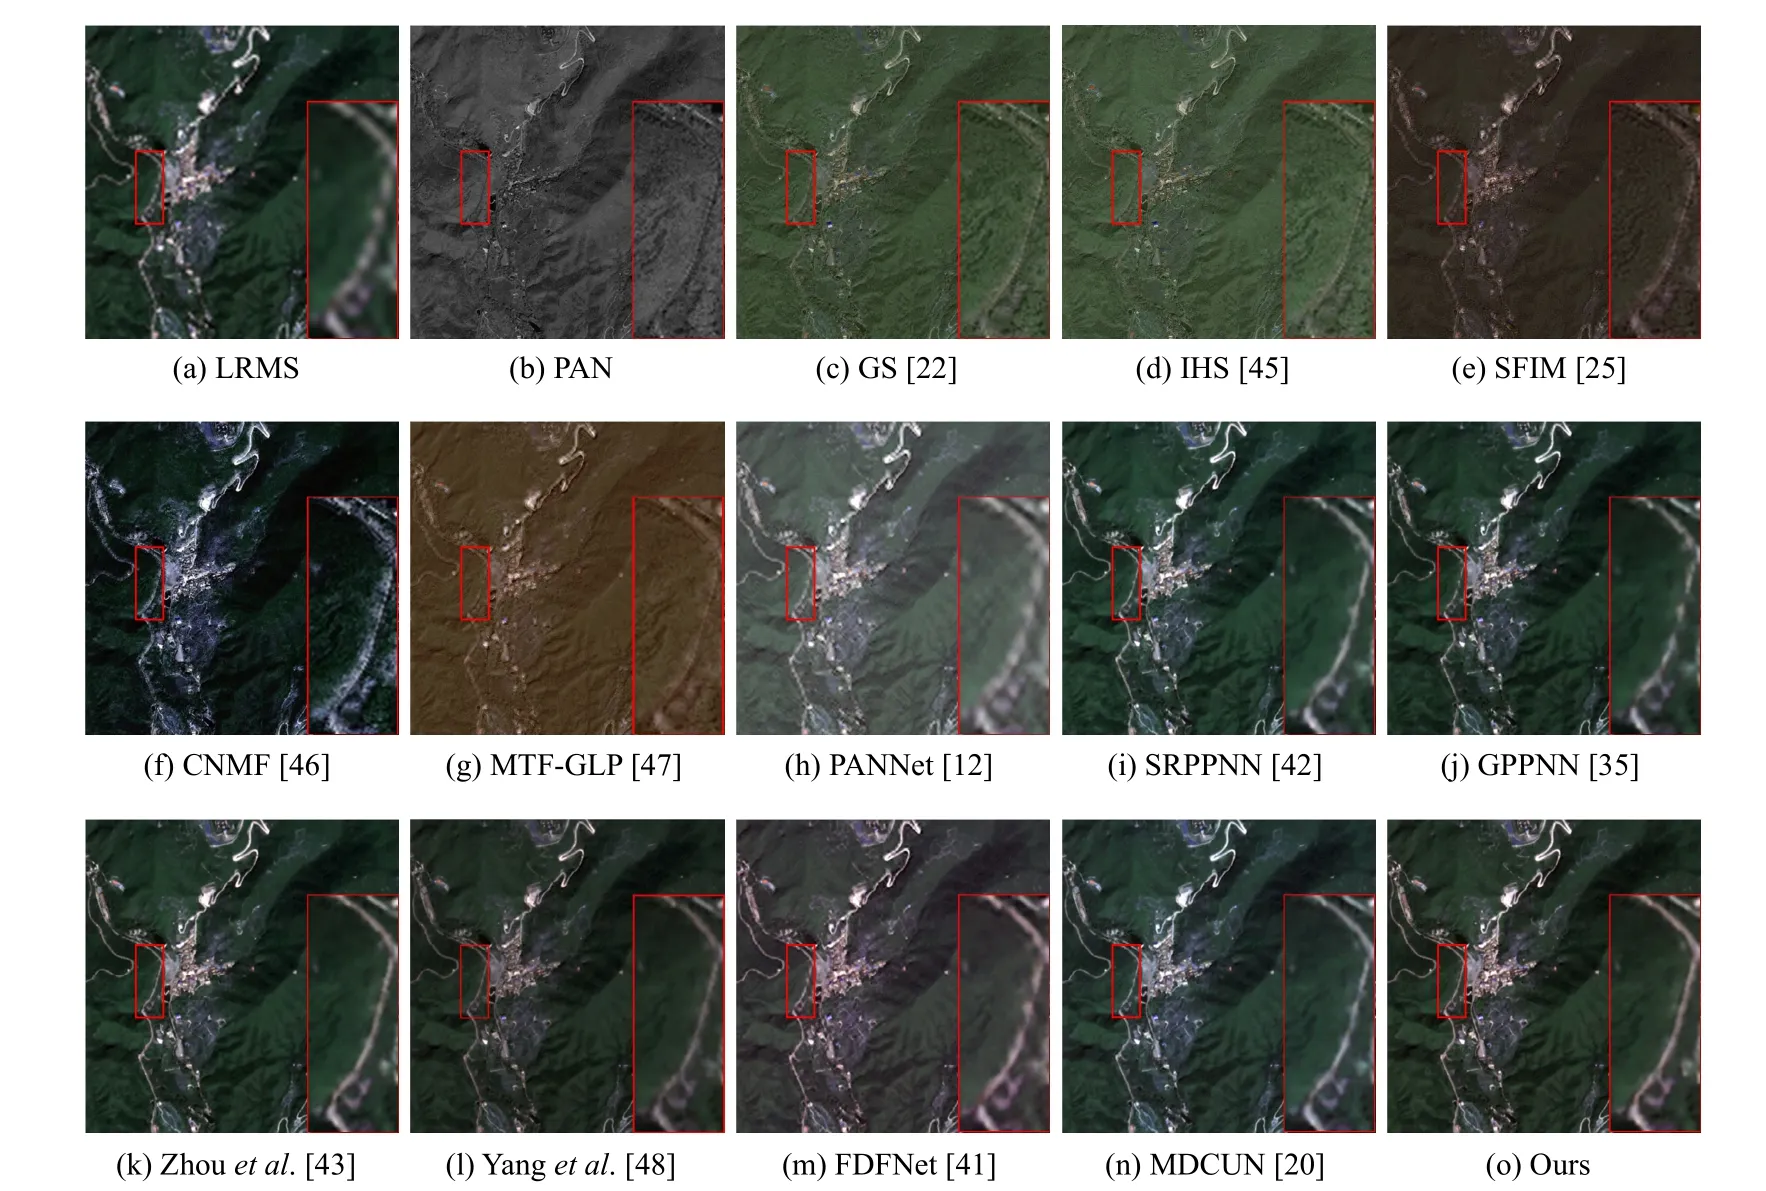
Fig.8.Visual comparison on the QuickBird dataset in full-resolution validation.Our approach maintains the structure of the path, which can be observed in the zoomed-in patch.
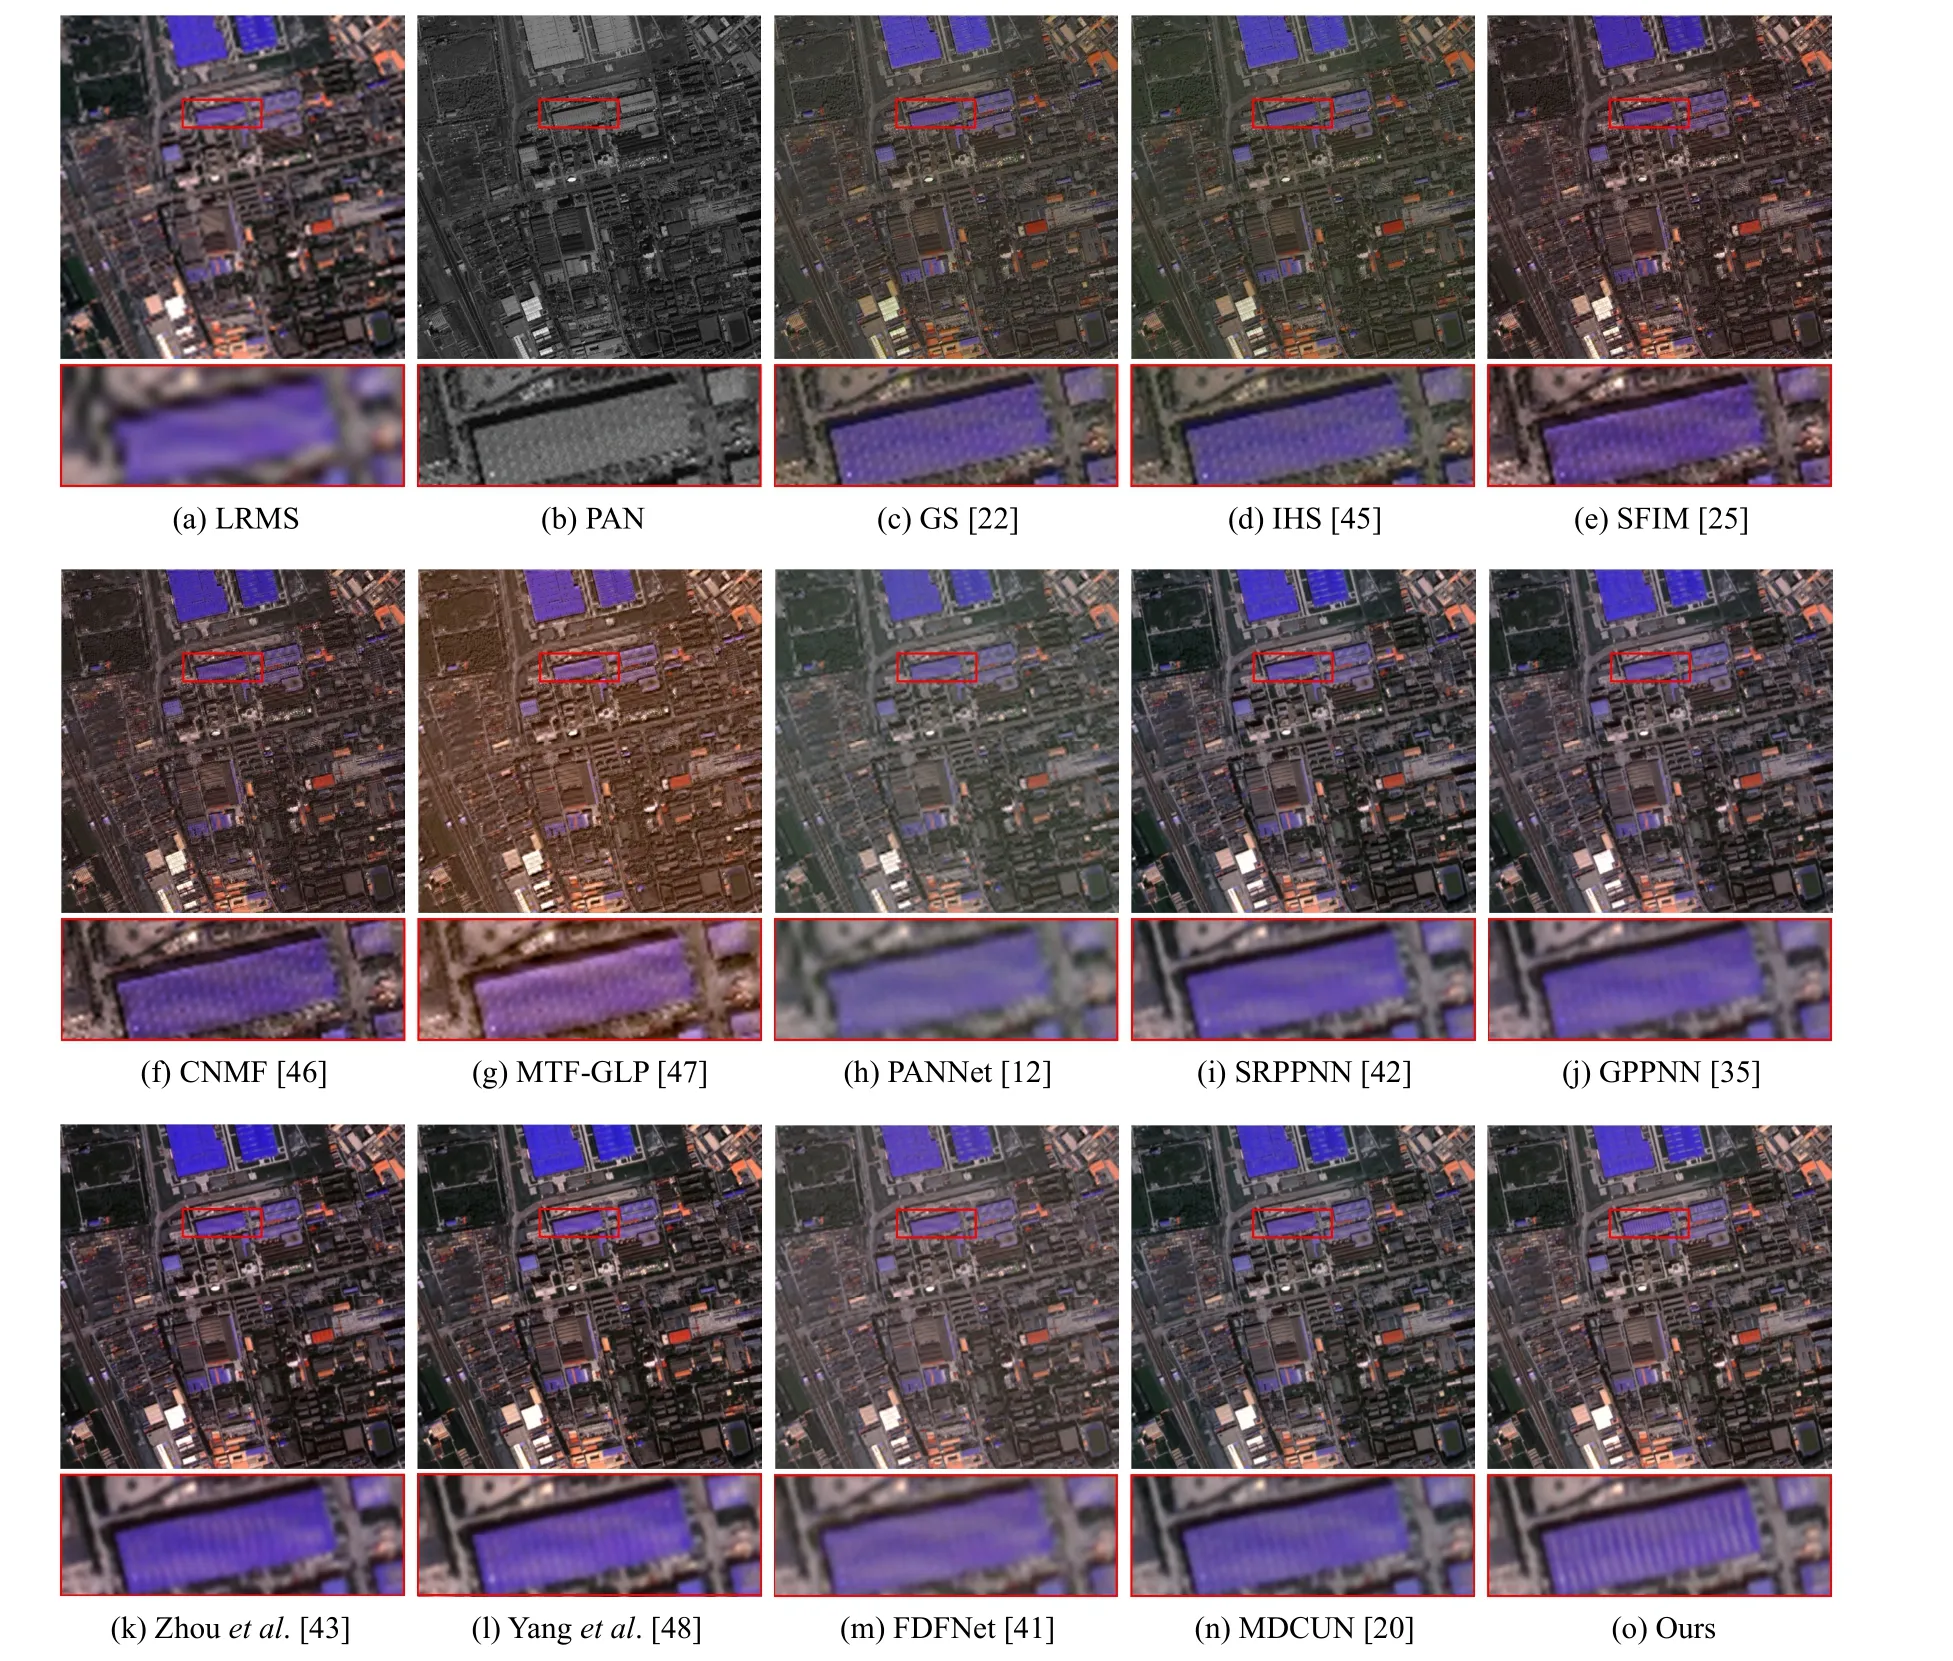
Fig.9.Visual comparison on the WorldView-II dataset in full-resolution validation.Our result better maintains the texture and color fidelity of the buildings.Please see zoomed-in patches for details.

TABLE IV EFFICIENCY COMPARISON OF DIFFERENT METHODS ON THE GF-2 DATASET.THE BEST RESULTS ARE IN BOLD
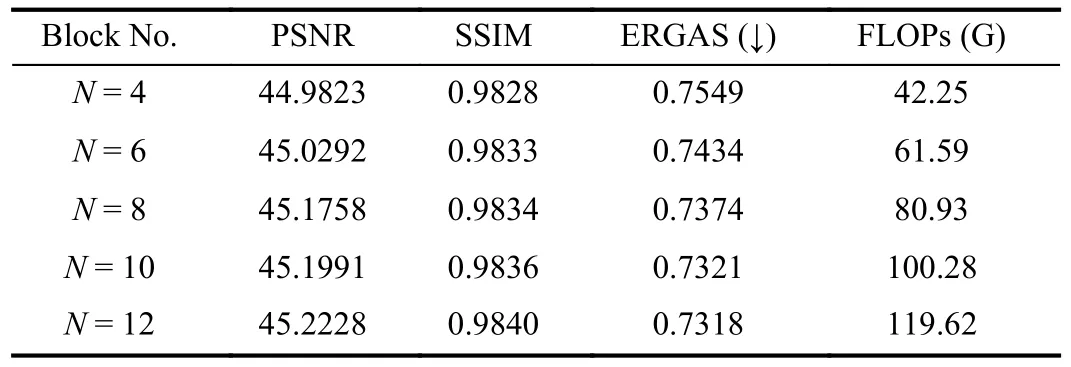
TABLE V COMPARISON OF DIFFERENT AMOUNTS OF TSF BLOCK (BLOCK NO.)N.THE SIGN (↓) INDICATES THAT THE SMALLER THE VALUE, THE BETTER THE PERFORMANCE.FLOPS INDICATES THE NUMBER OF FLOATING POINT OPERATIONS OF THE MODEL
The Effectiveness of the SMSA Block: The SMSA block is a necessary design in the TSF block, which is capable of reweighting spectrums and capturing spatial information.In our ablation study, we remove the SMSA block to verify the effectiveness.We can see in Fig.10(e) that the result suffers from spectral distortion without the SMSA block.Besides, as shown in Table VI-III), the SMSA block is an effective designfor a nicer performance.

TABLE VI ABLATION STUDY ON FOUR DIFFERENT CONFIGURATIONS.THE BEST AND SECOND BEST RESULTS ARE IN BOLD AND UNDERLINE

Fig.10.Visual comparison of the ablation study.(c)-(f) show vague details and grid artifacts due to the absence of the integral components as a whole network.Please see zoomed-in patches for details.
The Influence of the Multi-Scale Loss Component: In this part, the multi-scale loss LDEMis involved in implementing loss component experiments.We only use the Frobenius norm to constrain the whole network.As shown in Fig.10(f), grid artifacts appear in the result without the multi-scale loss.We can also observe in Table VI-IV) that the introduction of the multi-scale loss LDEMcan notably improve the model performance.
V.CONCLUDING REMARKS
In this paper, we propose a novel framework composed of two main modules for pan-sharpening, namely PAPS-Net,which can effectively enhance the details of LRMS images and produce appealing HRMS images.The detail enhancement module (DEM) enhances the LRMS images by obtaining the extra information from multi-scale PAN images.Besides, the progressive fusion module (PFM) fuses the features of varying depths from enhanced LRMS and PAN images to gradually integrate the information.A series of ablation studies have been carried out to verify the effectiveness of each module.Furthermore, experimental results on several widely-used datasets are also provided to demonstrate the advances of our method in comparison with other state-ofthe-art methods both quantitatively and qualitatively.However, when there are more spectral bands of LRMS images,such as images captured by Landsat8, like most deep-learning-based methods [18], [25], [41], [60], the network trained on a satellite dataset with four spectral bands cannot be generalized to another satellite with more bands.This problem can be solved by modifying the input channels in the DEM and retraining the network with the new dataset, however, it is hardly practical.Therefore, designing an adaptive component to increase the generalization of the PAPS-Net for diverse spectral bands is desired as our future work.
杂志排行
IEEE/CAA Journal of Automatica Sinica的其它文章
- Reinforcement Learning in Process Industries:Review and Perspective
- Communication Resource-Efficient Vehicle Platooning Control With Various Spacing Policies
- Virtual Power Plants for Grid Resilience: A Concise Overview of Research and Applications
- Equilibrium Strategy of the Pursuit-Evasion Game in Three-Dimensional Space
- Robust Distributed Model Predictive Control for Formation Tracking of Nonholonomic Vehicles
- Stabilization With Prescribed Instant via Lyapunov Method
