Predicting microseismic,acoustic emission and electromagnetic radiation data using neural networks
2024-02-29YngyngDiEnyunWngZhonghuiLiXiofeiLiuToHungJijieYo
Yngyng Di ,Enyun Wng ,Zhonghui Li ,Xiofei Liu ,To Hung ,Jijie Yo
a School of Materials Engineering,Changshu Institute of Technology,Suzhou,215506,China
b Key Laboratory of Gas and Fire Control for Coal Mines (China University of Mining and Technology),Ministry of Education,Xuzhou,221116,China
c School of Safety Engineering,China University of Mining and Technology,Xuzhou,221116,China
d State Key Laboratory of Coal Resources and Safe Mining,China University of Mining and Technology,Xuzhou,221116,China
Keywords:Microseism Acoustic emission Electromagnetic radiation Neural networks Deep learning Rockburst
ABSTRACT Microseism,acoustic emission and electromagnetic radiation (M-A-E) data are usually used for predicting rockburst hazards.However,it is a great challenge to realize the prediction of M-A-E data.In this study,with the aid of a deep learning algorithm,a new method for the prediction of M-A-E data is proposed.In this method,an M-A-E data prediction model is built based on a variety of neural networks after analyzing numerous M-A-E data,and then the M-A-E data can be predicted.The predicted results are highly correlated with the real data collected in the field.Through field verification,the deep learning-based prediction method of M-A-E data provides quantitative prediction data for rockburst monitoring.
1.Introduction
With the increase in coal mining depth,the resulting rockburst hazard is becoming more serious (Jiang et al.,2006;Hirata et al.,2007;Dou et al.,2018;Keneti and Sainsbury,2018;Gong et al.,2021;Di et al.,2023).During the occurrence of rockburst,coal and rock masses will be violently released,thus causing considerable casualties and equipment damage in the working faces or roadways (Li et al.,2016;Zhao et al.,2018b;Qiu et al.,2020;Dong et al.,2023).Due to different production conditions and other factors in various mines,rockburst hazards can hardly be monitored and predicted effectively,which poses a major risk to the lives of coal workers and seriously hinders normal production of coal mines (Liu et al.,2017;Gong et al.,2019a;Song et al.,2019;Wang et al.,2021;Guo et al.,2022).Therefore,it is essential to study the rockburst hazards in the working faces of underground mines.
Various guidelines and criteria for rockburst hazards have been proposed from multiple perspectives,such as stress waves,electromagnetic waves,coal strength,and impact energy,based on monitoring methods including microseismic (MS),acoustic emission (AE),electromagnetic radiation (EMR),and drilling cutting weight(Huang and Liu,2013;Guo et al.,2017;Cai et al.,2018;Kim and Cho,2019;Vennes et al.,2020;Di and Wang,2021a;Johnson et al.,2021).Early-warning models of rockburst based on MS,AE,EMR and other monitoring methods have been established through coordinated monitoring of multiple methods and integration of several indices (Li et al.,2018;Zhou et al.,2020a;Di and Wang,2021b).However,the above studies have all been conducted for rockburst hazards in accordance with various data.Recently,some scholars have attempted to predict the MS,AE and EMR (M-A-E)data (Gong et al.,2019b;Zhang et al.,2020;Zhou et al.,2020b;Su et al.,2021;Agrawal et al.,2022),but there is still a lack of comprehensive prediction methods for M-A-E data.Rational prediction and quantitative analysis of data in the future will dramatically improve the timeliness.
Deep learning has unique advantages in processing time-series data and has achieved fruitful research in terms of time-series data prediction,such as stock price,subway passenger flow,and the number of infected people in epidemics.Scholars usually analyzed the collected drilling cuttings and M-A-E data for monitoring rockburst hazards (Jiang et al.,2010;Humphrey et al.,2013;LeCun et al.,2015;Mazaira and Konicek,2015;Ranzato et al.,2015;He et al.,2016;Zhao et al.,2018a;Kong et al.,2022).However,prediction of M-A-E data is rarely reported in the literature.
In this study,an M-A-E data prediction model based on multiple neural networks is established by taking the M-A-E monitoring data of a coal mine as the basis and using a continuous Fourier transform to investigate the development trend of M-A-E data.Furthermore,the M-A-E data are predicted with the established model,and then the prediction results and model performance are analyzed.This research can provide quantitative prediction data for rockburst monitoring.
2.Continuous Fourier transform of M-A-E data
The M-A-E data collected from the 5521-24 working face of a mine from November 1,2020 to May 1,2021 were selected as the original data set.The M-A-E data after continuous Fourier transform are shown in Fig.1.One can see that after continuous Fourier transform,the M-A-E data become more stable compared to the original data.The transformed AE and EMR data intensities of the coal are weakened,and the microseismic energy mostly ranges from 5000 J to 10,000 J.The M-A-E data all show a considerable increase during January 20-31,February 22-28,and March 15-18,2021,demonstrating a trend of pressure rise in the coal rock body during these three periods.The records of rockbursts on the site reveal that rockbursts occurred on January 31,March 1 and March 18,2021.

Fig.1.Continuous Fourier transform results of M-A-E data.
As shown in Fig.1,the effective M-A-E data generally develop smoothly at low intensities or increase slowly,but they rarely experience a high-intensity sudden increase in the short term.After continuous Fourier transform,the overall M-A-E data become even smoother.After continuous Fourier transform,the M-A-E data for the short-time high-intensity rockburst are eliminated.In addition,the transformed curve can reflect the development trends of M-A-E data,which is conducive to subsequent research on the quantitative prediction of M-A-E data.
3.M-A-E data prediction models based on deep neural networks
3.1.Introduction to prediction models
3.1.1.Autoregressive integrated moving average(ARIMA)prediction model
The ARIMA model is a classic time-series prediction method.The principle of this model is to consider the time-dependent data generated by monitoring events as a series of random sequential events and analyze the autocorrelation therein.In this way,a specific mathematical model is developed to describe this autocorrelation pattern of the serial data as well as to optimize the model.After optimization,it is possible to predict future time data from the collected time-series data.
3.1.2.Recurrent neural network (RNN) prediction model
The hidden state of RNN can preserve the historical data input to the RNN and better capture the correlation between data with a long time span.Therefore,the RNN has a natural advantage for processing time-series data.In addition,with the development of RNN,long short term memory recurrent neural network (LSTMRNN)introduces the structures such as memory cells,which makes LSTM-RNN superior to the conventional neural networks in terms of data prediction.The input of LSTM-RNN is string data that experience recursion through the hidden state at each time point.The network records historical data by memory cells and controls the flow of data by gating design.The network uses all the historical data.Such a design is more favorable for the prediction of timeseries data.
3.1.3.Convolutional neural network (CNN) prediction model
The CNN,which is often applied to the processing of image data,convolution computes the data in the whole input area (receptive field)to obtain the output.The CNN also employs all the historical time-series data to obtain the output.Compared with the conventional neural networks,it can offer better prediction results.In addition,CNN prediction is faster than RNN prediction because the characteristics of CNN make it possible to perform operations such as multiple inputs and multiple outputs.
3.2.Deep neural network-based M-A-E data prediction model
The M-A-E data prediction method consists of M-A-E data input,M-A-E data prediction model,and model analysis and evaluation,as illustrated in Fig.2.

Fig.2.M-A-E data prediction method.
3.2.1.M-A-E data input
First,the M-A-E data are input into the M-A-E data prediction method.Since the M-A-E data after continuous Fourier transform can reflect the development trends of M-A-E data,the transformed data are also input into the M-A-E data prediction method,which increases the data samples for M-A-E data prediction and is thus conducive to the training and optimization of the M-A-E data prediction model afterwards.
3.2.2.M-A-E data prediction
The models selected for the M-A-E data prediction method include ARIMA,RNN and CNN.These models predict the M-A-E data by analyzing the development pattern of massive M-A-E data.The ARIMA model is created by the Python data analysis technique,and the RNN and CNN models are created by MXNet.
3.2.3.Production of data sets
In the M-A-E data subjected to continuous Fourier transform and the M-A-E original data set,50% are taken as the training set,25%as the validation set,and the remaining 25%as the test set.In the completed data sets,there are 17,280 AE training samples,17,280 EMR training samples,6520 MS training samples,2880 AE validation samples,2880 EMR validation samples,1085 MS validation samples,2880 AE test samples,2880 EMR test samples and 1085 MS test samples.
3.2.4.Creation,training and testing of models
The ARIMA prediction model is created(Fig.3).The training data set is input into the ARIMA model,and then the model will differentially process the input data,calculate the autocorrelation coefficients,and estimate the parameters.After the completion of model creation,the model is validated and optimized by inputting the validation data set.Finally,the prediction is carried out with the test data set.
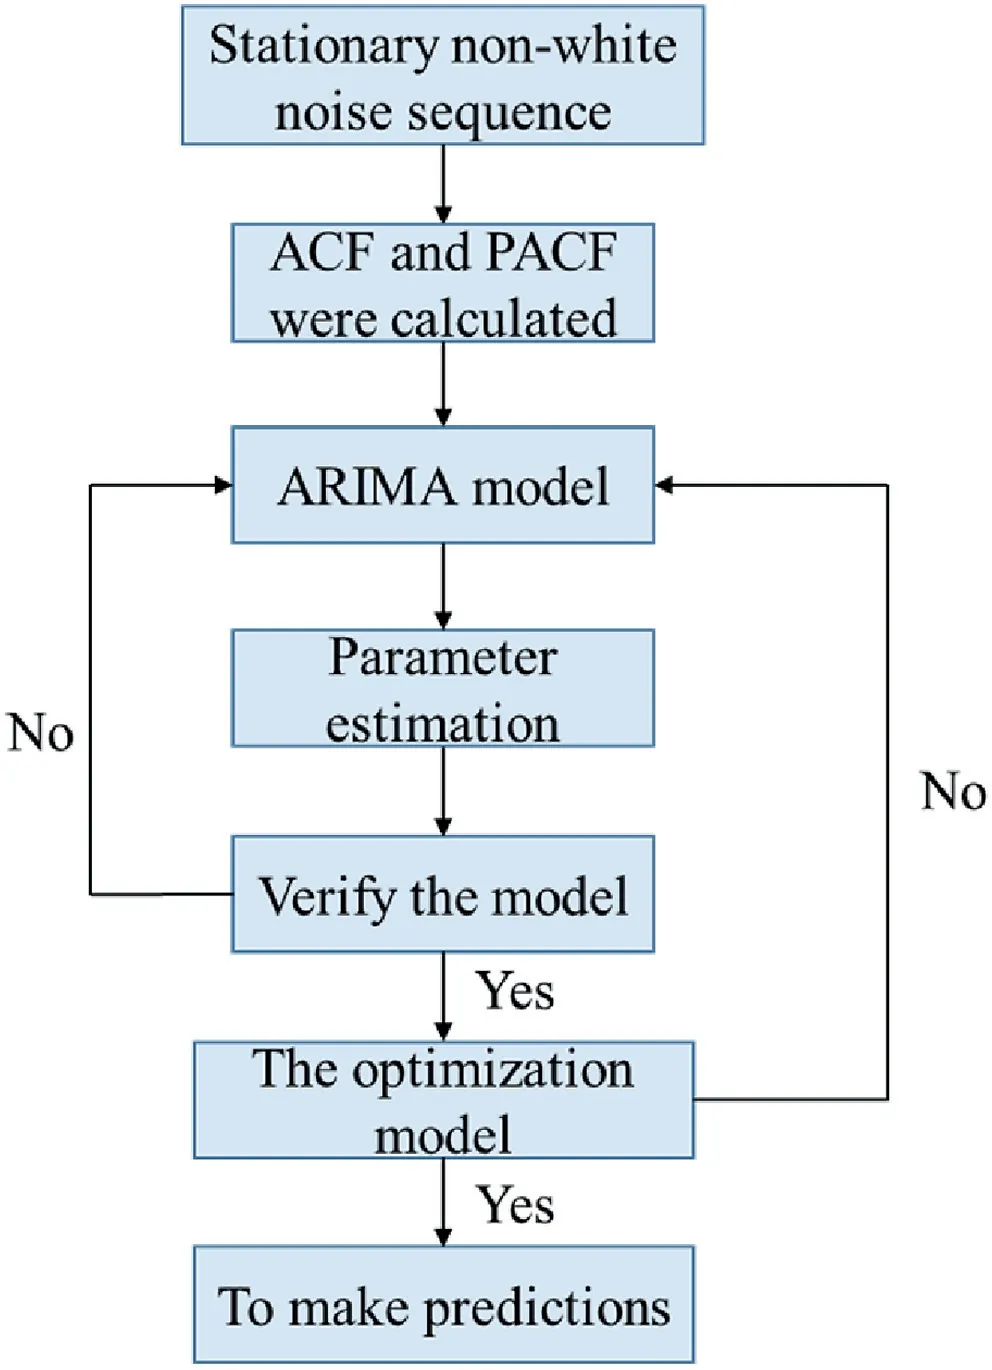
Fig.3.ARIMA model.
A method in which the input is single-index(e.g.MS,AE or EMR)data and the single-index data are predicted is called a single-input time-series prediction method.This method learns a mapping that can link historical time-series data to future ones by analyzing a large amount of data.The implementation process is demonstrated in Fig.4.In the first input,the input isnconsecutive historical timeseries data,and the output is the predicted value of the first timeseries data.The second input is then-1 consecutive data after the first input,which is spliced with the first output.Then,the output is the predicted value of the second time-series data after the historical data,i.e.the future data are predicted based on the historical data.

Fig.4.Single-index prediction model.
The single-index time-series prediction method can employ the ARIMA model,the RNN model,or the CNN model.All of these models work by learning a mapping out of the data,where the inputs are all a continuous string of historical data and the outputs are all the prediction data for the next time step.The single-input RNN model is shown in Fig.5.This is followed by the first LSTM layer.The input is passed to obtain the hidden state and the output.Meanwhile,the hidden state continues to be passed backward until it is passed to the last LSTM module in this layer.The parameters continue to be passed until the last LSTM layer.The model is optimized by continuously reducing errors according to the loss function.After that,the model is validated with the validation data set.Finally,the prediction results are tested by the test data set.

Fig.5.Single-input RNN prediction model.
The single-input CNN model is shown in Fig.6.The input is historical data (8 data points shown in Fig.6).Next,the convolutional layer is connected,which can connect multiple convolution layers to extract higher-dimensional and more global features.Subsequently,the maximum pooling layer is connected,and the number of parameters as well as the sensitivity of the model to data location is reduced.The final output is obtained after connecting the fully connected layer,i.e.the prediction data.

Fig.6.Single-input CNN prediction model.
Multiple single-input prediction models can be used for the prediction of multi-index time-series data,but they require more computing power and correspond to poor timeliness.In addition,a multi-input prediction model(Fig.7)is widely used.This model can input multiple sets of original data to obtain multiple sets of prediction data.Taking Fig.7 as an example,the first input has two strings,and each string containsncontinuous time-series data.The output has two strings,and each string contains two predictions.The input data of the second time contain the output data of the first time,and the input data of the third time contain the output data of the first and second times,thus the output of the last time is all forecast data.

Fig.7.Multi-input prediction model.
Because CNN can better deal with multi-dimensional input problems,it is often used to build a multi-input and multi-output model,as shown in Fig.8.The input of the multi-input and multioutput CNN model is a two-dimensional data set with a size of 2 × 8.After that,the model extracts data features through the convolution layer and is adjusted to 64 channels.The model is prevented from overfitting by the pooling layer and discarding method.Finally,the prediction data with a size of 2 × 2 are obtained through the fully connected layer.
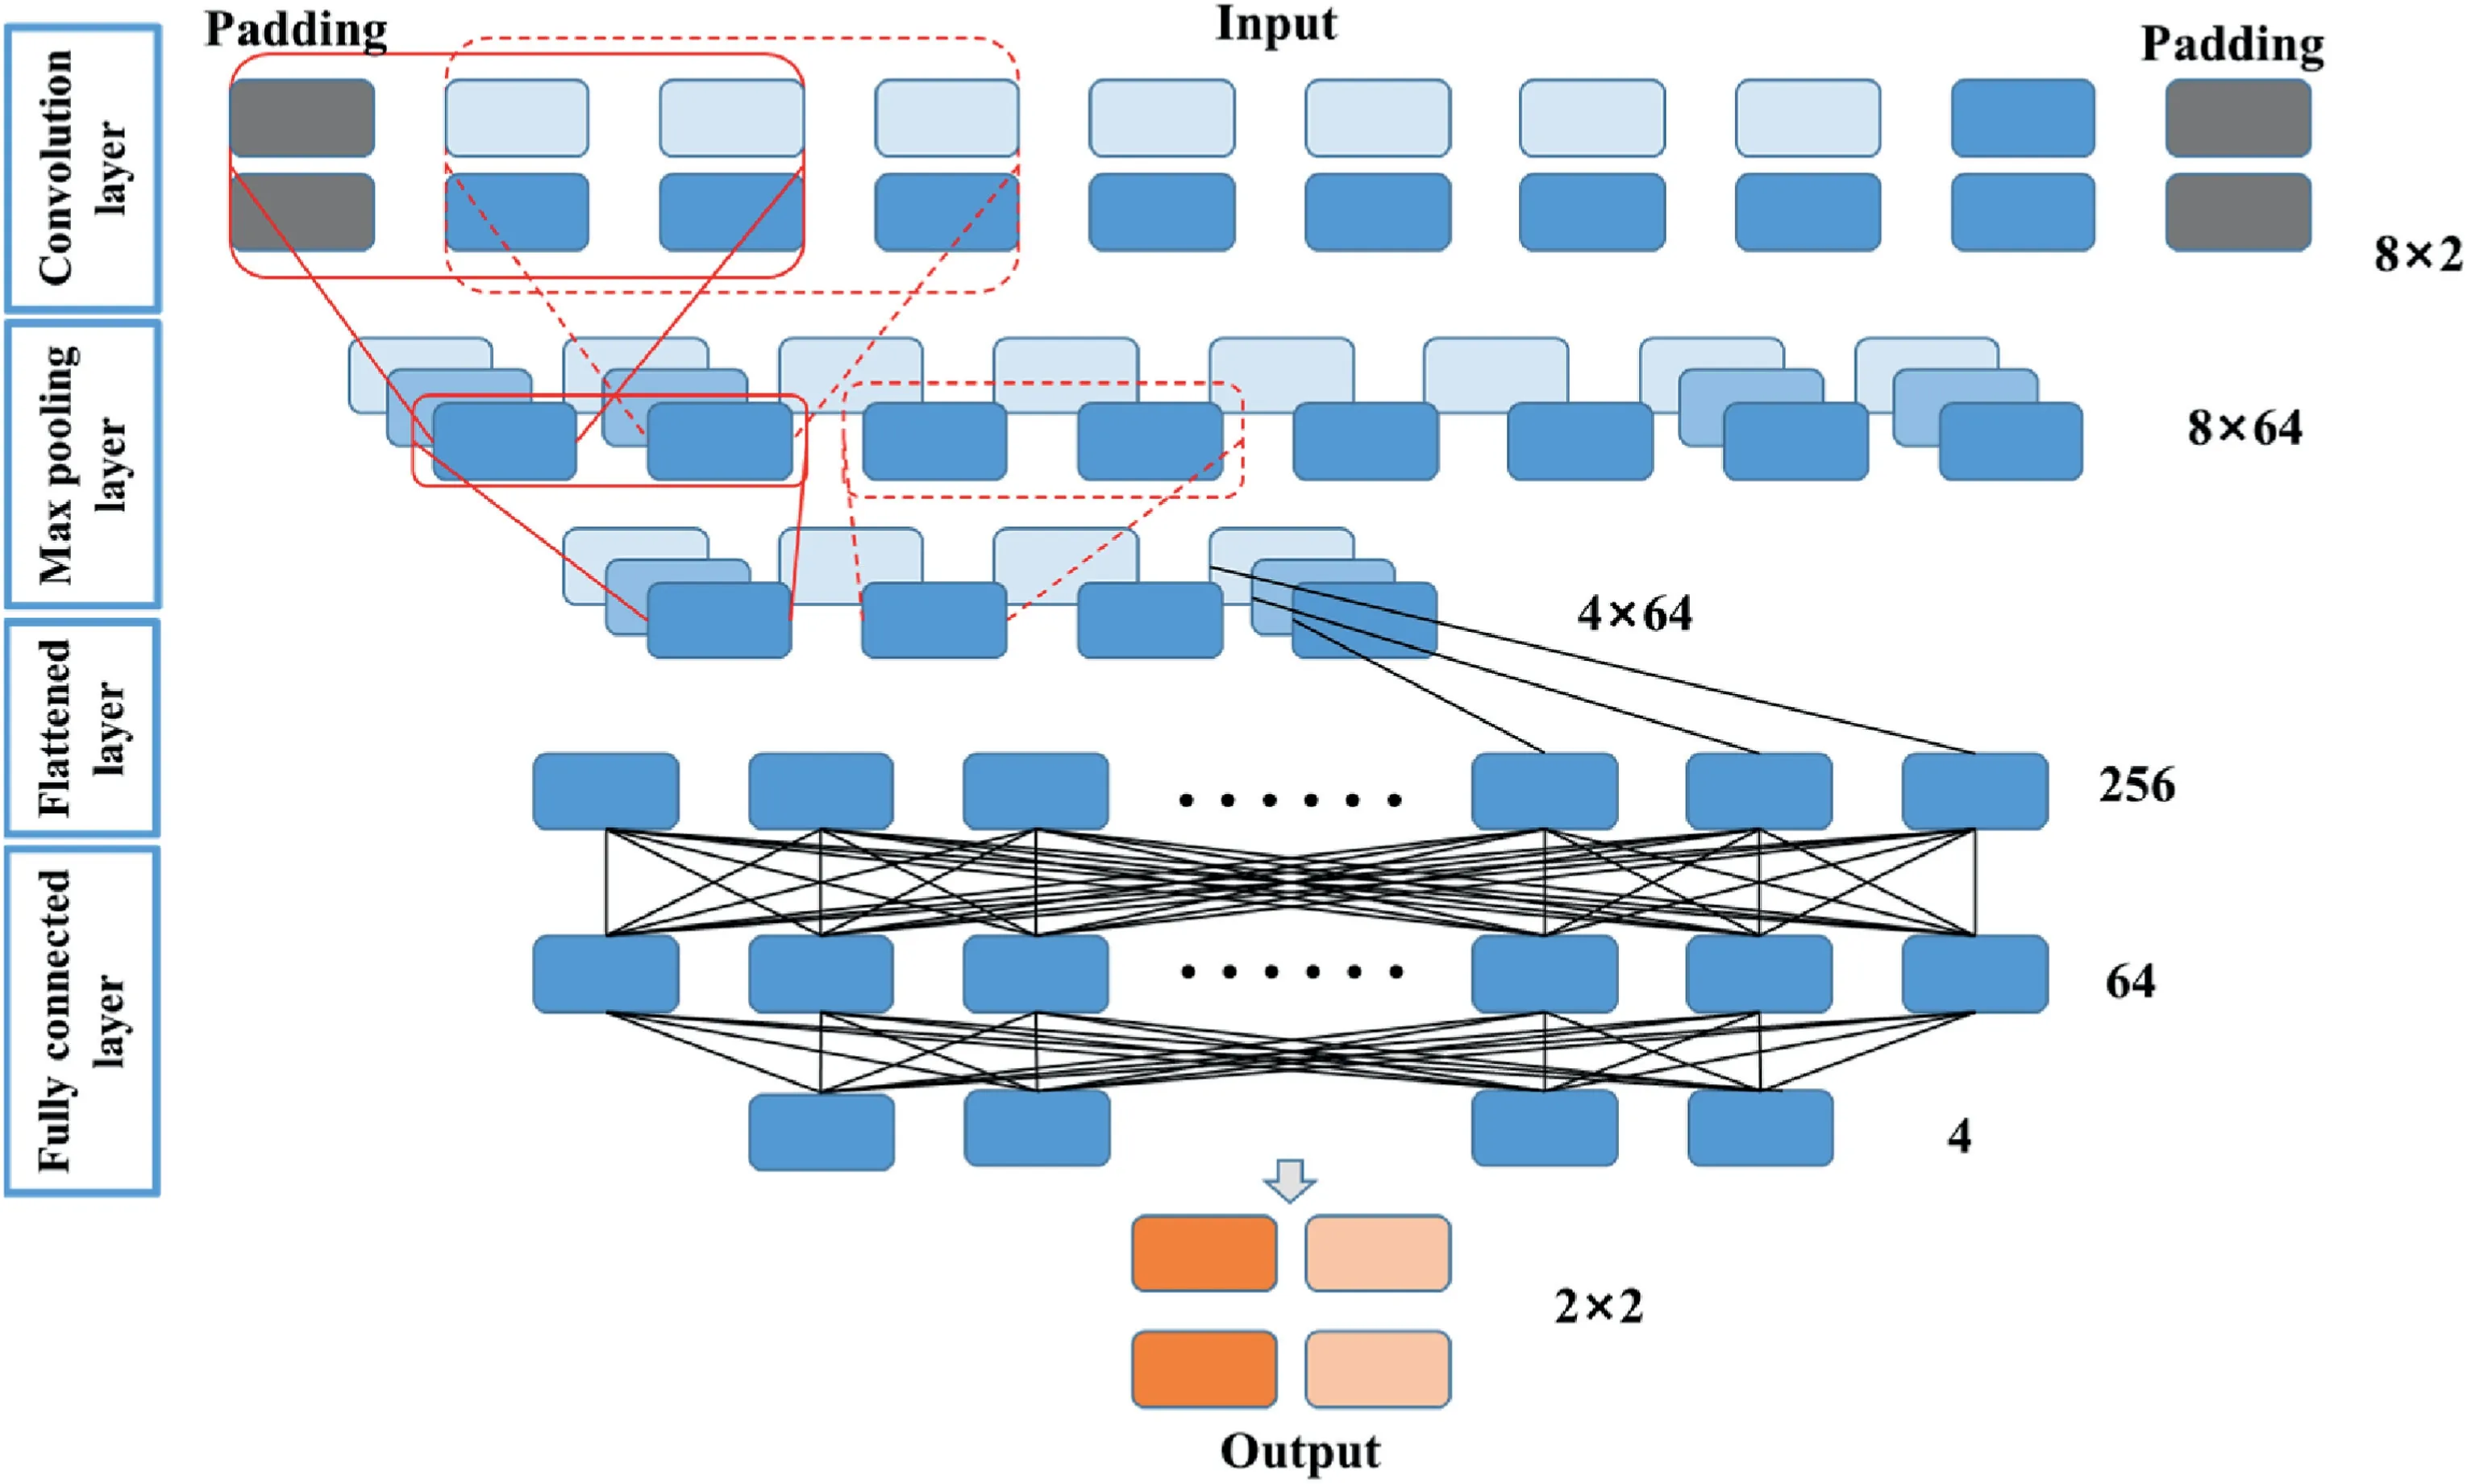
Fig.8.Multi-input CNN prediction model.
The input and output of the optimized single-input prediction model both have 72 continuous data points.Since the multi-input and multi-output CNN model inputs M-A-E data simultaneously,the input and output sizes of the CNN model are 3 ×72.
After each model is verified and optimized,the hyperparameters are obtained as follows: single-input RNN has 3 LSTM layers,single-input CNN has 12 convolutional layers,and multiinput and multi-output CNN has 14 convolutional layers.For all the models,the learning rate is 0.01,the optimization algorithm is Adam,and the loss function is MSE.All the model training losses and validation losses drop below 0.02 after 300 epochs.
3.2.5.Analysis and evaluation of model prediction results
The prediction results of M-A-E data by single-input and multiinput prediction models are analyzed and evaluated comprehensively.
4.Prediction results and model performance analysis
4.1.Analysis and evaluation of model prediction results
The prediction results of the model are usually evaluated qualitatively by plotting the curves of the test and prediction data from various models in the corresponding time periods on a graph and then comparing the curve trends and correlations between the test and prediction data.If the curves exhibit the same trend and high correlations or even overlap in large sections,it indicates that the prediction results fit well with the test data,further suggesting that the model yields good prediction results.Otherwise,the model produces poor prediction results.The evaluation indices are written as follows:
where MAE is the mean value of the absolute error between the predicted and true values,RMSE is the square root of the ratio of the square of the error between the predicted and true values to the number of samples,MAPE is the mean of the absolute percentage error between the predicted and true values,andR2is the degree of fitting between the predicted and true values.The smaller the values of MAE and RMSE are,the more accurate the model prediction is.MAPE,on the other hand,shows the relative error between the predicted and true values,and the smaller the value is,the more accurate the model prediction is.MAPE is employed to evaluate the performance of different models.R2reflects the reliability of the prediction results;when its value is closer to 1,the predicted value is closer to the true value,and thus the model fits better.
4.2.Analysis of model test results
After being trained and validated,the single-input RNN prediction model is tested several times by inputting the M-A-E test data set.The test results in January 2021 are shown in Fig.9.In Fig.9,the black and red lines represent the true values of the data in the test set and the predicted values of the model,respectively.From Fig.9a-c,it can be observed that the model achieves excellent predictions of M-A-E data.In addition,the errors between the predicted and true values are small,which means that the model fits well.The trends of the predicted and true values and their correlation are qualitatively shown in Fig.9.On January 29,the RNN predicted large fluctuations in the M-A-E data for the following three days.The AE prediction data first decreased and then increased.The EMR prediction data increased in fluctuation.The MS prediction data increased abruptly several times,all of which are the responses to rockburst hazards.The quantitative evaluation method is utilized for better evaluation of the model.

Fig.9.Prediction results of the single-input RNN model in January 2021.
The quantitative evaluation results are given in Tables 1-3.Through calculation,the single-input RNN model has relatively small MAE,RMSE and MAPE values for AE amplitude,EMR amplitude and MS energy prediction results,and theR2values of the model are 0.82,0.74 and 0.79,respectively,thus the prediction is relatively accurate.
The prediction results of multiple single-input models in January 2021 are shown in Fig.10.Fig.10a-c qualitatively reflects that the predictions of the ARIMA,CNN and LSTM-RNN models are excellent for AE amplitude,EMR amplitude and MS energy,and the predicted and true values are well correlated with small errors.These models fit well.Furthermore,the models are evaluated with the quantitative evaluation method,and the evaluation results are shown in Tables 4-6.

Fig.10.Prediction results of multiple single-input models in January 2021.

Fig.11.Prediction results of multiple single-input models in February 2021.

Fig.12.Prediction results of multiple single-input models in March 2021.
The calculated MAE,RMSE and MAPE values of multiple singleinput models are small for the prediction results of M-A-E data,and theR2values of the CNN and LSTM-RNN models are above 0.7,which illustrates the remarkable prediction results of the models.The prediction results of multiple single-input models in February and March 2021 are shown in Figs.11 and 12.Similar to those in January 2021,the quantitative evaluation results in these two months are also excellent.
Tables 4-6 show the quantitative evaluation results of the three single-input models ARIMA,CNN and LSTM-RNN.In terms of the prediction performance of M-A-E data,the ARIMA model shows the worst prediction performance for two reasons:first,it is incapable of capturing the relationship between the data in a long time-span data;second,its mapping between the predicted and true values is simpler.Compared with the ARIMA model,the CNN and LSTM-RNN models are notably improved in the prediction evaluation indices MAE,RMSE,MAPE andR2.The LSTM-RNN model shows the best prediction performance in all the evaluation indices.In conclusion,the CNN and LSTM-RNN models have good prediction results for single-input time series and can predict the M-A-E data in advance.The above findings are crucial for the prediction of rockburst hazards.After the training and validation of the multi-input CNN prediction model are completed,the model is tested by inputting the M-A-E test data set at one time.The prediction results are depicted in Fig.13.In Fig.13,the black and gray lines represent the true values of the test data set,while the red,green and blue lines represent the M-A-E prediction values of the model.From Fig.13ac,it can be qualitatively seen that the predictions for AE amplitude,EMR amplitude and MS energy are excellent,and the error between the predicted and true values is small.The model fits well.The quantitative evaluation method is selected for better evaluation of the model.The quantitative evaluation results are listed in Tables 7-9.

Fig.13.Prediction results of the multi-input CNN model.
One can see from Tables 7-9 that the MAE,RMSE and MAPE values are all small,and theR2values are above 0.7.The model prediction results are effective.According to the prediction performance of M-A-E data,the multi-input CNN prediction model corresponds to slightly larger errors in the prediction evaluation indices MAE,RMSE,MAPE andR2in comparison with the singleinput CNN and LSTM-RNN models.However,it is superior to the single-input models in prediction timeliness,as its prediction time is substantially reduced,as listed in Table 10 (20 min less than the single-input models on average).In summary,considering its better timeliness and remarkable prediction effect on M-A-E data,the CNN model is selected for the prediction of multi-input time series.

Table 1Evaluation of AE prediction results of the single-input RNN model.

Table 2Evaluation of the EMR prediction results of the single-input RNN model.
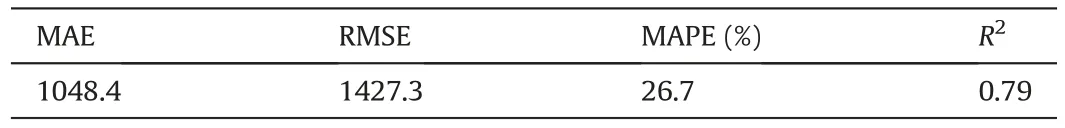
Table 3Evaluation of the MS prediction results of the single-input RNN model.

Table 4Evaluation of AE prediction results of multiple single-input models.
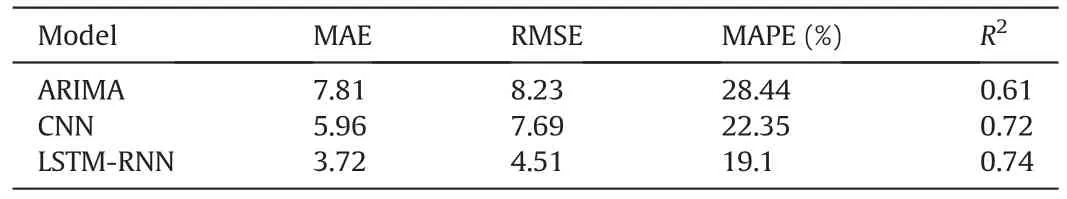
Table 5Evaluation of the EMR prediction results of multiple single-input models.
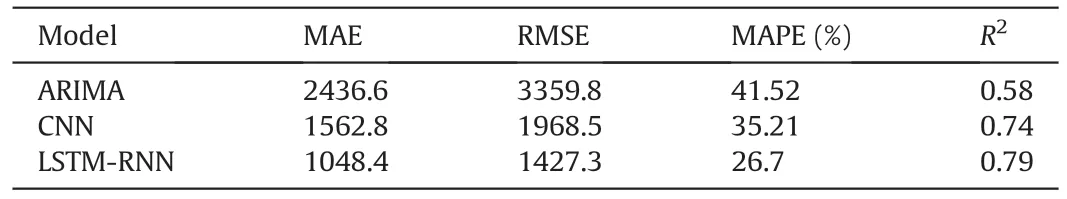
Table 6Evaluation of MS prediction results of multiple single-input models.
5.Discussion
The conventional methods of M-A-E prediction for rockburst are based on manual analysis of the collected M-A-E data.However,these methods lack timeliness and accuracy and depend highly on experience.There is a lack of integrated prediction method of M-AE data based on deep neural networks.
MS monitoring is of lower frequency and collects fewer data,while AE and EMR monitoring is of higher frequency and collects richer data.The latter is more suitable for the analysis and prediction of data.Considering this fact,this paper performs the integrated prediction of M-A-E data.RNN,single-input CNN and multi-input CNN models have advantages in rockburst data prediction.Since RNN,single-input CNN and multi-input CNN models have more hidden layers,which gives them larger capacities,they can learn deep and relatively complex features more easily.The deep neural network is also more inclusive of non-optimal solutions and optimizes the use of nonconvex nonlinearities.Consequently,it provides better results in processing a large amount of rockburst M-A-E data.

Table 7Evaluation of the prediction results of the multi-input CNN model in January 2021.

Table 8Evaluation of the prediction results of the multi-input CNN model in February 2021.
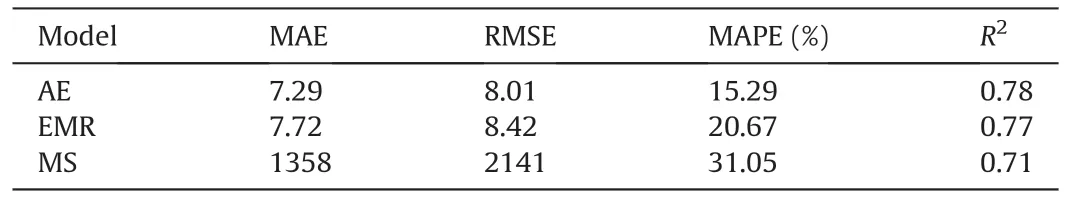
Table 9Evaluation of the prediction results of the multi-input CNN model in March 2021.

Table 10Prediction speed of the models.
The trained RNN,single-input CNN and multi-input CNN models can automatically (without parameter adjustment) and efficiently predict the data on a GPU.In comparison with the conventional ARIMA method,RNN,single-input CNN and multi-input CNN models achieve aR2value of above 0.7 and correspond to better timeliness.In particular,the multi-input CNN model makes the fastest prediction,requiring only 30 min to predict the M-A-E data for the next three days.The method of predicting the M-A-E data of rockbursts,which quickly and accurately provides quantitative data for monitoring,is of significance for the prediction of rockbursts in the coal mines.The analysis was carried out only in the coal field,where M-A-E data were simultaneously monitored,which is conducive to the comprehensive prediction.For other fields where M-A-E monitoring systems are not arranged at the same time,it is difficult to carry out analysis in other fields.However,with the application of the M-A-E monitoring system in other fields,the prediction method proposed in this study will have universality.
6.Conclusions
In this study,a deep learning-based prediction method for M-AE data is proposed.Meanwhile,several models are employed for the prediction of M-A-E data.The following conclusions are drawn:
(1) The M-A-E data after continuous Fourier transform are added to the prediction training set.Then,various M-A-E data prediction models(single-input and multi-input time-series prediction models) based on deep learning are established,optimized by training and validation,and evaluated for their performance effects in the test set.
(2) By calculating evaluation indices including MAE,RMSE,MAPE andR2,the prediction results of the ARIMA,CNN and LSTM-RNN models in the M-A-E data prediction task are analyzed qualitatively and quantitatively.The results show that both single-input and multi-input prediction models can predict M-A-E data well.The CNN and LSTM-RNN models both haveR2values above 0.7,and they can predict M-A-E data in advance.
Declaration of competing interest
The authors declare that they have no known competing financial interests or personal relationships that could have appeared to influence the work reported in this paper.
Acknowledgments
This work was supported by the National Natural Science Foundation of China(Grant No.51934007)and the Natural Science Foundation of Jiangsu Province,China (Grant No.BK20220691).
杂志排行

Journal of Rock Mechanics and Geotechnical Engineering的其它文章
- Determination of uncertainties of geomechanical parameters of metamorphic rocks using petrographic analyses
- Evaluation of excavation damaged zones (EDZs) in Horonobe Underground Research Laboratory (URL)
- On the calibration of a shear stress criterion for rock joints to represent the full stress-strain profile
- Effect of dynamic loading orientation on fracture properties of surrounding rocks in twin tunnels
- Experimental study on the influences of cutter geometry and material on scraper wear during shield TBM tunnelling in abrasive sandy ground
- Effect of fracture fluid flowback on shale microfractures using CT scanning