Effect of dynamic loading orientation on fracture properties of surrounding rocks in twin tunnels
2024-02-29ZeDengZhemingZhuLeiZhouLeijunJinweiHungYoZhng
Ze Deng ,Zheming Zhu ,Lei Zhou,* ,Leijun M ,Jinwei Hung ,Yo Zhng
a Key Laboratory of Deep Earth and Engineering (Ministry of Education),College of Architecture and Environment,Sichuan University,Chengdu,610065,China
b Failure Mechanics and Engineering Disaster Prevention Key Laboratory of Sichuan Province,College of Architecture and Environment,Sichuan University,Chengdu,610065,China
c Institute for Disaster Management and Reconstruction,Sichuan University,Chengdu,610065,China
Keywords:Twin-tunnel Dynamic load Split Hopkinson pressure bar (SHPB)Fracture mode Stress distribution Displacement field distribution
ABSTRACT For expedited transportation,vehicular tunnels are often designed as two adjacent tunnels,which frequently experience dynamic stress waves from various orientations during blasting excavation.To analyze the impact of dynamic loading orientation on the stability of the twin-tunnel,a split Hopkinson pressure bar (SHPB) apparatus was used to conduct a dynamic test on the twin-tunnel specimens.The two tunnels were rotated around the specimen’s center to consider the effect of dynamic loading orientation.LS-DYNA software was used for numerical simulation to reveal the failure properties and stress wave propagation law of the twin-tunnel specimens.The findings indicate that,for a twin-tunnel exposed to a dynamic load from different orientations,the crack initiation position appears most often at the tunnel corner,tunnel spandrel,and tunnel floor.As the impact direction is created by a certain angle(30°,45°,60°,120°,135°,and 150°),the fractures are produced in the middle of the line between the left tunnel corner and the right tunnel spandrel.As the impact loading angle (α) is 90°,the tunnel sustains minimal damage,and only tensile fractures form in the surrounding rocks.The orientation of the impact load could change the stress distribution in the twin-tunnel,and major fractures are more likely to form in areas where the tensile stress is concentrated.
1.Introduction
Existing tunnels are often subjected to dynamic disturbance loads from different orientations during excavation,such as falling debris,falling rocks,and rockburst(Ranjith et al.,2017;Zhang et al.,2021),as shown in Fig.1.These dynamic disturbances could develop fissures in the surrounding rocks,which,if they continue to spread,could lead to the tunnel’s collapse(Zhou et al.,2010,2012;Wang et al.,2020).During the failure of the twin-tunnel,the fracture modes will be distinct from those of a single tunnel when subjected to dynamic disturbance loads.Understanding these fracture modes of the twin-tunnel may aid in the creation and support of real engineering.The study of the damage characteristics of a twin-tunnel subjected to dynamic stresses in multiple directions is,thus,of significant engineering importance.

Fig.1.Sketch of the tunnel subjected to impact loads in different directions.
Many researchers have examined the failure properties of rock mass under static and dynamic loads in the existing literature(Huang et al.,2018;Cai et al.,2020;Li et al.,2020a,b;Niu et al.,2020;Wu et al.,2020).By varying material properties,geometry,the number of flaws,and loading conditions,the fracture mode of rock masses under diverse situations has been explored.Lin et al.(2020) performed a series of uniaxial compression tests on jointed bi-circular hole rock samples and studied the failure behavior between the joints and holes.Using a mix of static,dynamic,and kinematic approaches,Zhu et al.(2022)and Zhou et al.(2017) studied a rock mass having two rectangular holes,the energy evolution features surrounding the hole and the damage process of the specimen were obtained.The open-hole specimens were employed to study the fracture characteristics of the fractured rocks subjected to varied loading circumstances,not only can the stability of the cracked rock mass be calculated,but the tunnel’s mechanical behavior under dynamic load can also be investigated.Hao et al.(2020) conducted physical model tests and numerical simulations to determine the relationship between loading rate and degree of tunnel damage under a certain dynamic load.Using a tunnel model and dynamically loaded model tunnels with varied cross-sectional forms,Yang et al.(2019a,b) show that the tunnel’s cross-sectional shape will have a substantial impact on the tunnel’s dynamic performance.
In recent years,numerical simulation has emerged as one of the most important methods for studying the damage behavior of rock masses subjected to dynamic load (Liu et al.,2019,2022;Baranowski et al.,2020;Chao et al.,2020;Liao et al.,2021).Zhu et al.(2021) utilized the AUTODYN algorithm to model the dynamic propagation features of the pre-crack subjected to blasting load,crack propagation trajectories,and fracture modes.Using PFC3D code,Sun et al.(2022)investigated the relationship between the form of the pulse and the influence of strain rate,and simulated the dynamic characteristics of rock subjected to an impact force.Using FLAC3D code,Qin et al.(2020) investigated the impacts of tunnel model width,height,burial depth and lateral pressure coefficient on the surrounding rocks.Ji et al.(2021) evaluated the damage process of a tunnel subjected to repeated blasting loads using LS-DYNA and presented the factors impacting the maximum damage depth of the surrounding rocks.
In addition to the numerous investigations into the effects of the load type and rock imperfections on its mechanical properties,researchers have begun to examine the influence of load orientation on the mechanical properties and damage behavior of the tunnel envelope.Wu et al.(2019) conducted the uniaxial compression tests on sandstone specimens including two inverted U-shaped perforations,and they determined that the relative placements of the two U-shaped holes had a substantial impact on the specimens’strength.Nevertheless,only the damage behavior of the specimens under static load was tested,and the influence of dynamic load orientation was not addressed.Using a drop test apparatus,Ying et al.(2022) investigated the fracture modes of a fractured tunnel subjected to impact loads from multiple directions,and the results indicated that the diverse loading directions resulted in distinct damage patterns in the specimens.Using laboratory test and simulation,Li et al.(2022) showed that the orientation of the blast loading has a significant influence on the fracture pattern of the nearby fractured tunnel.Yet,these analyses did not account for the influence of load orientation on the failure behavior of the twin-tunnel subjected to dynamic load,which frequently existed in two adjacent tunnels in real engineering.
The main objective of this research is to reveal the fracture properties of the twin-tunnel subjected to different dynamic loading orientations.Green sandstone is employed to make the twin-tunnel specimen,a classical split Hopkinson pressure bar(SHPB) device is employed as a dynamic loading device,and the fracture process of the tunnel model can be observed using a highspeed camera and the digital image correlation (DIC) method.Moreover,the Ridel-Hiermaier-Thoma (RHT) model is used to represent the fracture behavior of the twin-tunnel subjected to dynamic load,and the dynamic stress distribution law and cracking process of the twin-tunnel may be produced using LS-DYNA software.The findings of the study may be used to give theoretical guidelines for assessing the stability of double horseshoe tunnels subjected to dynamic disturbances.
2.Experimental method
2.1.Specimen preparation
In this research,specimens were prepared using green sandstone from Deyang City,Sichuan Province,China.This sandstone has been used extensively for evaluating the dynamic fracture characteristics of rocks(Liu et al.,2020).The present study acquired the mechanical parameters of the green sandstone through standard tests that conform to the regulations set forth by the International Society for Rock Mechanics (ISRM).Table 1 lists its mechanical characteristics.Scanning electron microscopy (SEM)and polarization analysis were used to analyze the microscopic composition of green sandstone.The interior of the sandstone,as illustrated in Fig.2a,is composed of interstices and grains.The findings of a petrographic microscope examination of greensandstone under polarized light are shown in Fig.2b,and the mineral composition is specified in Table 1.

Table 1Mechanical parameters and compositional mineralogy of green sandstone.

Fig.2.Microscopic view of green sandstone: (a) Photomicrograph of green sandstone under SEM,and (b) Photomicrograph of green sandstone under cross-polarized light.
To explore the failure behavior of tunnels subjected to various dynamic load orientations,the length,width and height of the specimens were determined based on the diameter of the SHPB,and the dimensions of the tunnels were designed accordingly.The two tunnels were placed as far as was feasible in the center of the whole specimen to prevent the impact of too thin a rock layer surrounding the tunnels on the experimental results.The specimen’s dimensions are illustrated in Fig.3a.The specimen’s dimensions are 65 mm×65 mm×30 mm(length×width×thickness),and it has two inverted U-shaped tunnels with a radius of 6.5 mm,a height of 8.5 mm,and a width of 13 mm,with a 13 mm space between the twin-tunnels.As per the pertinent regulations of the International Tunneling Association (Luo et al.,2017;Li et al.,2020a,b),it is imperative that the minimum clear distance between two roadways should be equivalent to or greater than the diameter of the roadway.Consequently,the roadway spacing proposed in this study satisfies the minimum spacing requirements and is a realistic representation of the situation.The two tunnels are rotated around the specimen’s central point,and this rotation angle may be described as α illustrated in Fig.3b.To investigate the influence of dynamic loading orientation on the fracture behavior of the twin-tunnel,the experiments were carried out at angles of 0°,30°,45°,60°,75°,90°,120°,135°,150°and 180°,with three specimens per group and a total of 30 specimens created.Before the dynamic fracture experiment,white paint is sprayed on the surface of the specimen,and once the white paint has hardened,the dispersed field is manually generated in preparation for the DIC technique,as shown in Fig.3b.
2.2.Experimental protocol
The SHPB device was used to perform the dynamic fracture experiments,and the same air pressure(0.25 MPa)was delivered to each specimen.During the experimental process,the specimen’s fracture modes are recorded using a high-speed camera,and the specimen’s strain field may be analyzed using the DIC technique.Fig.4 depicts the SHPB apparatus and data collection system.
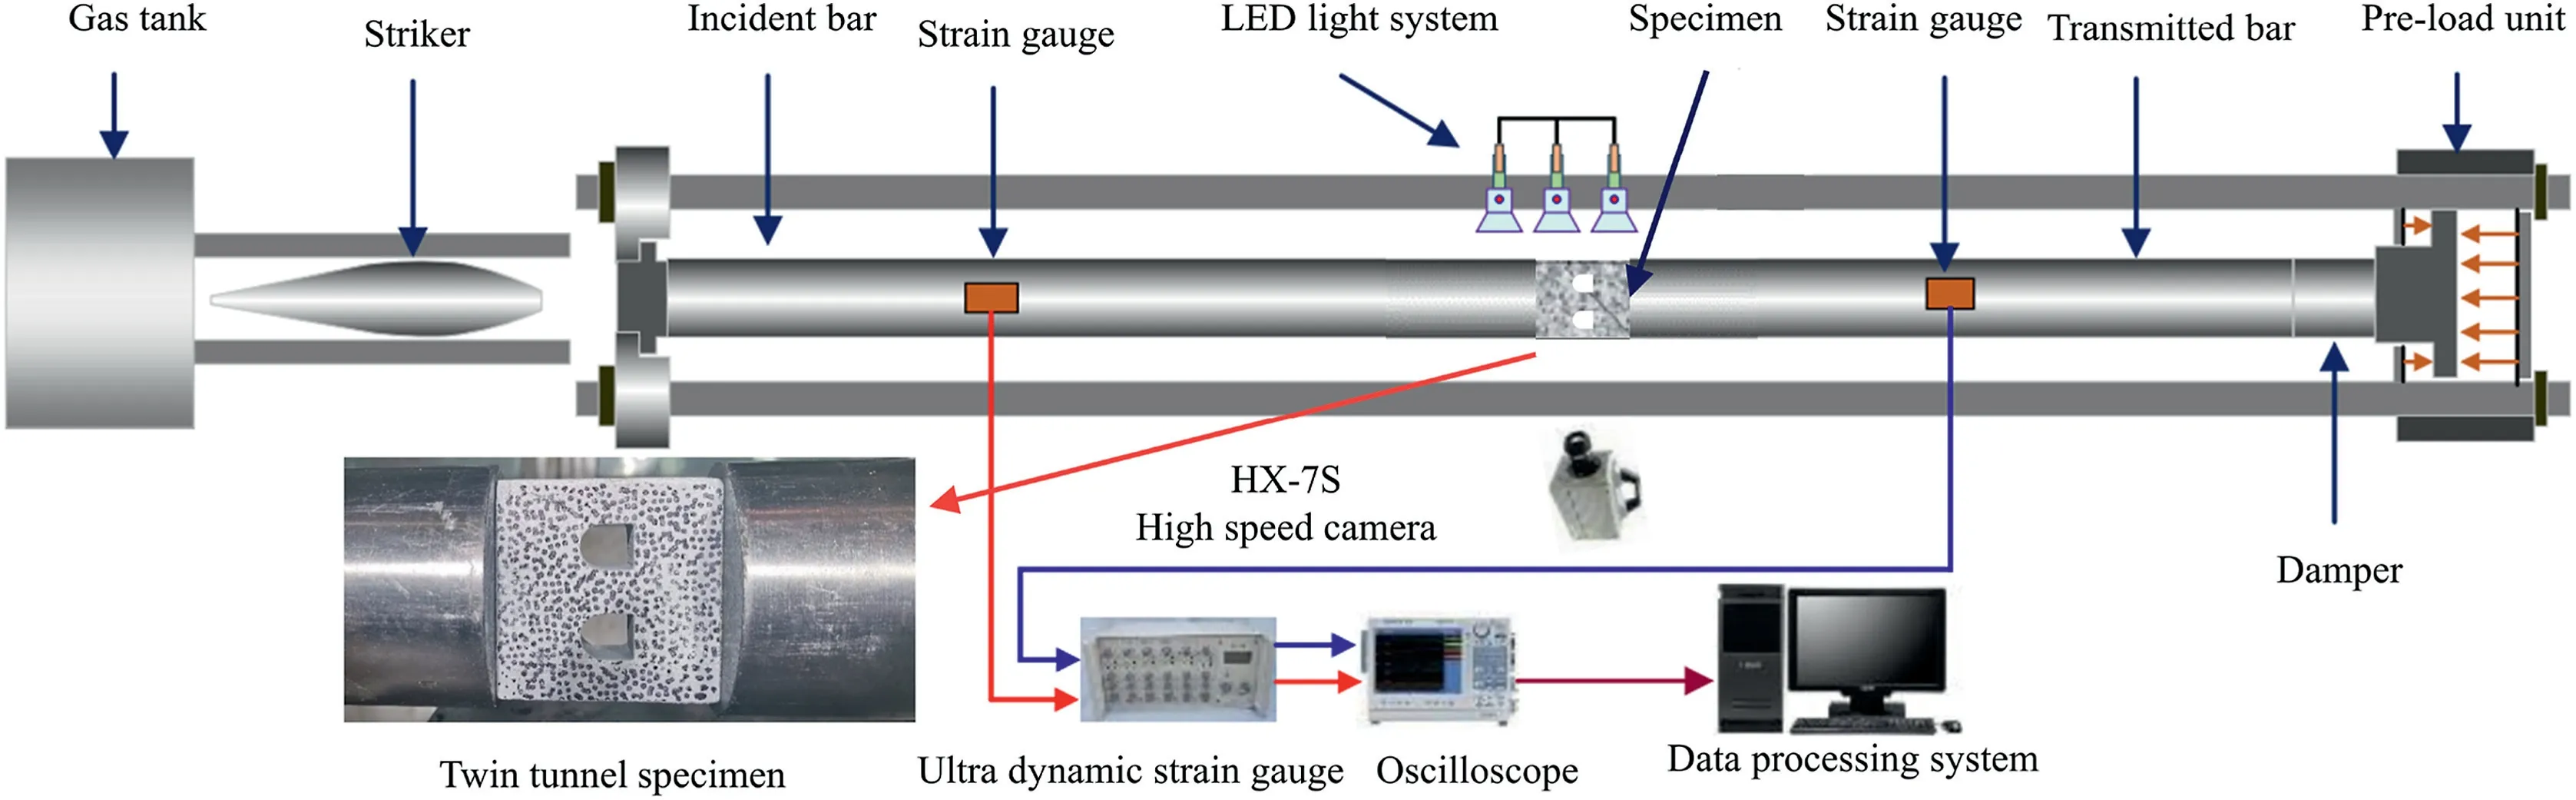
Fig.4.SHPB experimental setup.
With the SHPB device,the incident,transmitted and absorbing bars have 75 mm diameters,and their respective lengths are 3500 mm,2500 mm and 1000 mm.The density,P-wave velocity,and elastic modulus of the 3 bars are 7850 kg/m3,5255 m/s,and 217 GPa,respectively.Two strain gauges are mounted in the center of the incident and transmitted bars,and a small quantity of butter is applied to both ends of the specimen to eliminate the impact of friction.To prevent the impact of radial dispersion,a specifically constructed fusiform striker is used to generate a stress wave that is close to half-sine.As the wave shaper,copper might be chosen and installed at the end of the incident bar hit by the striker.As a result,the high-frequency oscillation is minimized,and a ramp wave is generated.
The DIC method is a non-contact test method in experimental mechanics,and its fundamental principle is to convert the obtained image information of the specimen surface before and after deformation into digital information and obtain the deformation field of the sample by the related function (Peters and Ranson,1982),as illustrated in Fig.5.The specific procedure involves selecting the region of interest(ROI)on the sample surface,forming the ROI into randomly distributed scattered regions by manual spraying,inputting the collected scattered images of the sample before and after deformation into the computer,digitizing them according to the pixels with different gray values,and calculating the displacement of the scattered points before and after deformation to obtain the deformation field of the sample.

Fig.5.The principle of DIC method.
3.Experimental results
3.1.Dynamic load calculation
The forces at the top and bottom sides of the specimen may be calculated using the following formulae based on the onedimensional stress wave theory:
whereAiandAtare the cross-sectional areas of the incident and transmitted bars,respectively;Eis the elastic modulus;εi(t),εr(t)and εt(t) are the strain signals of the incident,reflected and transmitted bars,respectively.
Fig.6 indicates the dynamic load time-history of the twintunnel specimen with α=45°,and the dynamic stress on the incident bar and the transmitted bar are basically equal during the loading process,indicating that the twin-tunnel can reach the stress equilibrium state.

Fig.6.Dynamic load time-history of the twin-tunnel specimen with α=45°: (a) Dynamic strain versus time,and (b) Dynamic loads versus time.

Fig.7.Damage and fracture evolution of twin-tunnel specimens subjected to different impact loading angles.

Fig.8.Failure processes of partially angled twin-tunnel.
3.2.Damage evolution and fracture analysis
This research examined the fracture behavior of the twin-tunnel under varied orientations of dynamic stress waves,including cracking site and propagation course.Meanwhile,a high-speed camera was used to capture the fracture process by capturing images at a rate of 48,000 frames per second with a resolution of 256×208 pixels.The collected images were then processed using the DIC technique to obtain the strain field and the cracking sequence of the twin-tunnel specimen,as shown in Figs.7 and 8.
When the dynamic stress wave originates from several sources,it is evident that the fracture mode is variable.When the impact force emanates from the arch of the twin-tunnel (α=0°),the fracture initiates at the tunnel’s corner and spandrel and propagates along the approximate dynamic load orientation.As the loading period increases,the fracture propagation path deflects and extends to both ends of the specimen.The experimental results are consistent with Zhou et al.(2017).When the impact loading angle α=30°,45°and 60°,the cracks form at the spandrel and corner of the twin-tunnel,a new crack forms at the line between the corner of the left tunnel and the spandrel of the right tunnel,and the cracks at the spandrel and corner of the tunnel extend to the two ends of the specimen.When α=75°,the cracks begin to develop at the corner and spandrel and spread in the loading direction.At this point,the cracks at the corner have just begun to pass straight through the two tunnels.When α=90°,the fractures are initially created on both sides and sidewalls of the tunnel.When the load rises,cracks emerge at the roof and floor of the tunnel to link with the cracks on both sides of the tunnel.When α changes from 120°to 180°,the fracture mode of the specimen is comparable to that from 60°to 90°;the cracking position and propagation course of the major fractures are the same;only a few secondary cracks alter significantly.
In summary,when the twin-tunnel is subjected to impact loads from different directions,the damage evolution process and fracture propagation paths vary substantially.Except for α=90°,the places where fractures initially appear are at the tunnel spandrel and corner,and the cracks appear on both sides of the tunnel when α=90°,indicating that stresses are most easily concentrated at the tunnel spandrel and corner.
4.Numerical simulation
In order to investigate the crack fracture characteristics of the twin-tunnel exposed to varied directional impact loads,LS-DYNA software was used to perform a numerical simulation.Many accomplishments have resulted from the extensive use of LS-DYNA to investigate the fracture characteristics of rock masses exposed to dynamic stresses.
4.1.Numerical model
The incident bar,rock specimen,and transmission bar were included in a numerical model.Fig.9 depicts the three-dimensional finite element model.Similar to the dynamic fracture test,α=15°,105°and 165°are added as supplements to the tunnel dimensions.The model was constructed using solid cells,and the Lagrangian approach was used for the numerical algorithm of the simulation.There are 642,310 elements and 782,590 nodes in the numerical model.

Fig.9.Numerical model.
The contact between the incidence bar,the specimen and the transmission bar is set using *CONTACT_AUTOMATIC_SURFACE_TO_SURFACE,the friction factor is set as zero,and the contact penalty factor is set to 2.The obtained dynamic stress wave from the test is loaded onto the side of the incident bar.The incident and transmitted bars were modeled using the elastic material*MAT_ELASTIC,and the parameters were consistent with the experiment,i.e.the density is 7.85 g/cm3,the elastic modulus is 217 GPa,and the Poisson’s ratio is 0.3.
4.2.Material model
Material model selection is critical for the success of numerical simulation in this study,and it is challenging to define the mechanical response of rock materials exposed to dynamic loads owing to their heterogeneity and other properties.Scholarly study has substantially enhanced the intrinsic structure relationships of rocks under large deformation conditions.Several material models are available in LS-DYNA software to explain the fracture behavior of rock masses,with the most often used ones being the Cowper-Symonds model (PK) (Zhao et al.,2017),the Johnson-Holmquist model (HJC) (Ma and An,2007),the continuous surface cap model (CSCM) (Tao et al.,2012),and the RHT model (Leppanen.2006).The PK model has too few parameters to explain the complex kinetic response of rock materials,the HJC model does not sufficiently depict tensile damage to rock materials(Liu et al.,2018),the CSCM model’s parameters are too intricate,and the crack modeling is inadequate.The RHT model incorporates the strain rate effects,surrounding pressure effect,strain hardening and damage softening effect,and so on.It contains more parameters than the PK model and can accurately capture the complicated mechanical reaction of rocks under dynamic loads.Unlike the HJC model,it takes both compression and tensile damages into consideration.In summary,the RHT model can accurately characterize the mechanical behavior of rock materials subjected to dynamic loads.
Several researchers have used the RHT model to describe the mechanical behavior of rocks under dynamic loads(Xie et al.,2017).The RHT material model contains three different strength surfaces:the elastic limit surface,the failure surface,and the residual strength surface,which are used to characterize the evolution of the initial yield strength,the failure strength,and the residual strength of the material,respectively,and to describe the stressstrain relationships between the elastic,linearly strengthened,and damage softened segments of the material,as shown in Fig.10,σ is the equivalent stress andε is the equivalent strain.
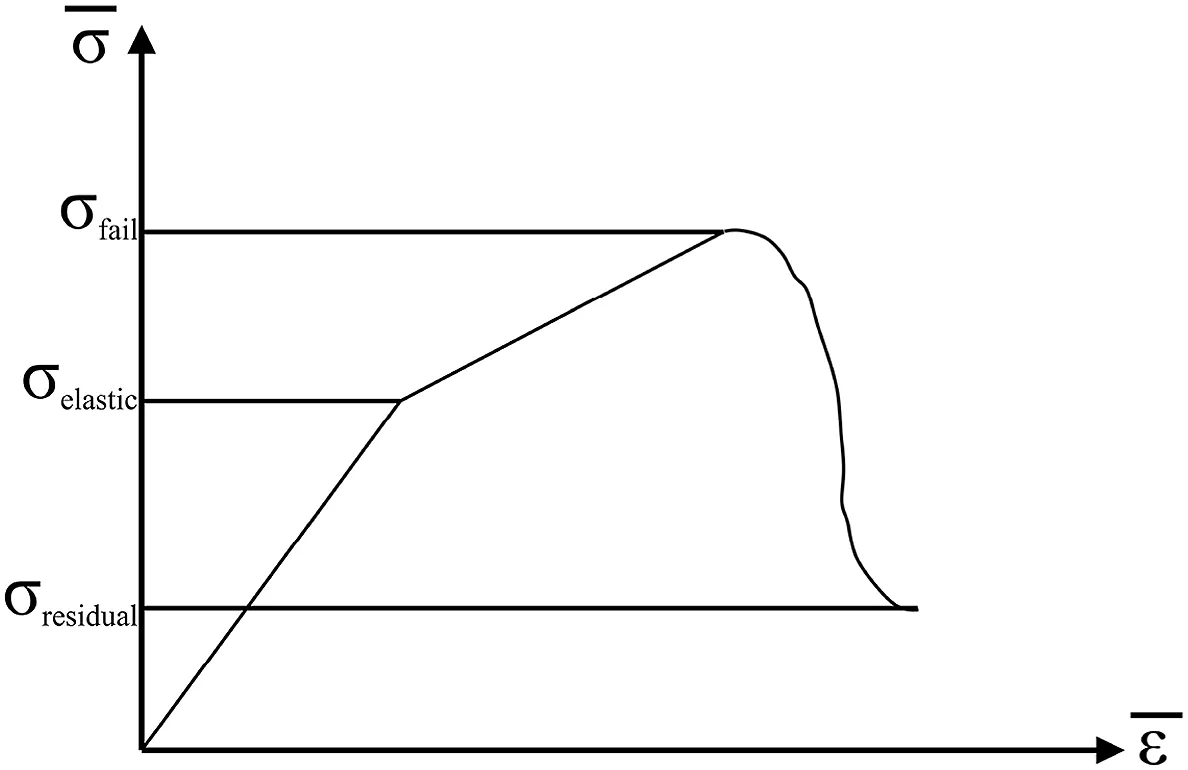
Fig.10.The “three phases” sketch of RHT constitutive model.
The RHT model has many parameters to be examined,which can be broadly classified into seven categories:physical and mechanical parameters in theP-α equation of state,strength parameters of the material,failure surface parameters,elastic limit surface parameters,linear strengthening parameters,residual stress surface parameters,and damage evolution parameters (Yang et al.,2019a,b;Grunwald et al.,2017).
The following equation can be used to describe theP-α equation of state:
whereP(ρ,e) is the EOS pressure;B0andB1are the material constants;εvis the volumetric strain;α0is the initial porosity of the material;ρ0is the initial density of the material;eis the internal energy per unit mass;andA1,A2andA3are the polynomial coefficients.
The failure surface parameters are given by the following equation:
These parameters can be partially derived experimentally and theoretically,but some of them are more complicated to obtain and can only be obtained from the literature.By the study of Li et al.(2022),the RHT model for the green sandstone was identified as well as used in this paper,and the RHT parameters for the green sandstone are listed in Table 2.

Table 2RHT model parameters for green sandstone.
4.3.Numerical results
4.3.1.Damage evolution
Owing to the RHT model employed in this simulation,the rock damage can be examined immediately in the post-processing,and when the damage surpasses a particular threshold,the rock is judged to have sustained severe damage and formed fractures.The threshold for rock damage is 0.4,and the final findings are shown in Fig.11.Due to the substantial amount of cracks formed,it is not feasible to match every fracture with the experiment,but the cracking site,crack propagation route,and kind of examined cracks are the same.

Fig.11.Numerical simulation results of damage evolution of twin-tunnel specimens.
The fracture propagation path vs.time is depicted in Fig.11.When the impact loading angle α is 0°and 180°,the fractures first appear in the tunnel’s floor and roof;after a certain degree of expansion,the cracks begin to form at the corner and continue to the end of the specimen.At α=15°and 165°,the fractures at the tunnel corner propagate in the direction of the sidewall before propagating along the loading orientation and extending to the end of the specimen as the load increases.When α=90°,the initial area where the fracture develops is the sidewall of the tunnel,and then new cracks form on both sides to connect with the tunnel roof and tunnel floor,extending toward the load orientation.When the impact direction is deflected by a certain angle(30°,45°,60°,120°,135°and 150°),the first cracking locations are mostly at the corner and the spandrel of the tunnel.The cracks produced at the corner(except 45°and 135°)extend first in the direction of the sidewall or floor,the cracks produced at the spandrel extend along with the direction of the load,then producing some cracks connecting the two tunnels,which is very similar to the experimental results.From the simulation,it is clear that the crack initiation position connecting the two tunnels is at the midpoint of the line connecting the corner and the spandrel of the two tunnels,and the previously expanded crack at the tunnel corner becomes expanded in the direction of the load.Finally,cracks form at the opposite corner and spandrel of the tunnel,as well as at both ends of the specimen,causing extensive damage to the twin-tunnel specimen.
Fig.12 depicts the findings of laboratory experiment and numerical simulation that are in good accordance.Yet,there are variances between them.When α is 0°,the position where the crack initially appears is different.The numerical simulation is in the tunnel’s roof and floor.However,the experimental data indicate that the crack occurs in the tunnel’s corner and spandrel,with the exception of certain angles where the fracture forms in the spandrel instead of the corner.The size of the specimen model is too small,and the geometry of the two tunnels is not perfect when waterjet cutting is used,particularly at the tunnel spandrel and corner,where the geometry changes abruptly,exacerbating the stress concentration phenomenon,whereas the geometric model constructed in the simulation is perfect,which is the primary reason for the different crack emergence locations.The non-uniformity of the rock,with its original internal flaws,is also a significant factor in these variances.

Fig.12.Comparison of experimental and numerical results.
When the risk of a dynamic disturbance originating from the inclined twin-tunnel’s direction is high in the actual project,the connecting channel between the two tunnels can be inspected.In order to protect the safety of life and property,the stability of the tunnel can be examined to determine whether there are fractures in the center of the connection between the tunnel corner and tunnel spandrel of the connecting channel.
4.3.2.Failure modes
When a tunnel is put under a dynamic load,the energy within it builds up,and when it reaches a critical value,the energy is released as fractures.Thus,the tunnel’s fracture mode frequently relies on the cracking mode of the break in the surrounding rock mass.It is possible for the fracture mode of the same rock to change depending on the loading circumstances.For instance,Zhu et al.(2019) performed compression tests on granite samples with two rectangular holes using static and dynamic loads,and they noted that the granite samples were destroyed in shear under static load and in tension under dynamic load,though it was more difficult to identify the cracking mode of the cracks produced in the rock mass when subjected to dynamic load.
According to the displacement trend line method presented by Zhang and Wong (2014),cracking modes may be categorized into three types: tensile damage (T),combined tensile-shear (TS),and shear (S),as illustrated in Fig.13.Displacement trend lines that diverge and display mutual tensile displacement indicate tensile damage (Fig.13a).Shear failure occurs when two parallel displacement trends cross to provide a strong shear effect(Fig.13c).Mixed tensile-shear failure occurs when displacement trend lines exhibit both tensile and shear characteristics (Fig.13b).

Fig.13.Three failure modes in the displacement trend line method (Zhang and Wong,2014): (a) Tensile failure,(b) Mixed tensile-shear failure,and (c) Shear failure.
When α=0°and 180°,the cracks created at the roof and floor of the tunnel are tensile,whereas the fractures produced at the tunnel corner are mixed cracks,as shown in Fig.14.The tensile fractures form on the tunnel roof at α=15°and 165°,whereas mixed cracks form on the corner at these angles.The tensile fractures form at the tunnel spandrel when α=30°,60°,120°and 150°,whereas the corner cracks and cracks joining the two tunnels are mixed cracks.For α=45°and 135°,the tensile fractures are created at the corner and spandrel of the tunnel,and the cracks joining the two tunnels are mixed cracks.At α=75°and 105°,the fractures formed at the spandrel are tensile cracks,and the cracks connecting the two tunnels are mixed cracks;the mixed cracks are produced at the upper tunnel’s corner,while the tensile cracks are produced at the lower tunnel’s corner.At α=90°,the fissures on both sides and sidewalls are tensile.
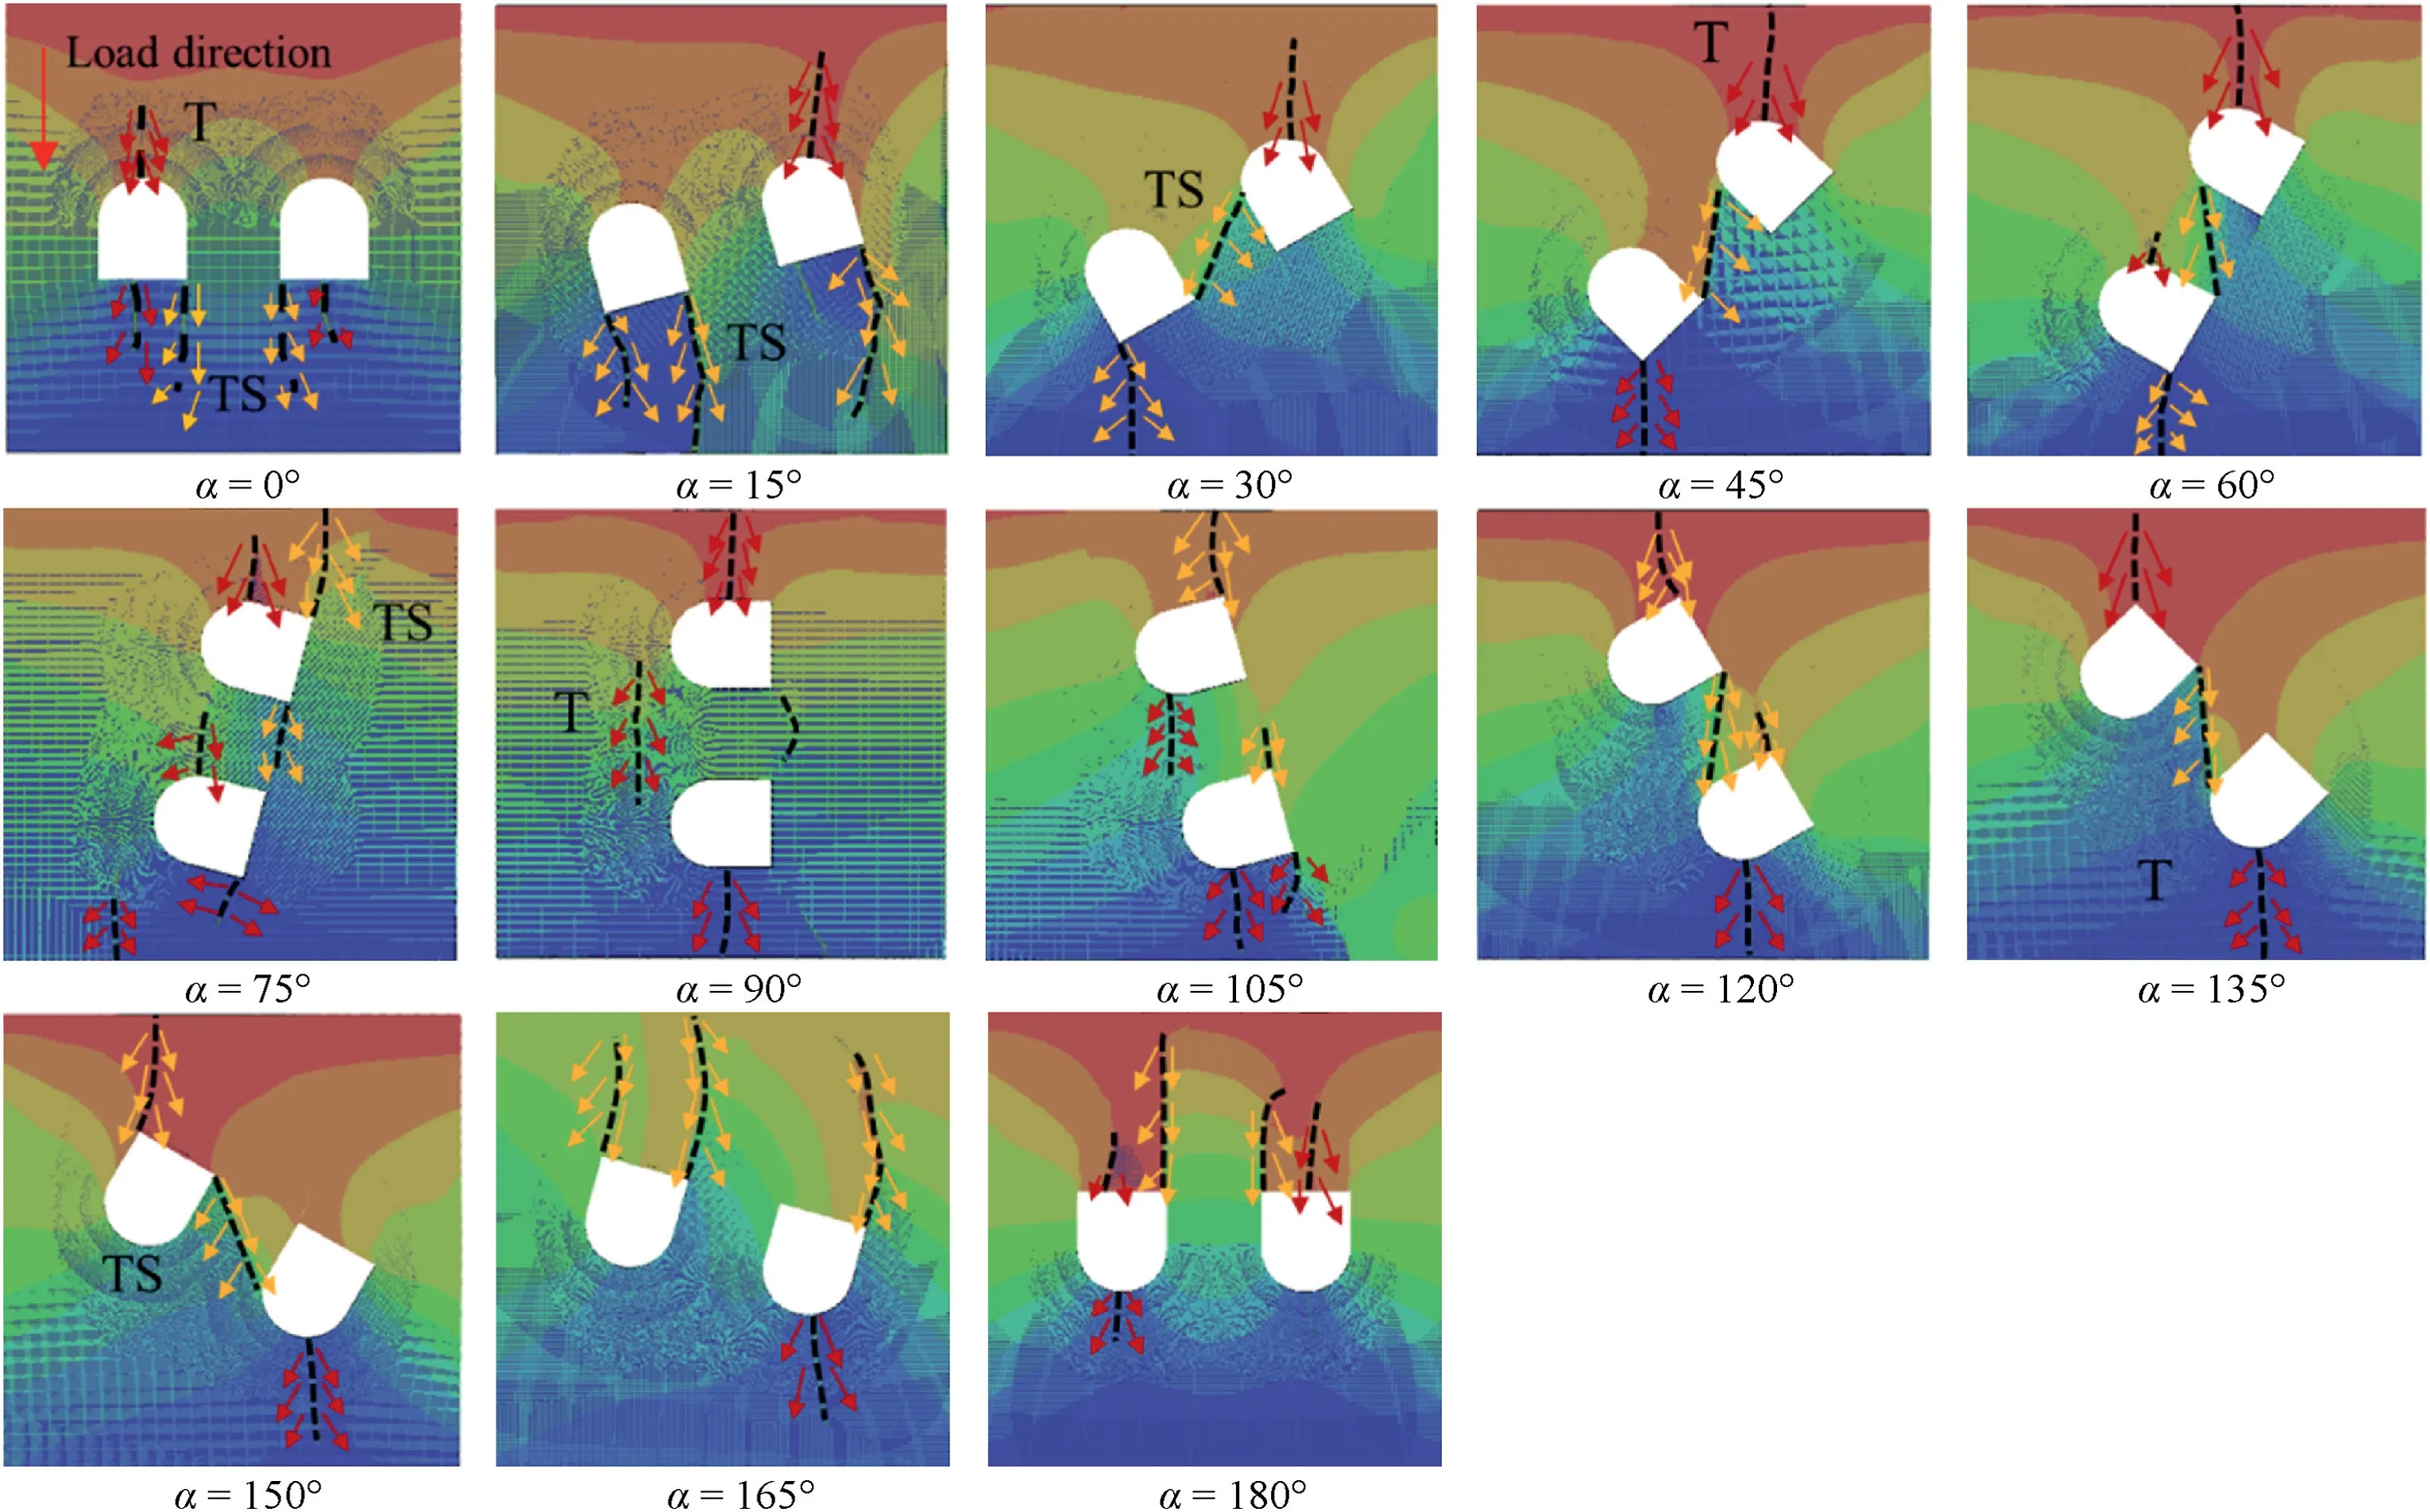
Fig.14.Displacement trend line graphs (black dashed line is crack propagation path,T and red arrows represent tensile cracks,TS and yellow arrows represent mixed cracks).
In this simulation,there is a kind of common fracture,i.e.the crack generated at the tunnel corner that propagates first along the sidewall or floor,and its displacement trend line expansion is shown in Fig.15(α=150°).When expanding along the direction of the sidewall and floor,the displacement trend line of this crack exhibits both relative tensile and shear damage,indicating mixed damage.However,when expanding along the loading orientation,the displacement trend line demonstrates tensile damage,and this paper classifies this crack as a mixed crack.

Fig.15.Enlarged view of the displacement trend line of cracks connecting the two tunnels and corner cracks.
The direction of impact loading influences the sorts of fractures created in the twin-tunnel,according to the overall findings of this study.When the impact loading angle α is 90°,only the tensile cracks form in the twin-tunnel,but both tensile and mixed fractures form at other impact loading angles.The roof and spandrel of the tunnel create the majority of tensile fractures,whereas the corner and cracks linking the two tunnels generate the majority of mixed cracks.
4.3.3.Stress distribution
During dynamic loading,the location and sequence of fracture formation depend on the tensile stresses around the tunnel.To determine the process of fracture formation,the stress distribution around the tunnel must be analyzed.Fig.16 depicts the distribution of the maximum principal (tensile) stress in the twin-tunnel exposed to various directional dynamic loads at the onset of the fracture.In this simulation,the time until the stress wave reaches the top boundary is about 680 μs.
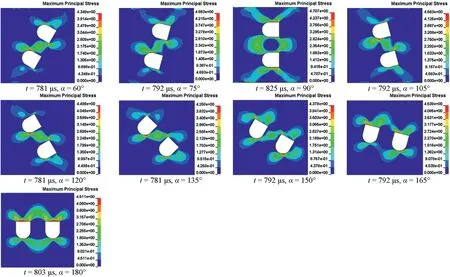
Fig.16.Distributions of maximum principal tensile stress from 0° to 180° (unit: MPa).
When α=0°,as shown in Fig.16,the tunnel’s roof and floor experience the highest tensile stresses,followed by the tunnel’s corner.Because of this,initially,the cracks will appear on the roof and the floor,and when the tensile stress spreads to the corner,wider cracks will appear there as well.The tensile stress at the tunnel’s roof moves from the roof to the spandrel and then to the sidewall when the angle changes from 0°to 90°,while the tensile tension at the tunnel’s floor moves from the floor to the corner and then to the sidewall.At α=30°,45°and 60°,there is an apparent concentration of tensile stress along the line connecting the tunnel corner and spandrel,resulting in the emergence of fractures connecting the two tunnels.When the impact force is turned from 90°to 180°,the distribution of tensile stress resembles the process of rotation in reverse,from 0°to 90°.
Fig.17 illustrates the tensile stress evolution when α=0°,45°and 90°.The location of the tensile stress concentration is mostly the crack initiation location.When the tensile stress at a certain place reaches the maximum tensile strength of the rock,the cracks start to initiate.Then the tensile stress concentrated here is dissipated,and with the further increase of the load,the tensile stress will be concentrated at some other place,thus producing new cracks.When α=45°,the location where the tensile stress is first concentrated is the two spandrels and two corners of the tunnel,which are parallel to the loading orientation,followed by the connecting line.When the cracks emerge at the spandrels and corners in the concentrated area,the concentrated tensile stress starts to dissipate here,and the dissipated tensile stress makes the tensile stress at the connecting line further concentrated,which leads to the appearance of cracks connecting the two tunnels at the connecting line.After the cracks appear,the energy in the rock is not completely dissipated.Finally,new cracks are produced at the other spandrels and corners on the outside of the twin-tunnel.

Fig.17.Evolution of tensile stress for α=0°,45° and 90° (unit: MPa).
4.3.4.Displacement distribution
In real tunneling engineering,the displacement field around the surrounding rock mass is one of the monitoring data used for evaluating tunnel stability.The displacement field of the twintunnel subjected to varied directional impact loads also exhibits distinct characteristics.The displacement field of the twin-tunnel in thex-andy-directions may be determined using the LS-DYNA software,as seen in Figs.18 and 19.Both Figs.18 and 19 have times of 803 μs (shortly after the incident wave reaches the specimen).
The displacement field in thex-direction of the twin-tunnel specimen under impact load angle increasing from 0°to 180°is depicted in Fig.18.Twin-tunnels exhibit a tensile(open)state in thex-direction,with approximately symmetric positive and negative displacements,with positive displacements placed on the left and negative displacements on the right.When α=0°and 180°,the maximum positive displacement is found on the right sidewall of the right tunnel,and the maximum negative displacement is discovered on the left sidewall of the left tunnel.This suggests that the location of the tunnel rock crush under dynamic load is likely to be the outer sidewall area of the twin-tunnel.When α=90°,the highest positive and negative displacements are relatively far from the tunnel,indicating that the dynamic stress wave from the sidewalls has little influence on the tunnel’s stability.When the dynamic load is tilted to act on the twin-tunnel,the maximum positive displacement at other angles is located roughly to the right corner of the right tunnel,and the maximum negative displacement is located to the left spandrel of the left tunnel,indicating that the location of the rock crush is likely to be the spandrel and corner of the tunnel.When the impact direction rises from 0°to 180°,the maximum value of displacement first grows,then reduces,increases and finally decreases.At α=30°and 150°,the maximum displacement value is 0.0134 mm and 0.013 mm,respectively.When α=90°,the maximum displacement value is 0.007 mm,indicating that the impact loading orientation has a significant effect on the maximum displacement value in thex-direction.

Fig.18.Displacement fields in x-direction with α increasing from 0° to 180° (t=803 μs,unit: mm).
Fig.19 depicts the displacement field in they-direction of the twin-tunnel under the impact load angle ranging from 0°to 180°.The twin-tunnel exhibits an overall compression (collapse) tendency in they-direction,with diminishing negative displacements from top to bottom.For the impact load in various orientations,the maximum angle of displacement is 150°with a maximum value of -0.0507 mm,while the minimum angle of displacement is 15°with a maximum value of -0.0502 mm,indicating that the maximum value of displacement in they-direction does not vary significantly.

Fig.19.Displacement fields in y-direction with α increasing from 0° to 180° (t=803 μs,unit: mm).
The displacement fields in thex-andy-directions reveal that the impact loading orientation has minimal effect on the displacement values in the dynamic loading direction of the twin-tunnel.However,the effect is stronger in the vertical dynamic loading direction.
4.3.5.Tunnel spacing
The significance of tunnel spacing in relation to the stability of tunnels cannot be overlooked in real-world engineering applications.By setting the angle of inclination α=90°and varying the tunnel spacing (S) to 13 mm,15 mm and 17 mm,respectively,an investigation can be conducted to analyze the impact of tunnel spacing on the dynamic failure characteristics of twin-tunnels.Fig.20 illustrates the process of damage progression in twintunnels that have variable spacing.The location where the crack originates on the sidewall of the tunnel undergoes a displacement towards the spandrel as the tunnel separation increases.Additionally,the cracks present on the inner spandrel of both tunnels gradually interconnect.At a value ofSequal to 17 mm,the fractures are no longer present on either side of the tunnel due to the weakened impact of tensile stress concentration resulting from increased tunnel spacing.The simulation results indicate that the initiation of cracks in twin tunnels is significantly influenced by the spacing between them.

Fig.20.Damage evolution results with different tunnel spacings.
5.Discussion
From the experiment and simulation results,it indicates that when the twin-tunnel is subjected to impact loads from different orientations,the areas where cracks first initiated and stresses first concentrated are also different.Using the results of this research,we can summarize,as shown in Fig.21,the weak points of the twintunnel under various dynamic loading orientations.When the dynamic disturbance comes from the arch and bottom sides,the vulnerable areas of the twin-tunnel are the four corners and the two outer spandrels.The twin-tunnel’s sidewall and roof at the loading end are susceptible to damage when the dynamic disturbance occurs from the left or right side.The stress concentration at the tunnel corner and spandrel is most pronounced when the twintunnel is subjected to a dynamic load in a diagonal orientation,and the two spandrels and two corners are the most vulnerable areas because they run parallel to the dynamic load orientation.Thus,in tunnel engineering,the direction of the dynamic disturbance load is a crucial consideration for the twin-tunnel support design.

Fig.21.The vulnerable areas of the twin-tunnel subjected to various dynamic disturbances: (a) Horizontal and vertical,and (b) Diagonal.
6.Conclusions
Vehicular tunnels are frequently vulnerable to dynamic disturbances coming from diverse angles,which might impair the stability of the tunnel on numerous levels.It is possible to draw the following inferences from a thorough investigation of the effect of dynamic loading orientation on twin-tunnel stability,allowing for a specifically suited design to take into account the unique conditions in which the tunnels would operate:
(1) The fracture behavior may be used as one of the essential indices for tunnel support design,with certain fractures appearing first at the corner,spandrel and floor of the tunnel.For impact loading angles α of 30°,45°,60°,120°,135°and 150°,the cracks form first at the corner and spandrel of the tunnel,and then propagate to a certain degree.The cracks are also produced at the line connecting the corner of the left tunnel and the spandrel of the right tunnel,with the crack location being the midpoint of the line.
(2) When the impact loading angle α is 90°,only a few tensile cracks (T cracks) are created in the surrounding rocks,and the failure degree is at its minimum.In contrast,the mixed fractures (TS cracks) are created at other groups.The tunnel spandrel is a prime location for T cracks to form,whereas tunnel corners and passageways between tunnels are more likely to exhibit TS cracks.
(3) The stress concentration in the tunnel is most pronounced and the failure degree is highest when the dynamic disturbance originates from the diagonal direction of the twintunnel (α=45°and 135°).In this situation,the vulnerabilities in the tunnel support should be fortified during the design phase.The combination of tensile stresses along the line linking the corner and spandrel of the tunnel and the tensile stresses released during the first crack initiation leads to the development of cracks connecting the two tunnels.
(4) The orientation of the impact load has little effect on the displacement field of the twin-tunnel in the dynamic loading direction but has a significant effect on the displacement values in the loading vertical direction.In the vertical loading direction,the maximum amount of displacement from 0°to 180°grows,then lowers,increases,and finally decreases once again.When the first fracture is generated in the tunnel at angles α=30°and 150°,their highest values are 0.0134 mm and 0.013 mm,respectively,whereas the impact loading angle (α=90°) has a maximum value of 0.007 mm.
Declaration of competing interest
The authors declare that they have no known competing financial interests or personal relationships that could have appeared to influence the work reported in this paper
Acknowledgments
This research was supported by the National Natural Science Foundation of China (Grant Nos.52204104 and U19A2098),the Science and Technology Department of Sichuan Province,China(Grant No.2023YFH0022).
杂志排行

Journal of Rock Mechanics and Geotechnical Engineering的其它文章
- Determination of uncertainties of geomechanical parameters of metamorphic rocks using petrographic analyses
- Evaluation of excavation damaged zones (EDZs) in Horonobe Underground Research Laboratory (URL)
- On the calibration of a shear stress criterion for rock joints to represent the full stress-strain profile
- Experimental study on the influences of cutter geometry and material on scraper wear during shield TBM tunnelling in abrasive sandy ground
- Effect of fracture fluid flowback on shale microfractures using CT scanning
- Mechanical behaviour of fiber-reinforced grout in rock bolt reinforcement