Shear band evolution and acoustic emission characteristics of sandstone containing non-persistent flaws
2024-02-29ShutingMiaoPengZhiPanChuanqingZhangLeiHuo
Shuting Miao ,Peng-Zhi Pan,* ,Chuanqing Zhang ,Lei Huo
a State Key Laboratory of Geomechanics and Geotechnical Engineering,Institute of Rock and Soil Mechanics,Chinese Academy of Sciences,Wuhan,430071,China
b University of Chinese Academy of Sciences,Beijing,100049,China
c CASIC Research Institute of Intelligent Decision Engineering,Wuhan,430040,China
Keywords:Shear band evolution Acoustic emission (AE)Crack coalescence Normal stress Shear sliding
ABSTRACT Direct shear tests were conducted on sandstone specimens under different constant normal stresses to study the coalescence of cracks between non-persistent flaws and the shear sliding characteristics of the shear-formed fault.Digital image correlation and acoustic emission (AE) techniques were used to monitor the evolution of shear bands at the rock bridge area and microcracking behaviors.The experimental results revealed that the shear stresses corresponding to the peak and sub-peak in the stressdisplacement curve are significantly affected by the normal stress.Strain localization bands emerged at both the tip of joints and the rock bridge,and their extension and interaction near the peak stress caused a surge in the AE hit rate and a significant decrease in the AE b value.Short and curvilinear strain bands were detected at low normal stress,while high normal stress generally led to more microcracking events and longer coplanar cracks at the rock bridge area.Furthermore,an increase in normal stress resulted in a higher AE count rate and more energetic AE events during friction sliding along the shearformed fault.It was observed that the elastic energy released during the crack coalescence at the prepeak stage was much greater than that released during friction sliding at the post-peak stage.More than 75% of AE events were located in the low-frequency band (0-100 kHz),and this proportion continued to rise with increasing normal stress.Moreover,more AE events of low AF value and high RA value were observed in specimens subjected to high normal stress,indicating that greater normal stress led to more microcracks of shear nature.
1.Introduction
Non-persistent fractures are a prevalent geological structure in rock engineering practices and play a critical role in stabilizing rock masses.When subjected to external loads,a series of limited-sized discontinuities interacts to form a separated shear plane at the regions between the discontinuities,i.e.rock bridge.While these discontinuities pose a threat to the stability of rock masses in engineering structures,such as tunnels,mines,and slopes,rock bridges are considered a strength reserve as they have to be broken before shear sliding along the newly separated plane (Stimpson,1978;Zhang et al.,2021).It has been established that the shearing process in rocks containing non-persistent fractures is a combination of shear rupture of intact rock and frictional slip failure,which occurs in both engineering rock masses and seismic faults (Ohnaka,2003).A comprehensive understanding of this shearing process can provide valuable insights into the mechanisms of geo-hazard and aid in the development of effective mitigation strategies in engineering safety design.
Several pioneering studies have been conducted to investigate the typical characteristics and impacting factors of the shear behaviors of rock or rock-like specimens that contain non-persistent joints or fractures.Laboratory tests have revealed that the shear behavior of these specimens typically encompasses two or more stages.For instance,Gehle and Kutter (2003) reported that the shear behaviors of discontinuous joints involved three stages,including tensile rupturing,rolling and sliding of dilation zones,and sliding within the joint infillings.Additionally,the results of direct shear tests performed by Zhang et al.(2021)suggest that the shear response of en-echelon fractures involves two stages,i.e.cracking and shear-slipping.
The crack coalescence between non-persistent joints under shear stress concerns the fundamental crack types (Bobet and Einstein,1998;Sarfarazi et al.,2013;Asadizadeh et al.,2017).In addition,joint configuration,such as persistency(Yang et al.,2020;Zhang et al.,2021),orientation (Gehle and Kutter,2003;Gerolymatou and Triantafyllidis,2016;Yin et al.,2020),overlapping(Sarfarazi et al.,2013),and spacing (Zhang et al.,2020),has also been acknowledged as important impacting factors that play a significant role in crack coalescence and subsequent friction sliding.Furthermore,the shear strength and cracking process of nonpersistent joints are influenced by the joint roughness coefficient(JRC).For example,Asadizadeh et al.(2017)classified the nature of coalescence cracks between two non-persistent joints into three categories: tensile cracking,shear cracking,and mixed tensileshear cracking.Their studies also indicated that the joints with high JRC result in severe asperity interlocking,thus promoting the initiation of tensile cracks.Fereshtenejad et al.(2021)proposed an empirical equation to evaluate the shear strength of rock mass with non-persistent joints and also considered the effect of the joint roughness.
The above-mentioned studies have provided valuable insights into the shear behavior of non-persistent joints.However,it is important to note that most studies have utilized rock-like materials with low compression-tension ratios,such as gypsum and concrete,to replicate the shear behaviors of natural rocks that have high compression-tension ratios and complex microstructure.As a result,natural rock specimens have not been widely tested.In nature,shearing typically produces more complex fractures and shear zones between non-persistent joints (Kim et al.,2003;Myers and Aydin,2004).Luo et al.(2022) quantified rate-dependent properties of the shear strength and morphological characteristics of granite rock bridges at low to sub-seismic shear rates.Yang et al.(2020) classified the cracks at the rock bridge of sandstone specimens into tensile failure mode,mixed failure mode,and shear failure mode.However,these studies have mainly focused on the shear mechanical properties and failure modes,while the damage evolution,energy release characteristics,and microscopic fracture mechanism during the crack coalescence and subsequent shear sliding process have not been fully studied.Additionally,normal stress plays a dominant role in the strength and deformation characteristics,fracture morphology,and asperity damage behaviors(Asadizadeh et al.,2017;Jiang et al.,2020b;Zhang et al.,2021).Therefore,it is necessary to clarify the difference in the damage behaviors and fracture mechanism of natural rocks containing nonpersistent joints under different normal stresses.
Effective monitoring techniques can help trace the microcracking process of rocks,reveal the fracture mechanism,and predict upcoming instability and disasters.The acoustic emission(AE) technique is a common nondestructive method for real-time damage and failure monitoring at both the laboratory and in situ scales.It records the elastic waves released during crack propagation incidences by transducers placed on the surface of the material(Aggelis et al.,2011;Ishida et al.,2017).Appropriate AE descriptors can accurately quantify the level of damage and energy released from materials.Further analysis of transient AE waveforms can provide deeper insights into the focal mechanism.In a study by Meng et al.(2016),granite joints showed a significantly higher number of AE hits and AE energy release rate than cement mortar joints.Similarly,Jiang et al.(2020b) observed a surge in AE rate during repeated shear oscillation at the post-peak stage.Another non-contact technique for full-field deformation measurement is the digital image correlation (DIC) technique,which has gained a widespread application.Using the DIC technique,Li et al.(2022)observed the strain localization at the rock bridge under shear loading.Previous research has shown that both AE and DIC techniques can monitor damage and cracking from different aspects and scales,and their combined use can undoubtedly reveal more information and complement each other (Pan et al.,2019;Miao et al.,2021).
Despite some research on the shear behavior of non-persistent joints,our understanding of related damage evolution,cracking behavior,and microscopic fracture mechanisms remain incomplete,especially in natural rocks.This study aims to investigate the shear behavior of non-persistent flaws under various normal stresses,focusing on the effects of shear band evolution,cracking behavior,and microscopic fracture mechanisms.To achieve this,we conducted a series of direct shear tests on sandstone specimens with non-persistent flaws under different constant normal stresses.The DIC and AE techniques are jointly used to monitor the shear band evolution at the rock bridge and AE characteristics during the shear loading process.This research can offer valuable insights for the stability analysis and interpretation of monitored micro-seismic signals in rock slopes,tunnels,and dams with embedded nonpersistent joints or cracks.
2.Experiment methodology
2.1.Specimen preparation
The specimens used in this study were prepared from red sandstone,which possesses excellent integrity and homogeneity.It comprises 60%quartz,30%filler,5%detritus,4%K-feldspar,and 1%other minerals,with mineral particle sizes ranging from 0.06 mm to 0.25 mm.Uniaxial compression tests on cylindrical specimens with a diameter of 50 mm and height of 100 mm give a uniaxial compressive strength of 58 MPa and Young’s modulus of 9.87 GPa for the red sandstone.To eliminate the effect of anisotropy,rectangular prism specimens with dimensions of 150 mm(width)×150 mm(height)×120 mm(thickness)were cut from a large block in the same orientation (Fig.1a).Non-persistent joints with a length of 37.5 mm and aperture of 1.5 mm were cut on the left and right sides of rock specimens,leading to a joint persistence of 50% (Fig.1a).Three specimens were prepared for each normal stress.For better DIC analysis,a random speckle pattern was created on the target surface by applying black and white spray paints (Fig.1a).
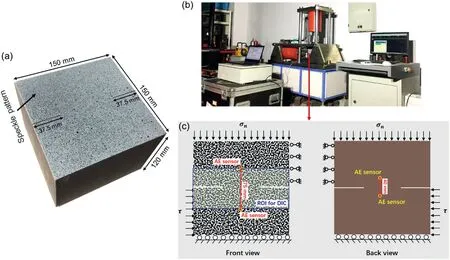
Fig.1.(a) Dimensions of sandstone specimen containing pre-existing flaws,(b) Multifunctional shear test apparatus for jointed rocks,and (c) ROI and location of AE sensors.
2.2.Test procedure
The direct shear tests were conducted at the Institute of Rock and Soil Mechanics,Chinese Academy of Sciences using servocontrolled multifunctional shear test equipment (Fig.1b).This apparatus is equipped with both horizontal and vertical hydraulic rams with a maximum load capacity of 200 kN and 300 kN,respectively,and can perform shear loading tests on rock joints under both constant normal load and constant normal stiffness conditions.Load cells connected to loading jacks with a resolution of 1 N were used to measure the load,while linear variable differential transformers mounted on the shear box,with an accuracy of 0.001 mm,were used to monitor the displacements.Additionally,the multifunctional shear test equipment is equipped with open loading boxes that provide detection space and observation windows for damage and cracking monitoring during tests.Further details on the design,construction,and operation of this device can be found in Zhang et al.(2019).
Once the specimen was placed into the shear apparatus,the normal load was initially applied to the upper shear box at a rate of 0.3 kN/s until it reached the desired target value.It is known that the discontinuities and rock bridges in rock slope are generally subjected to low normal stress,while the jointed rocks in deep underground engineering are subjected to high normal stress.To investigate the normal stress dependence of shear behavior,different normal stresses were set,ranging from 0.5 MPa to 10 MPa.The lower limit of 0.5 MPa was selected to study crack coalescence at the rock bridge under extremely low normal stress,while the larger values of 8 MPa and 10 MPa,corresponding to the maximum burial depth of 400 m,were considered to investigate the cracking behavior at the rock bridge under high normal restriction.Two medium normal stresses,i.e.3 MPa and 5 MPa,were also included in the study.The shear load was applied by moving the horizontal piston at a displacement rate of 0.5 mm/min.The tests were terminated after the specimen reached a steady residual state at the post-peak stage.During the test,the loads and displacements in both the normal and horizontal directions were recorded by the data acquisition system of the shear test equipment at an interval of 0.2 s.
The dynamic monitoring of deformation and fracturing at the rock bridge and asperity damage along the shear-formed throughgoing fault was achieved through the joint use of DIC and AE techniques (Fig.1b).The application of the DIC technique is associated with image acquisition,deformation calculation,and image post-processing.The digital images were captured by a highresolution CCD camera with a rate of 9 frames per second and imported into correlation calculation software to measure the fullfield displacements and strains.A 16-channel AE monitoring system (PCI-2) was used to detect AE waveforms,and the gain and trigger threshold was set to 40 dB.The DIC technique involves image acquisition,deformation calculation,and image postprocessing.The high-resolution CCD camera captured digital images at a rate of 9 frames per second,which were then imported into correlation calculation software for measuring full-field displacements and strains.In this study,displacement fields are measured using the DIC technique with a grid spacing of 7 pixels and a subset radius of 16 pixels.During the implementation of the DIC technique,the parameters of the iteration options,i.e.the maximum iteration and the threshold for ‖Δp‖,are set as 50 and 1 × 10⁻⁶,respectively.The radius of the circular window for displacement gradient estimation is set as 7 pixels.For AE signal monitoring,a 16-channel AE monitoring system (PCI-2) was used with a gain and trigger threshold set to 40 dB.Four broadband AE sensors (WD,PAC) were employed,as shown in Fig.1c,with two positioned at the front and another two at the back.To meet the requirement of full-field deformation observation,the two sensors at the front were set beyond the region of interest(ROI) and positioned 75 mm apart.The other two sensors at the back were located at the central axis of specimens and 20 mm away from the fracture plane.
3.Experimental results
3.1.Mechanical response and failure pattern
3.1.1.Strength characteristics
Fig.2 illustrates the relationship between shear stress,normal dilation,and shear displacement for sandstone specimens subjected to different normal stresses.The shear stress-displacement curve exhibits a double-peak shape,with the second peak being less pronounced and substantially lower than the first peak.This behavior arises from two distinct shear stages and failure mechanisms.By setting the great stress drop near the first peak as the boundary,the shear mechanism of sandstone specimens can be divided into two stages: crack coalescence during the pre-peak loading stage and friction sliding along the shear-formed through-going fault during the post-peak loading stage.The first peak represents the crack coalescence strength of the rock bridge,while the second peak signifies the maximum shear resistance of the through-going fault.A quantitative analysis of the shear resistance before and after shearing of the rock bridge is presented in Fig.3.The shear strength of the rock bridge is dependent on the normal stress and can be determined by the cohesion and angle of internal friction of rocks.Therefore,the Mohr-Coulomb criterion is used to describe the relationship between the shear resistance of the rock bridge and the normal stress.The criterion is given by
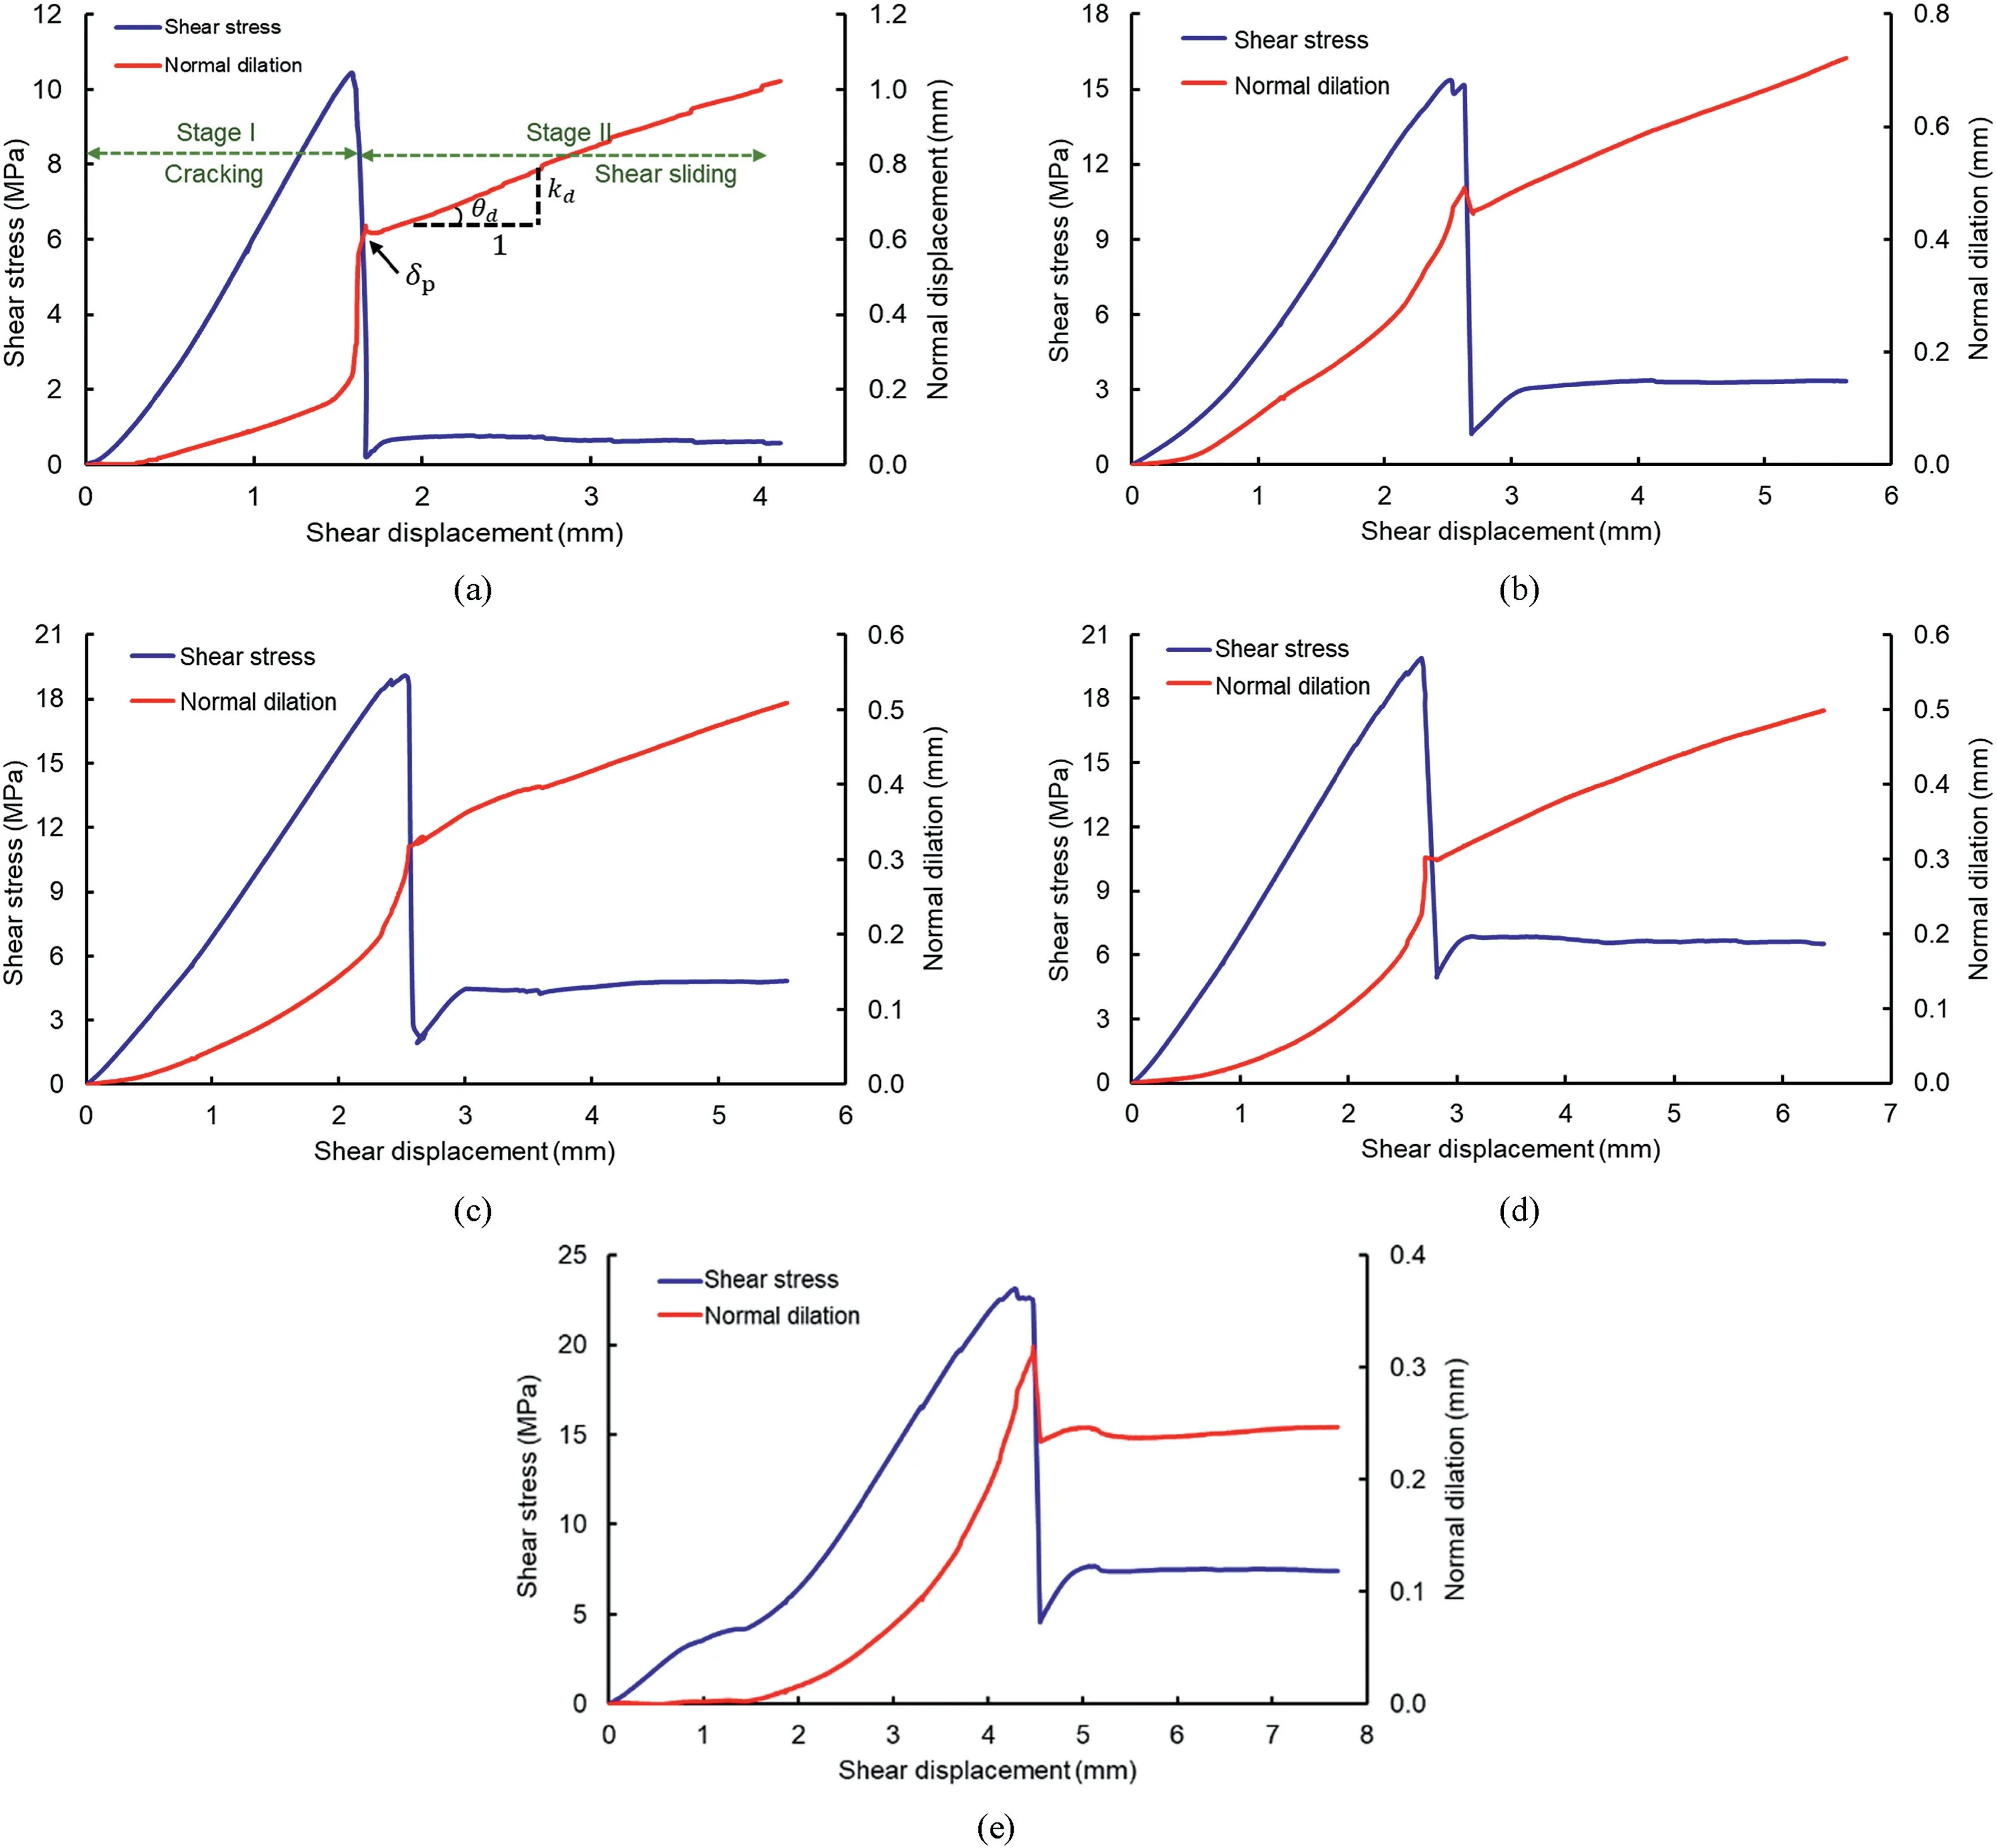
Fig.2.Variations of the shear stress and normal displacement concerning the shear displacement for specimens under different normal stresses: (a) σn=0.5 MPa,(b) σn=3 MPa,(c) σn=5 MPa,(d) σn=8 MPa,and (e) σn=10 MPa.
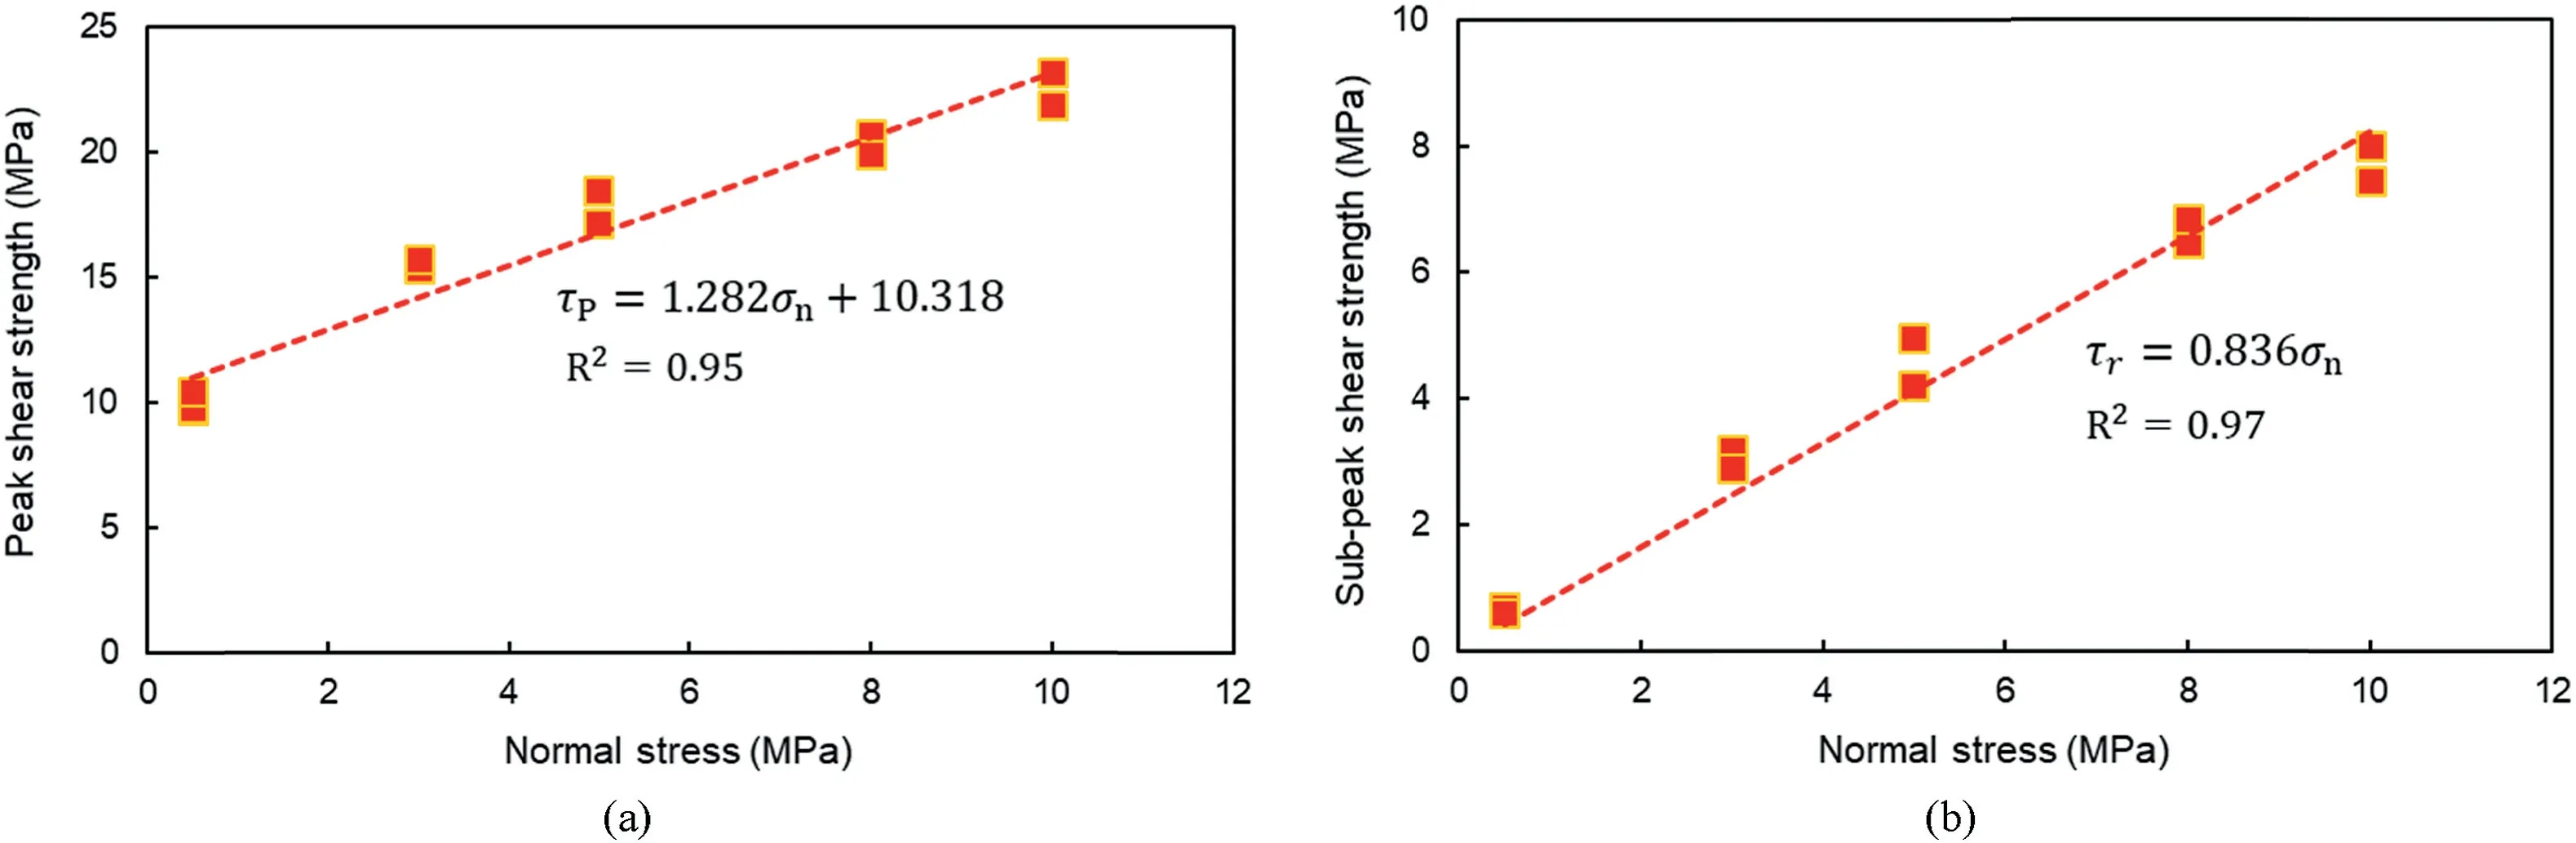
Fig.3.Shear strength under different normal stresses: (a) Peak shear strength,and (b) Sub-peak shear strength.
where τp,σn,φiandc0denote the shear resistance of the rock bridge,normal stress,angle of internal friction,and apparent cohesion,respectively.
After the rock bridge is sheared off,the cohesion of the rock is suddenly lost,and sliding friction is activated along the plane where shearing occurred.Following the great stress drop after the first peak,the shear stress increases to sub-peak shear strength.To estimate the shear resistance along the persistent fault,the rock roughness and residual friction angle are taken into account,and this is modeled by the Barton model (Barton,2013):
where τrdenotes the shear resistance of shear-formed fracture,φrdenotes the residual friction angle,andJCSrepresents the joint wall compression strength.
As depicted in Fig.3a,the relationship between the first shear peak and normal stress is well described by the linear Mohr-Coulomb criterion.This indicates that the variation of shear strength in the rock bridge concerning normal stress is comparable to that of intact rocks without fractures.Moreover,as shown in Fig.3b,the experimental data also exhibit a linear relationship,despite the application of a nonlinear Barton model.Therefore,the relationship between the sub-peak shear strength of the shearformed fault and normal stress can also be modeled by Patton’s strength model(Patton 1966),where τr=σntan(φr+θd)and θdis the dilation angle.The linear fitting relationship in Fig.3b suggests that either the normal stress does not significantly affect the JRC of the shear-formed fault or the shear-formed fault has a small dilation angle θd.Similar linear evolution laws between the shear resistance and normal stress for tension-formed faults have also been reported by Meng et al.(2016).
3.1.2.Deformation characteristics
As shown in Fig.2,during the pre-peak loading stage,there is a slight nonlinear deformation at low shear stresses on the shear stress-shear displacement curve,followed by a linear segment until the peak stress is reached.Meanwhile,the normal dilation exhibits an upward concave shape,and an accelerated increase is observed as the shear stress rises.This is due to the initiation and propagation of cracks at the bridge zone.At the peak shear stress,there is a remarkable stress drop as a result of the crack coalescence between two non-persistent fractures,accompanied by a sudden rise in the normal dilation.The relationship between the deformation index and normal stress is shown in Fig.4.Specifically,Fig.4a depicts the shear displacement at crack coalescencespand its corresponding behavior as the normal stress increases.When σn≤5 MPa,there is a decelerated growth insp,whereas a rapid increase follows as the normal stress further increases.Fig.4b shows the normal dilation at the crack coalescence stress δp,which exhibits a logarithmic decrease with increasing normal stress.

Fig.4.Variations of deformation index with the normal stress:(a)Shear displacement at crack coalescence sp,(b)Normal dilation at crack coalescence δp,(c)Dilation rate kd,and(d) Dilation angle θd.
After the sudden stress drop,a through-going fault with a certain degree of roughness is created due to the sheared rock bridge.This fault undergoes shear sliding,leading to a linear increase in the normal dilation.The dilation ratekd,as shown in Fig.4c,exhibits a logarithmic decrease,indicating that the normal dilation during shear sliding is significantly suppressed by high normal stress.Additionally,the average dilation angle decreases from 10.49°to 1.27°as the normal stress increases from 0 MPa to 10 MPa,as shown in Fig.4d.This observation implies that the shearformed fault in the sandstone generally has low rock roughness.
3.1.3.Failure pattern
Fig.5 shows the morphology of the upper and lower rock blocks after tests to reveal the characteristics of the shear-formed fault and the wearing position during the shear sliding process.Based on observations,it appears that low normal stress is associated with the formation of non-uniform convexities and swellings on the shear-formed fault plane,while high normal stress tends to lead to the formation of a flat plane with low roughness.This observation is in agreement with the analysis of the dilation angle presented in Fig.4d.According to Jiang et al.(2020a),numerous complicated behaviors occur on the shear fracture surfaces during shear sliding along the persistent joint,such as contacting,sliding,gnawing,and wearing.Shear sliding causes stress concentration at the swellings on the shear fracture surface,and the amount of shear wear and convex gnaw-off on the fractured surface is closely related to the applied normal stress.The damaged area on the formed shear surface during the post-peak stage can be easily identified since the area suffering from shear wear shows greater brightness.Notably,slight wear occurs in the sandstone specimen under σn=0.5 MPa.The shear wear area on the shear fracture surface increases with increasing normal stresses.For instance,compared to specimens under σn=0.5 and 3 MPa,scarp abrasion and convex gnaw-off are more significant in specimens under σn=5,8 and 10 MPa.Therefore,the shear fracture surface of specimens under high normal stresses exhibits more debris and slates.Furthermore,crushed and pulverized materials during shear sliding can significantly affect the mechanical and hydraulic behaviors of the joints,as reported by Ghazvinian et al.(2012).

Fig.5.Shear-formed fault of red sandstone specimens under different normal stresses.
3.2.Damage evolution and energy characteristic
3.2.1.Damage evolution
Based on the AE activities,the cracking behavior at the rock bridge and the friction sliding characteristics of the shear-formed fault can be effectively characterized,as shown in Fig.6.The entire shear process can be divided into three stages based on the evolution of the AE count rate and AE hit rate,and each stage has distinct AE responses.During stage I,the rocks experience limited damage,and relatively small AE hit or count rates are observed.As the shear strength of the rock bridge is approached,specimens enter stage II,where several high peaks of AE count rate and AE hit rate are continuously detected until a significant stress drop occurs.This active AE behavior is a result of intense interaction and coalescence at the rock bridge.The maximum AE count rate and AE hit rate usually occur at the significant stress drop resulting from the complete shear-off of the rock bridge.During the post-peak stage(i.e.stage III),friction sliding occurs along the shear-formed through-going fault,and AE events at a nearly constant rate are still detected.Rolling,crushing,and asperity damage along the through-going fault is responsible for these AE events (Gehle and Kutter,2003;Meng et al.,2017).On the other hand,the AE responses are significantly affected by normal stress.Normal stress significantly affects the AE responses,with an increase in normal stress resulting in an increase in the AE count rate and AE hit rate at each stage(Fig.6).This suggests that higher normal stress can lead to worse cracking behavior at the rock bridge and more severe asperity degradation on the through-going fault.When σn≤8 MPa,the increase rate of cumulative AE counts or hits is much greater than that observed at stage III.However,the cumulative AE count and hits for the specimen under σn≤8 MPa becomes smoother,and the slope at stages II and III is comparable.

Fig.6.The evolution of AE hit rate (left column) and count rate (right column): (a,b) σn=0.5 MPa,(c,d) σn=3 MPa,(e,f) σn=5 MPa,(g,h) σn=8 MPa,and (i,j) σn=10 MPa.
The AE amplitude characteristics can provide insights into the density and intensity of microcracks,making it a useful index for studying rock damage and fracturing (Miao et al.,2020).Thebvalue,another AE characteristic parameter obtained from Gutenberg-Richter’s equation,has also been widely used to quantify the proportion of small-to large-magnitude seismic events.The Gutenberg-Richter relation describes the cumulative frequencyamplitude distributions of AE data,and it is given by
whereAdBrepresents the peak amplitude of AE hits in dB,whileNis the number of AE hits with an amplitude greater thanAdB.The AEbvalue refers to the negative slope of the log-linear plot between cumulative frequency and AE amplitude.
Fig.7 illustrates the changes in AE amplitude,bvalue,and shear bands for specimens under σn=0.5 MPa,respectively.Specifically,Fig.7a and b shows the distribution of AE amplitude andbvalue during the shearing process.Fig.7c shows the maximum principal strain contours obtained from the DIC technique,which provides a clear visual representation of crack initiation,propagation,and coalescence in the rock bridge zone.During stage I,only scattered AE events and some fuzzy strain bands are observed near the flaw tips(point A1).As the shear stress increases to 7.4 MPa(point A2),several strain localization bands appear at the two flaw tips and the bridge area,accompanied by an increase in the density of AE events.The AEbvalue begins to decrease from point A2 due to an increase in the proportion of high-amplitude AE events.As the shear stress continues to increase,some strain localization bands evolve into high-strain bands at point A3 and continue to extend.At point A4,multiple curved high-strain bands are visible at the rock bridge,significantly compromising its integrity.Upon reaching the peak shear stress,the rock bridge is fully sheared off,and a throughgoing fault containing a complex fracture network is observed at point A5 in Fig.7c.Throughout stage II,numerous high-amplitude AE events are detected,and the decreasing AEbvalue indicates a growing ratio of macro-to micro-cracks.At the post-peak loading stage,the AE events are evenly dispersed,and their amplitude generally does not exceed 60 dB (Fig.7a).These continually detected AE events arise from shearing friction and slight wearing along the shear-formed fault.

Fig.7.Rock specimen under σn=0.5 MPa: (a) Distribution of AE amplitude,(b) AE b value,and (c) Evolution of shear bands and crack pattern at rock bridge.
Fig.8 shows the evolution of AE amplitude,bvalue,and shear bands for a rock specimen under σn=3 MPa.Similar to the specimen under low normal stress,the specimen under medium normal stress has some low-amplitude AE events at stage I.Short deformation localization band from the inner flaw tip at point B1 accounts for the detection of AE events at stage I.At stage II,except for the strain localization bands from the flaw tips,some subparallel inclined strain bands appear at the rock bridge.The length of these high-strain bands further increases with the increasing shear stress and the rock bridge is gradually damaged before the peak shear strength.Compared to the shear-formed fault under σn=0.5 MPa,straighter shear-formed coalescence patterns are observed under σn=3 MPa.At the post-peak loading stage,the shearing sliding along the newly-formed fracture surfaces is accompanied by shearing friction and wearing,leading to the uniform detection of the AE events.
Fig.9 illustrates the AE responses and shear band evolution of rock specimens subjected to the high normal stress of 8 MPa.Fig.9a indicates that the density of AE events at each stage significantly increases under high normal stress when compared to the specimens subjected to low and medium normal stresses.Besides,stages II and III exhibit a higher density of high-amplitude AE events,suggesting more severe cracking during stage II and asperity damage during stage III.Fig.9c shows that only one coplanar crack initiates at the rock bridge and propagates towards two flaw tips,resulting in a straight through-going fault.Furthermore,under high normal stress,the initiation and propagation of wing cracks from the flaw tips are inhibited.
As depicted in Figs.7b,8b and 9b,it can be seen that the AEbvalue is generally greater during stage I than during stages II and III.This is because microcrack nucleation and initiation dominate during stage I,resulting in numerous small-magnitude AE events.As the stress approaches the peak shear strength,the AEbvalue gradually decreases until the stress drop.This decreasing trend indicates that the ratio of macro-to micro-cracks is increasing,providing a forecast of imminent unstable fracturing.During stage III,the AEbvalue remains approximately constant with increasing shear displacement,although small fluctuations and some scattered data may be related to local wearing and even gnawing breaks at scarp and convex positions on fractured surfaces.The above analysis suggests that a decrease in the AE b value signals impending crack coalescence at the rock bridge,during which highamplitude energetic events are frequently released.Thus,the AEbvalue can be an effective index for rock disaster warnings.
3.2.2.Energy characteristics
Fig.10 illustrates the distribution of AE energy and amplitude for specimens subjected to different normal stresses.The logarithmic scale of absolute energyEabis displayed along with AE amplitude,and a strip is formed by plotting the relationship between AE amplitude and the logarithm of AE energy.As shown in Fig.10,the AE events from specimens under high stress are distributed over a wider range of frequency and amplitude.Therefore,a more elongated strip is observed for specimens subjected to higher normal stress.Furthermore,the area where high-density points gather is located in the lower left of the strip.This indicates that events with low amplitude and energy constitute a significant portion of all detected AE events during the entire shearing process.
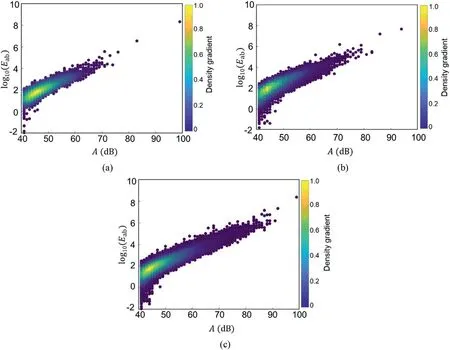
Fig.10.Density gradient analysis of energy distribution in specimens under varying normal stresses: (a) σn=0.5 MPa,(b) σn=5 MPa,and (c) σn=10 MPa.
Fig.11 displays the AE energy rate and cumulative AE energy evolution for rock specimens under low and high normal stresses.The left column provides a global perspective,while the right column offers a detailed view of the AE energy rate below 3 ×10⁶aJ.As shown in Fig.11a,rock specimens under low normal stress release an extremely low energy rate during the pre-peak stage,and significant energy release occurs only at the peak shear strength.However,for rock specimens under high normal stress,some peaks in the AE energy rate appear during the pre-peak loading stage once the shear stress reaches 70%-80% of the peak shear stress(Fig.11c).This large energy release corresponds to the extension and linkage of macrocracks in the bridge area.Additionally,some energy release can result from shear wear,convex gnaw-off,and particle rolling along the shear-formed fault during the post-peak stage.As depicted in Fig.11b and d,the increase in normal stress significantly promotes the magnitude of AE energy release during the post-peak loading stage.In summary,the most intensive AE energy release occurs during the crack coalescence process rather than during the shear sliding along the shear-formed fault.

Fig.11.Evolution of AE energy rate and cumulative AE energy for specimens under different normal stresses: (a,b) σn=0.5 MPa,and (c,d) σn=8 MPa.
Fig.12 illustrates the maximum AE energy release rate (MERR)of sandstone specimens under different normal stresses.The results reveal an exponential increase in the maximum AE energy release rate with increasing normal stress.The mean maximum AE energy release rate for rock specimens under normal stresses of 0.5,3,5,8 and 10 MPa are 1.22×108,3.28×108,7.35×109,2.02×109and 3.42 × 10⁹aJ,respectively.These results imply that higher normal stress levels lead to greater energy release,which can negatively impact the stability of rock engineering and potentially trigger rockbursts in deep rock engineering.
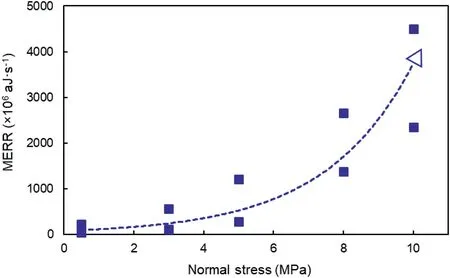
Fig.12.Maximum AE energy release rate (MERR) of specimens subjected to different normal stresses.
3.3.Microscopic fracture mechanism
By applying a fast Fourier transform to the AE signals,the peak frequency and amplitude for each signal can be obtained,providing an intuitive understanding of the focal mechanism of rock microcracking.Fig.13 illustrates the typical distribution of peak frequency and amplitude for a specimen subjected to low,medium,and high normal stresses.It is observed that almost all AE events have a peak frequency of fewer than 300 kHz,with the majority concentrated within the 0-100 kHz range.This pattern results in a low-frequency band spanning from 0 to 100 kHz and a highfrequency band ranging from 100 kHz to 200 kHz,with the peak frequency of 100 kHz serving as the dividing line.The right column of Fig.13 presents a quantitative analysis of the low-and highfrequency AE events.Throughout the shearing process,lowfrequency events with a frequency less than 100 kHz dominate,while high-frequency events account for a smaller proportion.For example,in the specimen subjected to σn=0.5 MPa,the low-and high-frequency events represent 75% and 25% of all detected events,respectively (Fig.13b).The proportion of low-frequency events further increases with increasing normal stresses,while the proportion of high-frequency events is less than 10% for rock specimens under σn=5 MPa and 10 MPa(Fig.13b and d).
The left column of Fig.13 illustrates that energetic AE events with an amplitude greater than 70 dB increase substantially with an increase in normal stresses.Notably,only a few high-amplitude AE events occur near the peak shear stress for specimens subjected to low normal stress (i.e.σn=0.5 MP),as depicted in Fig.13a.Conversely,for specimens under σn=5 MPa and 10 MPa,some high-amplitude events concentrate near the peak shear stress,while other high-amplitude events distribute uniformly during the post-peak stage (Fig.13c and e).Moreover,these high-amplitude events primarily occur within the low-frequency band,with a peak frequency of less than 100 kHz.
It is meant to identify the tensile and shear nature of microcracks in rock specimens containing non-persistent flaws during the shear loading process.One method that combines two AE parameters of rise angle (RA) and average frequency (AF),as suggested by Ohno and Ohtsu (2010),is commonly used to classify tensile and shear cracks.This approach is advantageous because it is fast,simple,and requires few sensors.Fig.14 illustrates the definitions of AF and RA.RA is calculated as the ratio of the rise time to the amplitude of the AE waveform,while AF is determined by the ratio of AE counts to the duration of the AE waveform.
To gain a better understanding of the distribution of AF and RA in specimens under different normal stresses,a density map is employed,as depicted in Fig.15.It can be observed that the differences in normal stress result in diverse distributions of AF versus RA during the shear loading process.For specimens subjected to normal stresses of σn=0.5 MPa,the majority of AE events have an RA of less than 250 ms/V and an AF of less than 100 kHz,and the high-density core tends to approach the origin of the coordinate(Fig.15a).For specimens subjected to medium and high normal stresses,the AE events distribute within a wider AF and RA range,and the high-density area develops into an elongated band parallel to the axis of RA(Fig.15b and c).Tensile fractures are characterized by high AF values and low RA values,while shear fractures have low AF values and high RA values.By analyzing the distribution of AF and RA in specimens,it is possible to determine the nature of cracks and the underlying microscopic fracture mechanism.Therefore,the presence of horizontal narrow bands in the density map indicates that shear cracking dominates the microscopic fracture mechanism of rock specimens subjected to medium and high normal stresses during the shear loading process.

Fig.15.Distribution of AF and RA for specimen under different normal stresses: (a)σn=0.5 MPa,(b) σn=5 MPa,and (c) σn=10 MPa.
Fig.16 presents the distribution of AF versus RA in a specimen subjected to σn=10 MPa during the pre-peak and post-peak loading stages.The pre-peak loading stage corresponds to the progressive damage and cracking at the rock bridge,while the postpeak loading stage involves the shear friction and wearing of the shear-formed fault.A short and fat band is observed in Fig.16a,while an elongated strip parallel to the horizontal axis is observed in Fig.16b.This phenomenon suggests that more shear cracks are generated during the post-peak loading stage compared to the prepeak loading stage.A similar observation can also be found in the other normal stress conditions.

Fig.16.Distribution of AF and RA for specimens under σn=10 MPa: (a) Pre-peak loading stage,and (b) Post-peak loading stage.
4.Discussion
4.1.Crack coalescence at the rock bridge
The normal dilation of a jointed rock specimen is primarily caused by the average aperture of initiated cracks during pre-peak loading combined with the normal deformation of intact rocks.However,the contribution of normal deformation of intact rocks is negligible compared to the aperture of initiated cracks at the rock bridge.Therefore,the average aperture of initiated cracks can be determined by comparing the normal dilation during shear loading.Fig.17 illustrates that the normal dilation of rock specimens decreases significantly with increasing normal stress,suggesting that high normal stress inhibits the dilation of cracks.Tensile cracks with significant flaw aperture usually initiate at the rock bridge,resulting in a significant normal dilation during shearing.However,under high normal stress,tensile cracks are suppressed,and shear cracks are more likely to initiate and propagate at the rock bridge,leading to a reduction in crack aperture.The formation of shear fractures at the rock bridge during shear sliding can be observed in real-time through the gradual formation of deformation localization bands(Figs.7-9).Some bands start from the tip of joints,while most of them initiate within the rock bridge.The propagation path of the initiated cracks deviates significantly from the horizontal plane formed by the two joints at low normal stress,while at high normal stress,the paths are straighter and approximately coplanar to the joint plane.The linkage of these shear bands leads to the formation of a through-going fault with varying roughness.As shown in Fig.4,the average dilation angle decreases from 10.49°to 1.27°as the normal stress increases from 0 MPa to 10 MPa.It means that the roughness of the shear-formed fault gradually decreases with increasing normal stress.

Fig.17.The normal dilation of jointed rock specimens during the pre-peak loading stage.
The progressive damage and fracturing process during the shearing of the rock bridge is confirmed by the evolution of AE parameters.The AE responses distinguish the crack coalescence process into two stages (Fig.6).The AE activities resulting from defects compaction and initiation of microcracks are much weaker at the first stage than at the second stage.In addition,the number and intensity of AE events at the first stage are still closely related to the applied normal stress,and high stress tends to induce more microcracking events.At the second stage,as the shear stress approaches peak shear strength,several high-strain bands are observed at the rock bridge,accompanied by the release of a large amount of AE events.Moreover,the crack coalescence at the rock bridge is accompanied by the detection of several high-amplitude energetic events and decreasing AEbvalue.The stress drop at the peak shear strength indicates the complete shear-off of the rock bridge,leading to an extremely large energy release.The energy released at the stress drop is associated with the applied normal stress,with higher normal stress requiring more energy for the shearing of the rock bridge and driving more severe rock damage(Fig.12).
4.2.Shear sliding of shear-formed fault
The shear-formed fault undergoes shear sliding as the shear displacement continues to increase after the significant stress drop.During the post-peak loading stage,the shear stress quickly reaches a second peak,known as the sub-peak strength,indicating the shear resistance of the shear-formed fault.As the shear displacement further increases,the shear stress decreases slightly and stabilizes.Similar experimental results were obtained by Zhang et al.(2020),who conducted direct shear tests on rock-like samples containing multiple non-persistent joints.The sub-peak shear strength is much lower than the peak shear strength,and the shear-off of the rock bridge significantly reduces the stability of the rock mass (Fig.2).Furthermore,sub-peak shear strength is sensitive to the applied normal stress and can well be described by Patton’s strength model(Fig.3).Moreover,the dilation rate exhibits a logarithmic decrease,indicating that the normal dilation during shear sliding is significantly suppressed by high normal stress(Fig.4).As revealed by Fig.2e,the normal dilation of the shearformed fault is almost suppressed under σn=8 MPa.
The progressive damage process of the shear-formed fault can be well quantified by the AE technique,which can provide valuable guidance for stability analysis of rock engineering controlled by persistent discontinuities.As shear sliding along the shear-formed fault occurs,the asperities on the surface gradually degrade,resulting in the stable emission of AE signals (Fig.6).The degradation of the asperities increases with the applied normal stress,as can be observed from the increases in the AE count rate and AE hit rate(Fig.6),which is confirmed by examining the fracture surfaces after tests (Fig.5).The abrasion area and crushed debris on the shear-formed fault also increase with increasing normal stress,as revealed by Fig.5.The stable shear damage process is further characterized by a nearly constant AEbvalue during the shear sliding,despite some scatters from local asperity cutting (Figs.7-9).Although a slight increase in the cumulative AE energy is observed during the shear sliding process,the energy induced by the asperity damage of sandstone specimens is insignificant compared to the energy released during the crack coalescence process.In addition,the energy release rate during the shear sliding of the shear-formed persistent joint is dependent on the applied normal stress,with higher normal stress resulting in larger energy release rates (Fig.11).
4.3.Microscopic fracture mechanism
The fracture behavior in rock specimens with non-persistent joints under compressive-shear loading is a complex process that involves cracking inside the intact rock,frictional sliding,and degradation of asperities on the shear-formed persistent fault.To reveal the microscopic fracture mechanism of sandstone specimens with non-persistent joints in direct shear tests,this study quantifies AE characteristic parameters in the frequency domain.The distribution of peak frequency and AE amplitude for specimens under different normal stresses shows that more than 75% of AE events have a peak frequency of fewer than 100 kHz and are located in the low-frequency band (Fig.13).Previous research conducted by Aggelis et al.(2013)has shown that the peak frequency of AE events is related to the fracture mechanism.Low frequencies and long waveforms are associated with shear fracturing,while higher frequencies and shorter waveforms correspond to tensile fracturing.Therefore,it can be concluded that most AE events during direct shear loading are induced by microscopic shear cracks.Moreover,the portion of AE events located in the low-frequency bands increases with the increasing normal stress,indicating that specimens subjected to greater normal stress generate more microscopic shear cracks.The high-amplitude AE events are mainly located in the low-frequency bands (0-100 kHz),although some are located within the high-frequency bands(greater than 100 kHz)at the prepeak loading stage for the specimen subjected to σn=10 MPa.This is because the AE signals from shear cracks are long waveforms that require more energy.
The distribution of RA and AF is another method used to identify the types of cracks in rock specimens,including tensile or shear cracks.Similar to the distribution of peak frequency,the majority of AE events detected from all specimens have an average frequency of fewer than 100 kHz,as illustrated in Fig.15.The high-density core of the density contour changes from a small circle to an elongated band with its major axis parallel to the RA axis as the normal stress increases.This indicates that specimens subjected to high normal stress tend to release more AE signals with a greater RA value.Furthermore,the distance between the high-density core and the RA axis gradually decreases with increasing normal stress,suggesting that the average RA value of AE events decreases.This means that rock specimens subjected to high normal stress tend to produce more events with a low AF value and high RA value,indicating that more shear cracks are induced during the shear loading process for specimens under high normal stress,as compared to those under low normal stress.This conclusion is consistent with that obtained from the distribution of the peak frequency of AE events.Similarly,a comparison of the density contour of AF and RA before and after the peak shear strength in Fig.16 shows that more microscopic shear cracks are induced at the post-peak loading stage than at the pre-peak loading stage for rock specimens.
When quantitatively identifying the microscopic fracture mechanism within rock specimens,a common approach for distinguishing the type of initiated cracks is to plot the AF versus RA values of detected AE signals by choosing a criticalKvalue(Aggelis et al.,2013).In general,the AF and RA values from tension tests(such as direct tension tests,Brazilian disk split test,and threepoint loading test) and direct shear tests are plotted together to determine the criticalKvalue.This value is selected to make the proportion of data from tension tests above a line with a slope ofK,equal to the proportion of data from direct shear tests below this line.However,it should be noted that the AF versus RA values vary significantly with normal stress,which may affect the determination of an effective and reliable criticalKvalue when using data from direct shear tests under different normal stresses.Further research is needed to accurately determine the type of cracks in rocks exposed to complex stress conditions.
4.4.Implications for rock engineering projects
4.4.1.Faulting mechanism
The key topic of interpreting faulting mechanisms is understanding how fault zones develop and how they relate to the extension of pre-existing joints.Experimental and field studies have documented several different mechanisms for fault growth and development.It is believed that faulting involves the shearing of pre-existing joints,and the geometry and properties of these joints significantly affect the faulting process (Kim et al.,2003;Myers and Aydin,2004;Asadizadeh et al.,2017).Previous studies have shown that fault zones formed from pre-existing joints evolve predictably due to the brittle fracturing in a relatively homogenous medium.These fault zones are generally composed of sheared joints,splay fractures,and fragmentation zones,as shown in Fig.18.Detailed field studies in the Jurassic Aztec Sandstone in the Valley of Fire State Park,Nevada,USA,have led to the conclusion that strain accumulation between pre-existing joints accounts for the hierarchical succession of structures within fault zones(Myers and Aydin,2004).The shear band evolution and crack development at the rock bridge are used to explain the complexities of faulting in this study.We have observed that the shearing of the rock bridge is initiated by the formation of wing cracks from existing cracks,then growing into material bridges,and concluded by the generation of additional new fractures connecting the initial cracks in the zone between the wing cracks (Figs.7-9).In situ observation indicates that the magnitude of fault normal stress enhances deformation band localization while inhibiting dilational effects such as clast rotation and joint formation (Myers and Aydin,2004).This conclusion is consistent with experimental results.Therefore,these test results are competent in revealing the faulting mechanism and structure evolution of non-persistent joints during the strike-slip process.

Fig.18.Mesoscale strike-slip faults and damage zones at Marsalforn,Gozo Island,Malta:(a)A strike-slip fault zone with a linking damage zone,and(b)Left-lateral strike-slip fault zones with damage zones between two fault segments (modified from Kim et al.,2003).
4.4.2.Stability analysis of geotechnical engineering
Rock masses are typically characterized by faults,joints,bedding planes,fractures,and other planes of weakness that significantly reduce their shear strengths and stiffnesses.Understanding the shear mechanical behavior of flawed rock masses is crucial for designing and interpreting geological hazards,such as rock landslides and collapses,as well as predicting the failure of surrounding rock in underground engineering (Fig.19).The discontinuities and rock bridges in rock slopes are generally subjected to low normal stress,while the jointed rocks in deep underground engineering are subjected to high normal stress.Our study shows that normal stress plays a pivotal role in the shear strength,dilation behavior,and energy release during the shearing of rock bridges and the subsequent shear sliding of the fault zone.We found that the shear rupture of the rock bridge between the non-persistent joints is accompanied by a considerable stress drop and a huge energy release.The energy release rate at the rupture of the rock bridge positively depends on the normal stress applied to the joints.Such energy release can trigger hazards and secondary disasters,such as rock collapse,rockburst,and mine water inrush,which can significantly impact the stability of rock engineering.For example,at the Jinping II Hydropower Station in China,dynamic disturbanceinduced rockbursts frequently occur,and most of them take place along discontinuities (Chen et al.,2013).Therefore,understanding the shear behaviors of rock bridges and shear-formed faults in underground engineering is vital for hazard assessment and the design of appropriate measures to ensure the safety and stability of rock engineering (Chen et al.,2013).

Fig.19.Rock slope and deep rock engineering containing non-persistent joints.
The present study highlights the dominant cracking behavior at rock bridges under different normal stress conditions.Specifically,it is observed that tensile macrocracks with substantial aperture and curved paths dominate at low normal stress,while shear cracks tend to initiate and propagate at high normal stress,resulting in a reduction of crack aperture.It has been known that the complexity,average aperture,and connectivity of the crack network play a crucial role in determining the permeability of rock mass and properties of underground water flow (Zhuang et al.,2020).Therefore,an analysis of cracking behavior,rock roughness,and failure modes of shear-formed fault zones can aid in evaluating the hydraulic transmissivity of bedrock in various applications such as deep waste disposal,geothermal energy,and stimulation of hydrocarbon recovery (Rutter and Mecklenburgh,2018).Notably,fault activation can be induced by diverse engineering activities,such as underground mining,geothermal extraction,shale gas production,reservoir storage,and wastewater injection (Zhang et al.,2023).In this regard,an investigation into the sliding characteristics of shear-formed fault zones can help interpret the fault activation mechanism.
4.4.3.Geological hazard prediction
The AE technique is a powerful method to investigate rock fracture processes,as it allows for the detection of microcracks before macroscopic failure and the tracking of crack propagation(Ishida et al.,2017).Full-scale AE monitoring has been implemented during tunnel construction and slope instability analysis,which is characterized by large scale,long time,massive data,and complex geological backgrounds.By tracking microseismic signals in rocks,the frequency,quantity,scope,and intensity of the cracking events can be identified.For example,Codeglia et al.(2017) utilized the AE technique to identify approaching failures and provide early warning of the instability of rock slopes.Similarly,Cheng et al.(2013) employed the AE technique to study AE characteristics and predict geological hazards.Thus,it is crucial to comprehend the evolution and precursory characteristics of AE events for early warning of geological hazards.
This study reveals that the emergence of high-strain bands at the rock bridge for crack coalescence is accompanied by a surge in AE count rate,AE hit rate,the density of AE events,AE energetic release rate,and a significant decrease in the AEbvalue.Among these AE characteristic parameters,the AEbvalue is more sensitive to the generation of macrocracks and can serve as an index for disaster warnings.Furthermore,a detailed analysis of the AE waveform can reveal the percentage of tensile and shear cracks,which is valuable for optimizing and designing support schemes in rock slopes and underground engineering.
5.Conclusions
The study aimed to investigate crack coalescence behavior between non-persistent joints and the characteristics of asperity damage in shear-formed persistent joints.To accomplish this,direct shear tests on sandstone specimens under varying constant normal stresses were conducted,and DIC and AE techniques were used to monitor shear band evolution and acoustic responses throughout the loading process.Some key conclusions are summarized as follows:
(1) The shear stresses associated with the peak and sub-peak in the stress-displacement curve are considerably influenced by the applied normal stress.These relationships are accurately described by the Mohr-Coulomb criterion for the peak shear stress and by Patton’s strength model for the sub-peak shear stress.
(2) There are apparent differences in crack coalescence behavior between specimens subjected to different normal stresses.The strain localization bands show a curvilinear propagation path at low normal stress,which are mainly tensile cracks and accompanied by great normal dilation.Coplanar shear cracks with straighter propagation paths are observed at the rock bridge under high normal stress,whose normal dilation is substantially suppressed.
(3) The increase in normal stress dramatically increases the number and intensity of AE events,and the number of highamplitude energetic AE events also increases in specimens subjected to higher normal stress.In addition,the energy induced by the asperity damage of sandstone specimens is insignificant compared to the energy released during the crack coalescence process.There is an exponential increase in the maximum AE energy release rate with increasing normal stress.
(4) More than 75%of AE events are located in the low-frequency band with a peak frequency ranging from 0 to 100 kHz,and the portion increases with increasing normal stress.Rock specimens subjected to high normal stress tend to produce more events with a low AF value and high RA value,indicating that more shear cracks are induced during the shear loading process for specimens under high normal stress,as compared to those under low normal stress.
Declaration of competing interest
The authors declare that they have no known competing financial interests or personal relationships that could have appeared to influence the work reported in this paper.
Acknowledgments
This work was supported by the National Natural Science Foundation of China (Grant No.52125903).
杂志排行

Journal of Rock Mechanics and Geotechnical Engineering的其它文章
- Determination of uncertainties of geomechanical parameters of metamorphic rocks using petrographic analyses
- Evaluation of excavation damaged zones (EDZs) in Horonobe Underground Research Laboratory (URL)
- On the calibration of a shear stress criterion for rock joints to represent the full stress-strain profile
- Effect of dynamic loading orientation on fracture properties of surrounding rocks in twin tunnels
- Experimental study on the influences of cutter geometry and material on scraper wear during shield TBM tunnelling in abrasive sandy ground
- Effect of fracture fluid flowback on shale microfractures using CT scanning