Transfer relation between subgrade frost heave and slab track deformation and vehicle dynamic response in seasonally frozen ground
2024-02-05JuanjuanRENJunhongDUKaiyaoZHANGBinYANJinchengTIAN
JuanjuanREN,JunhongDU,KaiyaoZHANG,BinYAN,JinchengTIAN
Research Article
Transfer relation between subgrade frost heave and slab track deformation and vehicle dynamic response in seasonally frozen ground

1MOE Key Laboratory of High-speed Railway Engineering, Southwest Jiaotong University, Chengdu 610031, China2School of Civil Engineering, Southwest Jiaotong University, Chengdu 610031, China3School of Civil Engineering, Central South University, Changsha 410075, China4Airport Planning and Design Institute, POWERCHINA Kunming Engineering Corporation Limited, Kunming 650051, China
Subgrade frost heave in seasonally frozen ground can greatly influence the safety and smooth running of high-speed trains and the service performance of track structures. In this study, we used a static model to: (1) investigate track–subgrade frost heave and develop a dynamic model of vehicle–track–subgrade frost heave; (2) explore the transfer relation between subgrade frost heave and track structure deformation; (3) examine the characteristics of interlayer debonding; (4) study the influence of subgrade frost heave on the dynamic response of vehicles in high-speed railways in seasonally frozen regions. A Fourier series was used to fit the frost heave waveform and simulate the behavior of subgrade uneven frost heave using data collected on-site. The results show: (i) The position of frost heave significantly affects the transfer of deformation to a slab track. The largest deformation of the track slab, with the amplitude transfer ratio reaching 20%, was recorded when the frost heave occurred near the joint of the base plate. (ii) At the same frost heave amplitude, long-wave frost heave causes smaller deformation and debonding of the track structure than short-wave frost heave. In the wavelength range of 10–30 m, the main frequency of the acceleration spectral density was concentrated between 3.5 and 3.7 Hz, with larger frost heave wavelengths producing smaller superposition on the vertical acceleration of the vehicle. (iii) The maximum wheel–rail force occurs when the front bogie passes the frost heave peak, with greater frost heave amplitudes producing greater wheel–rail force. From these results, we conclude there is a clear need to control the frost heave deformation of the track to reduce the dynamic response of the vehicle and in turn improve train operations.
Slab track; Subgrade frost heave; Transfer relation; Vehicle–track–subgrade coupling; Dynamic response
1 Introduction
In recent years, major transportation in China has centered on high-speed railways, which have seen huge investments and expanded rail networks. By the end of 2022, the operating mileage of the China Railway High-speed (CRH) railway exceeded 42000 km (Ye WL et al., 2023), of which over 8000 km is located on seasonally frozen ground (Ren et al., 2022). Such frozen soil is widely distributed in Northeastern, Northern, and Northwestern China, and accounts for 53.5% of China's total land area (Lin et al., 2018; Zhang et al., 2020). The slab track has become an important basic structure to guide and support the operations of high-speed trains due to its advantages of high smoothness, high stability, and low-frequency maintenance (Ren et al., 2023a). The China Railway Track System (CRTS) III slab track is a national development technology designed for high-speed railway ballastless track structures (Fig. 1) (Ren et al., 2022). It is composed mainly of rails, fasteners, track slabs, self-compacting concrete (SCC) layers, geotextile isolation layers, and base plates, and has been applied to many key lines including the Panjin–Yingkou high-speed railway, Shenyang–Dandong intercity railway, and Harbin–Mudanjiang high-speed railway. These regions experience huge seasonal changes—subgrade freeze and heave are common in winter, before thawing and settling in summer.
Subgrade frost heave is one of the main problems facing high-speed railway infrastructure in seasonally frozen ground (Ren et al., 2022) as it causes interlayer sliding and debonding, and maps upward in the form of deformation on the rail, resulting in changes in the geometric form of the ballastless track (Fig. 2). Such deformation impacts the safety, stability, and comfort of the vehicles (Cai et al., 2019), and track irregularity caused by subgrade frost heave in the ballastless track structures increases the dynamic interaction between wheels and rails (Wang et al., 2014; Auersch, 2015). This causes strong vibration in the track structure, thereby weakening the material properties of the track structure and affecting the service state of high-speed railways (Hwang et al., 2018; Zeng et al., 2022). Therefore, the frost heave damage to high-speed railway subgrade in seasonally frozen areas needs to be addressed urgently.
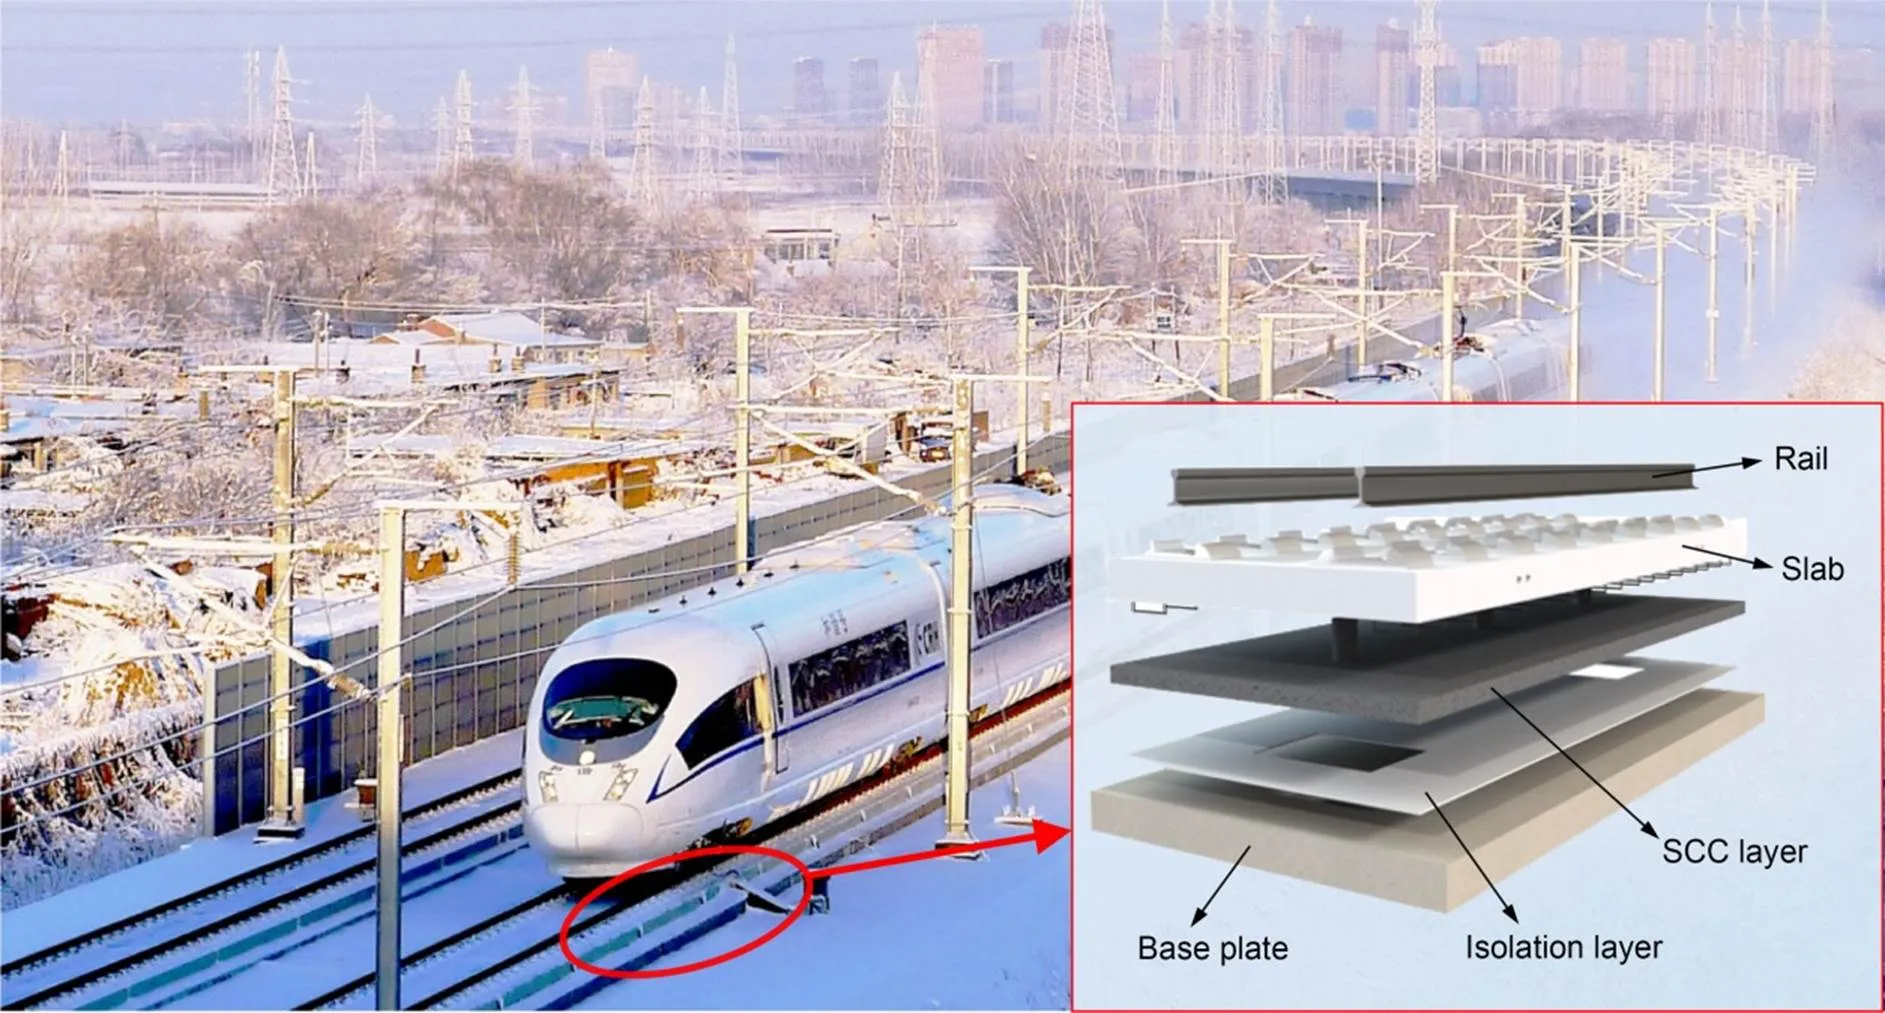
Fig. 1 CRTS III slab track (Ren et al., 2022)
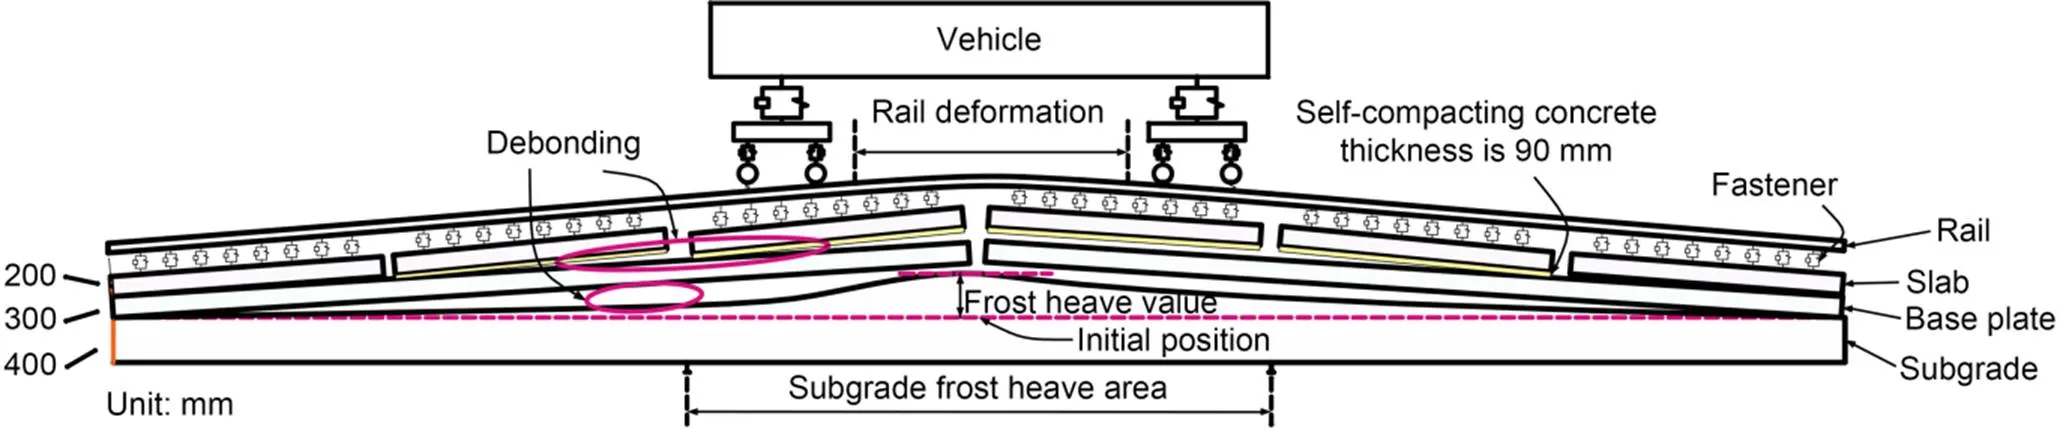
Fig. 2 Schematic diagram of subgrade frost heave deformation
Research on frost heave deformation of high-speed railway subgrades in seasonally frozen regions has been carried out mainly through theoretical analysis and field observations. For example, Ma et al. (2016) studied the impact of frost heave on railway subgrade deformation by using multiple global positioning system (GPS) data stations. Hunt (2005, 2007) presented a method to quantify the roughness of various rails, which is important for evaluating low-frequency ground vibrations near railway lines. Most scholars converted monitored data into a cosine curve to simplify the characteristics of subgrade uneven frost heave (Wang et al., 2015; Zhang YZ et al., 2015; Zhang S et al., 2016; Wu et al., 2018; Niu et al., 2020) and study the service state of the track structure. Gao et al. (2020) proposed a new finite element model based on an explicit algorithm to evaluate the impact of frost heave on the entire dynamic system. Luo et al. (2017) established a vehicle dynamics model to study the influence of uneven frost heave on train vibration and found that track irregularity caused by frost heave was the most important factor causing vehicle vibration. Cai et al. (2021) used the concrete constitutive theory to set up a nonlinear finite element model that couples the CRTS III ballastless track with the subgrade. They analyzed the deformation of the track structure under different subgrade frost heave conditions and proposed an amplitude limit of subgrade frost heave.
Other studies have focused on the transfer relation between subgrade and bridge settlement (Ren et al., 2023b) and track structure deformation. Jiang et al. (2019) established a 3D finite element model that considers the contact between different layers. The model revealed the transfer characteristics of subgrade surface settlement in relation to track structure deformation. Zhou et al. (2020) explored the transfer relationship between bridge pier settlement and rail deformation of the CRTS I slab track system based on the principle of stationary potential energy. Paixão et al. (2015) studied the effect of uneven settlement on the dynamic response of a vehicle–track system through numerical analysis. Gou et al. (2019) conducted a theoretical study on the transfer relationship between the vertical deformation of bridges and the geometric deformation of tracks. Their model can reasonably predict the geometric deformation of a track structure under different vertical deformations of bridges. Jiang et al. (2022) analyzed the dynamic response of the vehicle–track system caused by the uneven settlement of the subgrade and evaluated the performance of the railway under different settlements. The above review shows that previous research into the transfer relation between subgrade deformation and upper track structure deformation focused mainly on settlement deformation and barely covered information relating to frost heave.
Due to the vertical multi-layer nature of the ballastless track, frost heave deformation is mapped by layer from the bottom to the top. The deformation of each layer results in subgrade arching, interlayer debonding, and rail surface deformation, separately, all of which impact safety, comfort, and service performance. Thus, structural deformation must be considered comprehensively, and requires an analysis of the transfer of subgrade frost heave to the deformation across the base plate, track slab, and rail. Current research on the structural deformation of ballastless tracks caused by subgrade frost heave uses mainly classic cosine waveforms as the input condition (Gao et al., 2020). However, the subgrade frost heave is non-uniform, and the amplitude of the frost heave at the start and end points is not zero. In this study, the implementation of a Fourier series to model the frost heave curve efficiently tackles this concern and more accurately portrays the non-uniformity of frost heave. Additionally, the Fourier series curve has a better fitting effect than other published methods and is more responsive to the actual frost heave waveform of the field data in this study.
With all these points considered, this study takes the CRTS III slab track as the research object. Compared with other studies, this study has some innovations. The frost heave waveform is fitted based on measured data through a Fourier series in this study and is used as the input boundary condition for the finite element model. Supported by measured data, the calculation results obtained are rendered more reliable and practical. Moreover, a complete research idea from field monitoring to theoretical analysis is provided. Additionally, a calculation approach is proposed whereby the computation results of the static model are used as the initial conditions for a dynamic model, through which the calculation process is simplified and computational efficiency improved. The transfers between different layers of the track structure and the characteristics of debonding provide an understanding for the prevention and treatment of subgrade frost heave problems in seasonally frozen ground.
This study includes five main parts. In Section 2, we describe frost heave waveform fitting based on field data. In Section 3, we develop the spatial coupling finite element model of track–subgrade frost heave, and in Section 4, we derive the transfer relation between subgrade frost heave and ballastless track deformation. In Section 5, we describe the vehicle–track–subgrade frost heave spatial coupling finite element model, and in Section 6, we explore the effect of subgrade frost heave on the dynamic response of the vehicle. Since subgrade frost heave can lead to track irregularities, we also describe the dynamic response of the vehicle body to track irregularities (Hunt, 2005; Auersch, 2015).
2 Waveform fitting of subgrade frost heave
In this study we monitored subgrade frost heave on a specific section of a high-speed railway line, using continuous monitoring methods from K329+305 to K329+333. There are four stages of frost heave changes—initial freeze, rapid freeze, stable freeze, and thawing settlement. The stable freeze stage typically occurs from early January to mid-March, represented in this study by the detection period from Jan. 1 to Feb. 29. Fig. 3 shows the historical curves of subgrade frost heave deformation in this section. The time spans are from Jan. 1 to Jan. 31, 2020 (Fig. 3a) and from Jan. 31 to Feb. 29, 2020 (Fig. 3b).
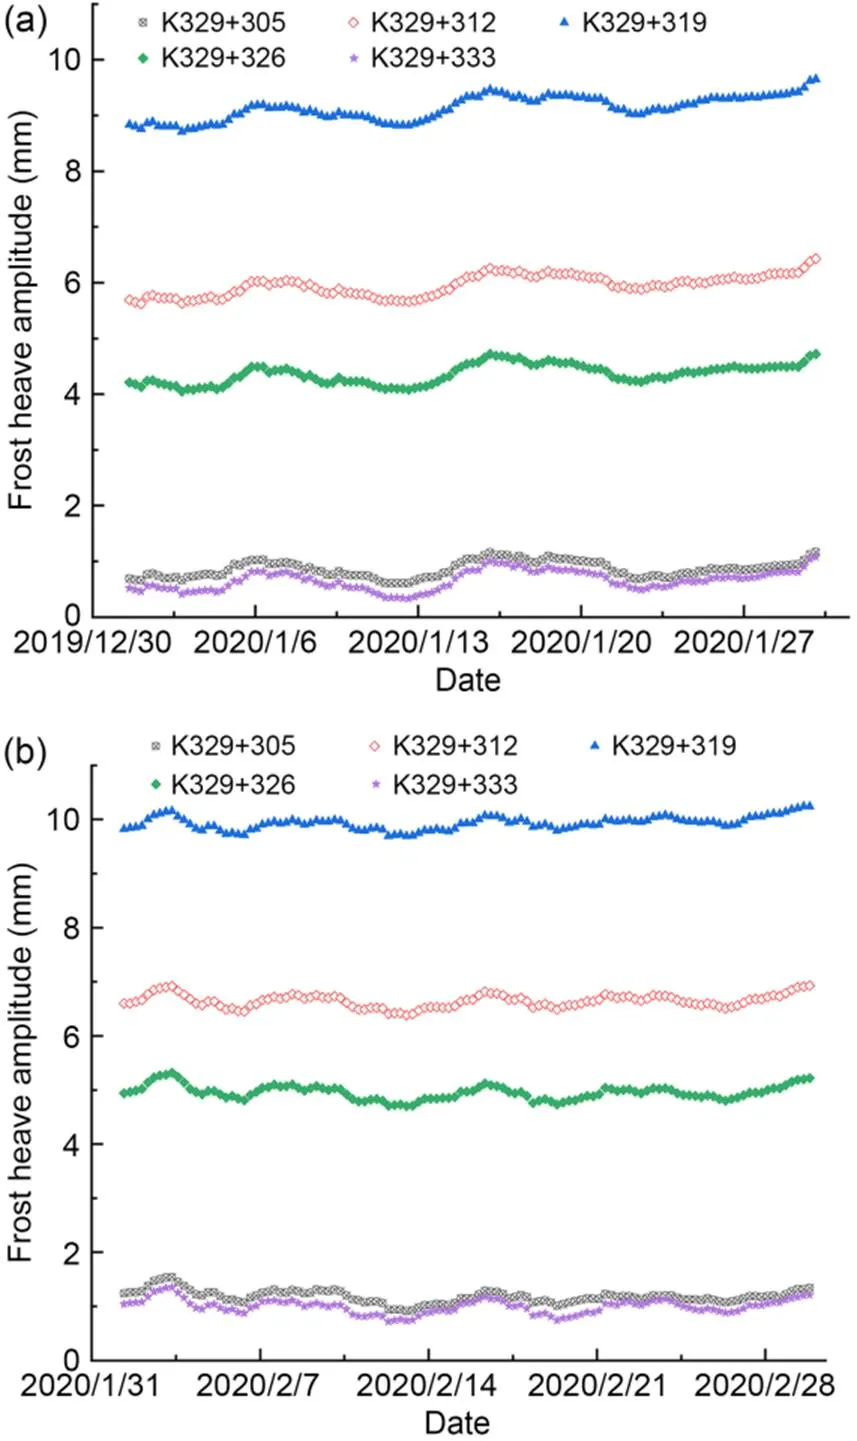
Fig. 3 Subgrade frost heave deformation curves: (a) subgrade deformation curve in Jan., 2020; (b) subgrade deformation curve in Feb., 2020
The data fitting is given in Section S1 of the electronic supplementary materials (ESM), including fitting steps for frost heave curves.
The general expression of the classical cosine type frost heave curve (Gao et al., 2020) is shown in Eq. (1):
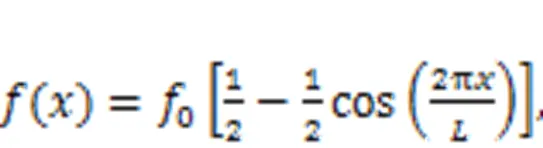
Fig. 4 shows that the Fourier series curve provides better results and reflects the actual frost heave waveform, which is why we selected the Fourier series curve as the input boundary condition in this study.
3 Spatial coupling finite element model of track–subgrade frost heave
To explore how the frost heave waveform curve influences the deformation transfer between the subgrade frost heave, base plate, track slab, and rail, and the subsequent vehicle dynamic response, the Fourier-type frost heave curve fitted by the measured data was used as the boundary input condition. Two special coupling finite element models were built: one static model of slab track–subgrade frost heave, and one dynamic model of vehicle–track–subgrade frost heave.
The finite element software ABAQUS was used in this study to establish a numerical model. The finite element model of the CRTS III slab track was composed of rails, fasteners, track slabs, SCC, base plate, and the surface layer of the subgrade bed (Fig. 5). The fasteners were simulated using wire springs with 30-kN/mm vertical stiffness and 45-kN/mm longitudinal and lateral stiffness; the size of the track slab was 5.60 m×2.50 m×0.20 m and the distance between track slabs was 70 mm; the thickness of the SCC layer was 0.09 m; the size of the convex stop was 1.00 m×0.70 m×0.10 m; the size of the base plate was 11.32 m×3.10 m×0.30 m. The CHN60 rails, slab, SCC layer, base plate, and subgrade were simulated by the element. Assuming that there is infinite soil below the subgrade, the subgrade bottom was fully constrained and the deformation effect of infinite soil was ignored. The rail is a continuous long structure, and the longitudinal displacement at both ends was constrained to simulate the function of a continuously welded rail. The connection between the track plate and the SCC layer was simulated by a common node. Considering calculation efficiency and accuracy, the grid size of the track plate, SCC layer, and base plate was 0.15 m, 0.15 m, and 0.20 m, and the number of units 44992, 16896, and 23880, respectively. Details of the material properties are shown in Table 1.
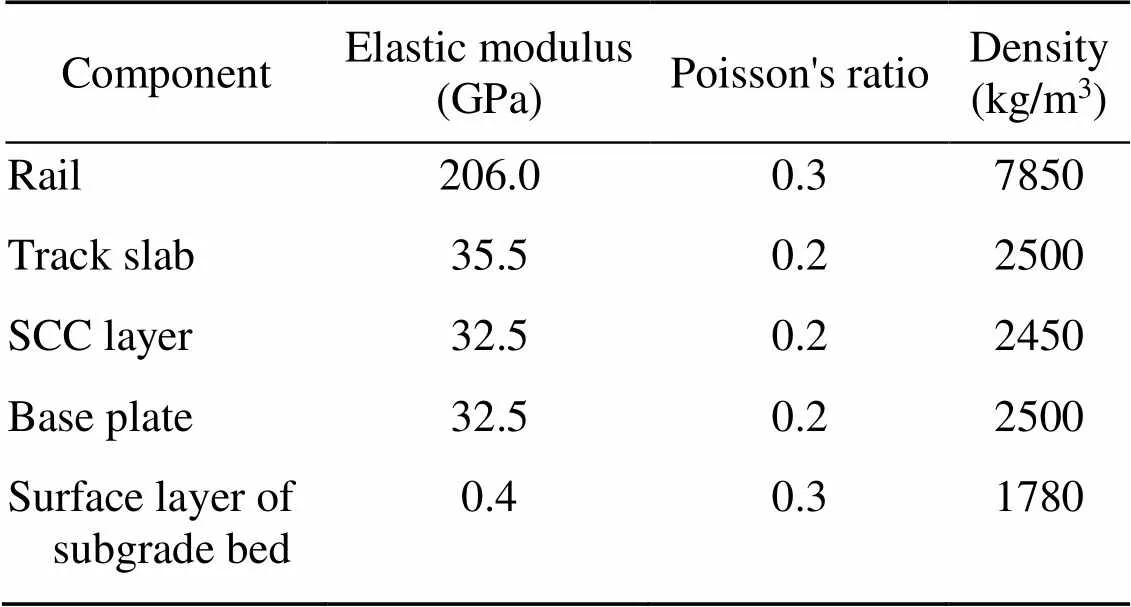
Table 1 Material properties of track structure
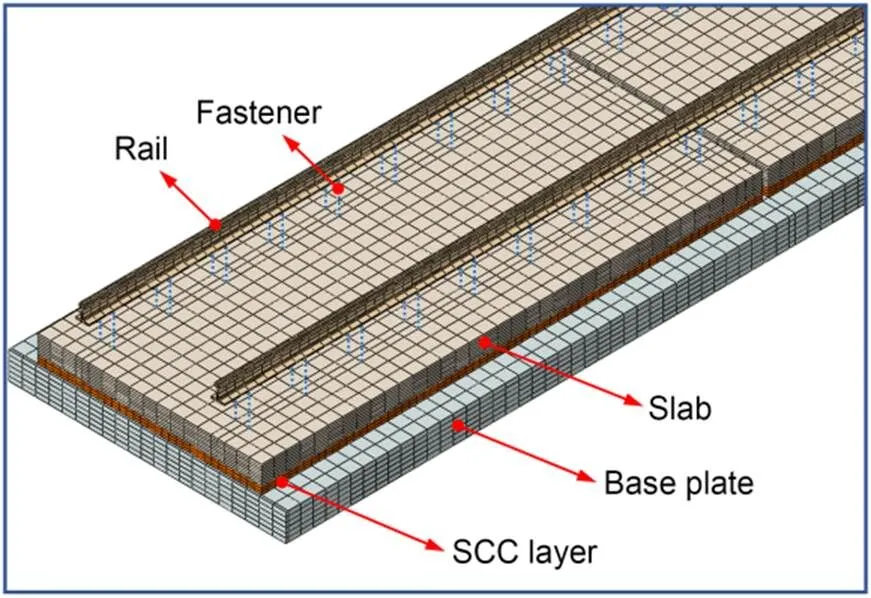
Fig. 5 CRTS III slab track local finite element model
The CRTS III slab track (Sufaat et al., 2022) uses unit slabs, where a base plate is set longitudinally for every two to four slabs. In our model, every two slabs matched one base plate. From the total of eight track slabs used to reduce the boundary effect on the calculation results, we took the middle four for analysis. The track slab and the SCC layer are connected by door-shaped steel bars, and binding constraints were used to simulate the connection between layers. A geotextile is set between the SCC layer and the base plate as an isolation layer. This creates large vertical stiffness, small vertical deformation, and relative sliding between adjacent layers. Therefore, a hard contact was set between the SCC layer and the base plate in the normal direction. In the tangential direction, a penalty formula was used to describe the relative sliding between layers, and the friction coefficient was set to 0.7 (Ye QZ et al., 2023). To simulate the weak connection between the subgrade and the base plate caused by cyclic frost heave and thaw settlement, a separable surface-to-surface contact was set between the subgrade and base plate, and the interlayer bonding effect was ignored. In this study, we considered the most unfavorable situation and disconnected the joints between base plates (Ren et al., 2022). Deformation and interlayer debonding of ballastless track structures are caused by the frost heave that maps upward, so forced displacement was imposed on the surface of the subgrade bed to simulate the boundary conditions of subgrade frost heave. The analytical field equation of frost heave excitation was as follows:
()5.559–4.406cos(0.2196)1.125sin(0.2196).
To simplify the calculation process and improve the calculation efficiency, the following assumptions were made for the model in this study:
(1) The model considers only the linearity of ballastless track components.
(2) The deformation of the ballastless track structural components was elastic deformation.
(3) The model does not account for the effect of infinite soil under the roadbed on the deformation of the track structure and the dynamic response of the vehicle.
Therefore, this model is applicable only to the investigation of the deformation of track structure and vehicle dynamic characteristics by subgrade frost heave under an ideal elastic state.
Subgrade material parameters and statics model validation are described in Section S2 of the ESM.
4 Transfer relation between subgrade frost heave and ballastless track deformation
The frost heave deformation of the subgrade was mapped upward from the surface of the subgrade bed, forming a multi-layer deformation transfer mechanism that covered the subgrade–base plate–track slab–rail system. Based on the results of the CRTS III slab track–subgrade frost heave spatial coupling static model, the Fourier series curve was taken as the boundary input condition. Then, using controlled variables, the deformation transfer relation and interlayer debonding characteristics of the ballastless track at different frost heave positions, amplitudes, and wavelengths were studied. Typically, in engineering practice, vertical irregularities caused by frost heave are considered, but the influence of frost heave in the horizontal direction is not.
4.1 Influence of frost heave position on deformation transfer
The longitudinal frost heave deformation was characterized by the refined Fourier series curve and used to explore the influence of different positions of frost heave of the subgrade on vertical deformation transfer of the slab track. The frost heave wavelength selected was 20 m, and the frost heave amplitude 20 mm. Due to the symmetry of the track structure, we selected three typical positions to study: the joint of the base plate (position A), middle of the track slab (position B), and joint of the track slab (position C), as shown in Fig. 6.
When the subgrade suffers from frost heave, the deformation is sequentially transmitted to the upper layers, namely, the base plate, SCC layer, track slab, and rail, resulting in variable degrees of arching. The rail has better continuity than other track layers, and its deformation is consistent with subgrade frost heave. Debonding occurs mainly between the surface layer of the subgrade and the base plate, and between the base plate and the SCC layer. Since the track slab and the SCC layer form the composite slab, they share common nodes in the model. As a result, the deformation between them is basically consistent. At position A, the base plate debonds from the subgrade at both the crest and the trough of the wave, while the debonding between the SCC layer and the base plate occurs at the crest of the wave. At position B, debonding between the base plate and the subgrade is generated at the foot of the frost heave wave and is large at the wave crest. Debonding between the SCC layer and the base plate starts at the end of the SCC layer, which is above the frost heave wave peak. At position C, large debonding is found between the base plate and the subgrade at the wave foot, and the debonding between the SCC layer and the base plate occurs at the end of the SCC layer at the wave crest.
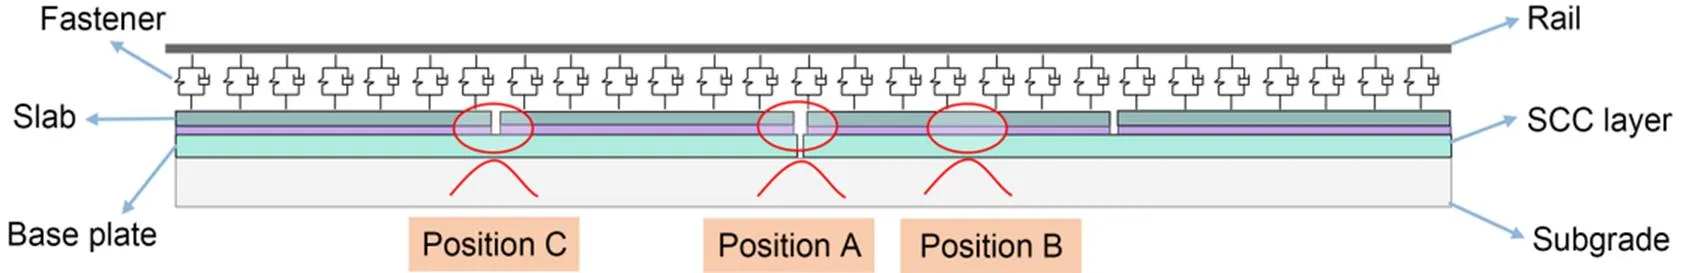
Fig. 6 Schematic diagram of different frost heave positions
In Fig. 7, the vertical displacement at the start and end of the frost heave on the subgrade's surface layer has a small abrupt change, which is due to the initial frost heave on the frost heave curve. At positions A and C, the peak deformation of the track slab is 6.3% and 6.8% greater than the subgrade frost heave amplitude, respectively. Also, the deformation follow-up is poor with the frost heave in contrast to the good follow-up between the rail deformation and frost heave. At position B, the deformation peak value of the track slab is close to the amplitude of the frost heave, and the displacement curves of the track slab and the frost heave do not overlap. The largest vertical displacement of the track slab (24.07 mm) is seen at position A. The ratio of frost heave amplitude of subgrade to vertical displacement of track slab is about 120.4%.
4.2 Influence of frost heave amplitude on deformation transfer
The frost heave amplitude directly affects the maximum vertical deformation of the track structure and the interlayer debonding. In this section, we describe the use of different frost heave amplitudes as input variables to explore their influence on deformation transfer. The frost heave wavelength was set as 20 m, and the frost heave amplitudes as 5, 10, 20, 30, and 40 mm. The maximum vertical displacements of the track structure under different frost heave amplitudes are shown in Fig. 8.
Fig. 8 shows that the vertical displacement of each track structure layer at different frost heave positions increases linearly with the frost heave amplitude, and the maximum rate of change is 16.8%. Position A shows a vertical displacement of the base plate of up to 46.7 mm. This position also sees the highest increase in the rate of displacement (1.18), while position B has a maximum base plate displacement of only 40.05 mm and the lowest increase in the rate of displacement.
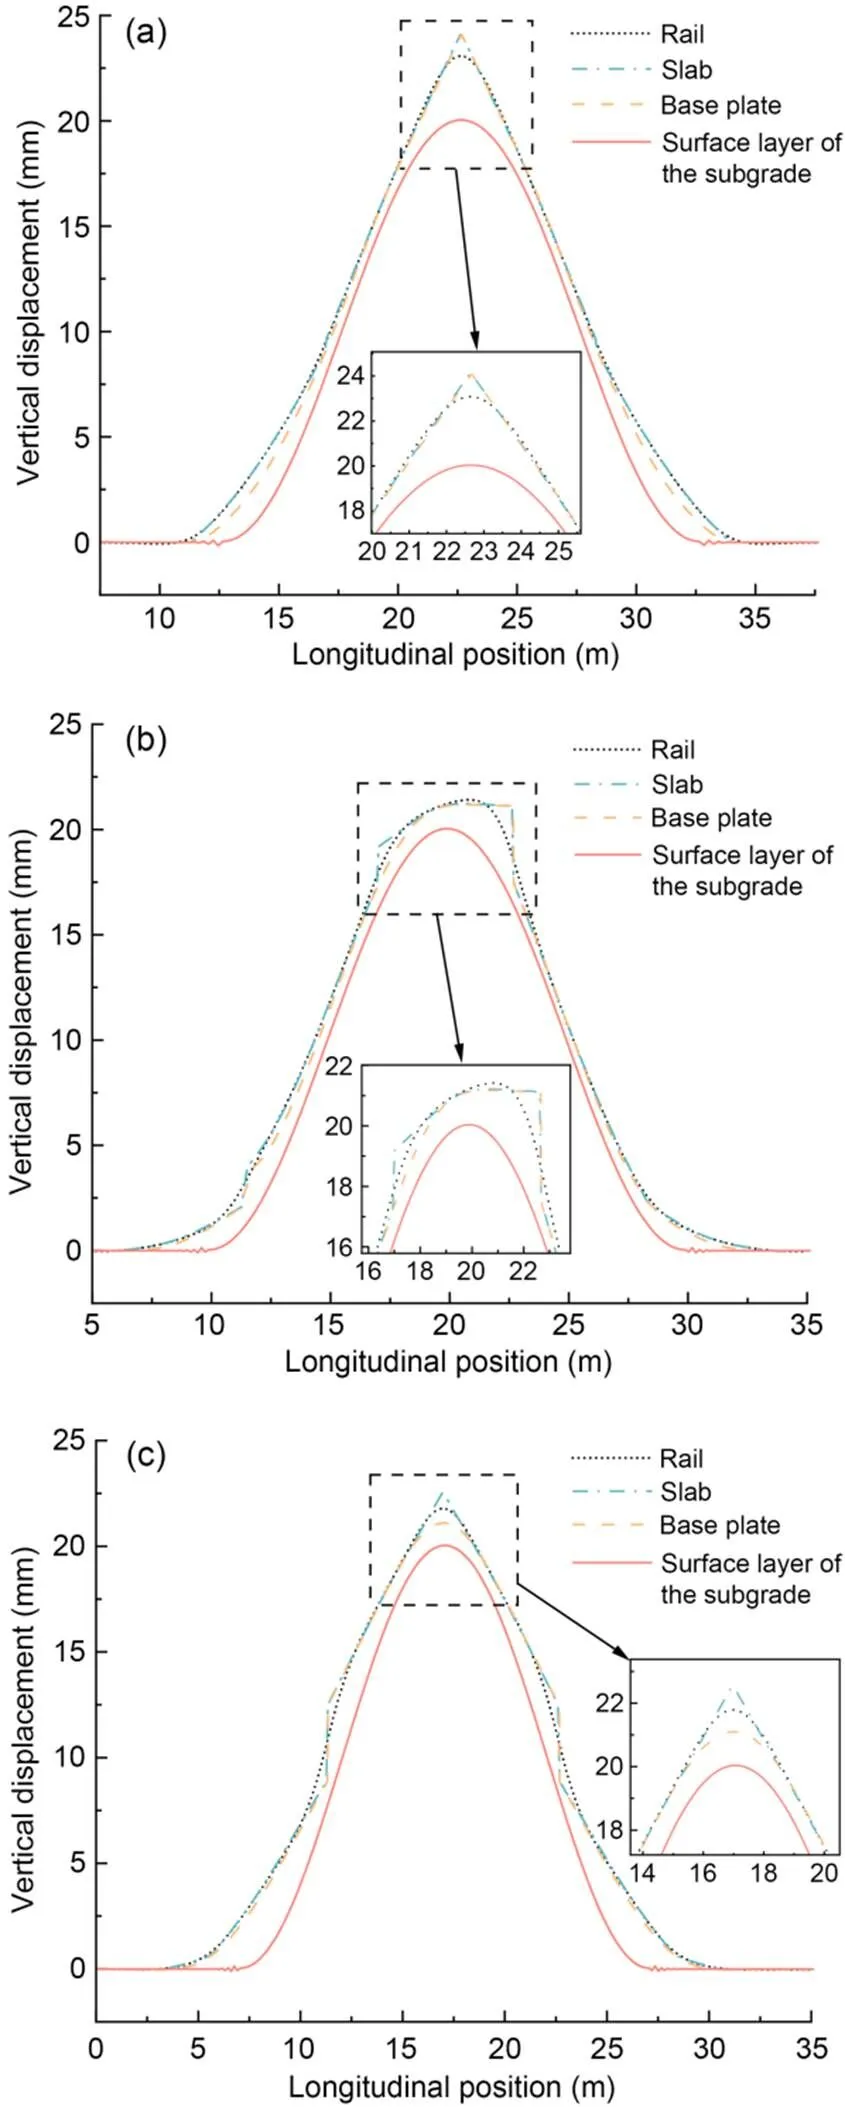
Fig. 7 Transfer of subgrade–base plate–slab–rail deformation at different frost heave positions: (a) position A; (b) position B; (c) position C
The amplitude of the frost heave has a bigger effect on the deformation of each layer structure than its position. The frost heave amplitude directly affects the maximum displacement of each structural layer in the deformation transfer. Exploring the maximum displacement change law in the transfer relation can provide a technical reference for track structure maintenance in target areas.
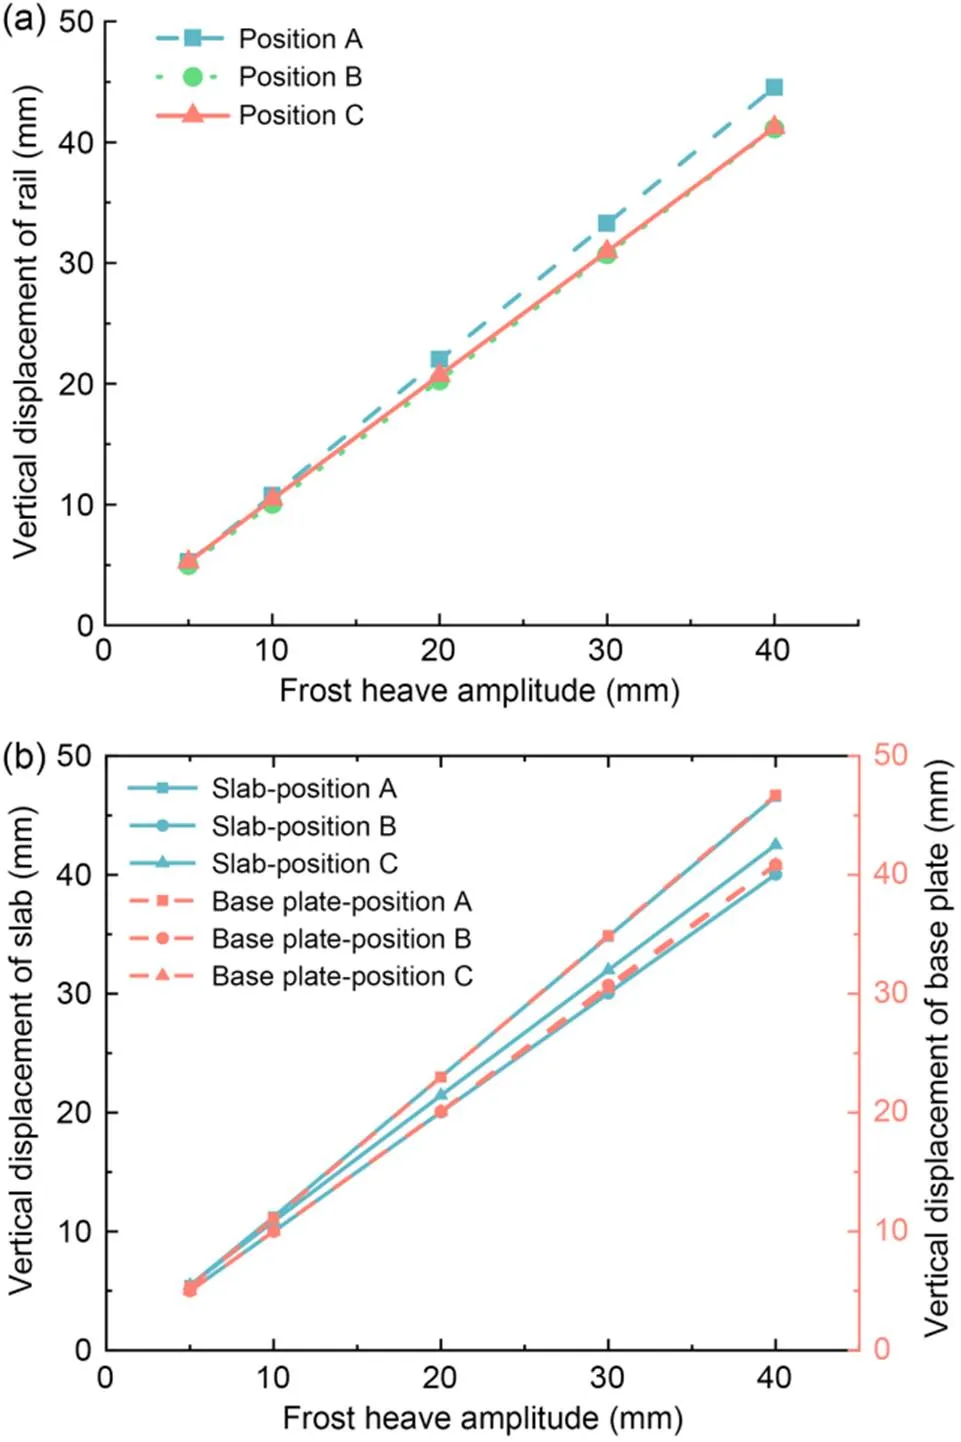
Fig. 8 Maximum vertical displacements of track structure under different amplitudes: (a) vertical displacement of rail; (b) vertical displacements of slab and base plate
The analysis in Section 3.1 suggests that the effect of frost heave on the vertical displacement of the track slab is the most significant when it occurs at position A. To further study the influence of frost heave amplitude on the deformation transfer relation of the subgrade–base plate–slab–rail system, we focused on the frost heave at position A at a wavelength of 20 m, and amplitudes of 20 and 40 mm. The deformation transfer relation is shown in Fig. 9.
For amplitudes of 20 or 40 mm, due to the non-uniformity of the frost heave and the fact that the upper structure poorly follows the subgrade to deform, the frost heave wave at the foot experiences large debonding. The deformation of the entire subgrade–base plate–slab–rail system shows better follow-up between different layers within 5 m before and after the frost heave peak, and debonding gradually decreases. At the peak of frost heave, the vertical displacement of the base plate mapped from bottom to top reaches the maximum. When the peak value of frost heave is 20 mm, the peak displacement of the base plate is 24.03 mm, and when the peak value of frost heave is 40 mm, the peak displacement of base plate is 47.94 mm. When the frost heave amplitude is 20 mm and 40 mm, the peak transmission of subgrade–rail displacement is 3.10 mm and 5.74 mm, respectively. This indicates that the increase of the frost heave amplitude corresponds to a larger vertical displacement transmission from the subgrade to the rail.
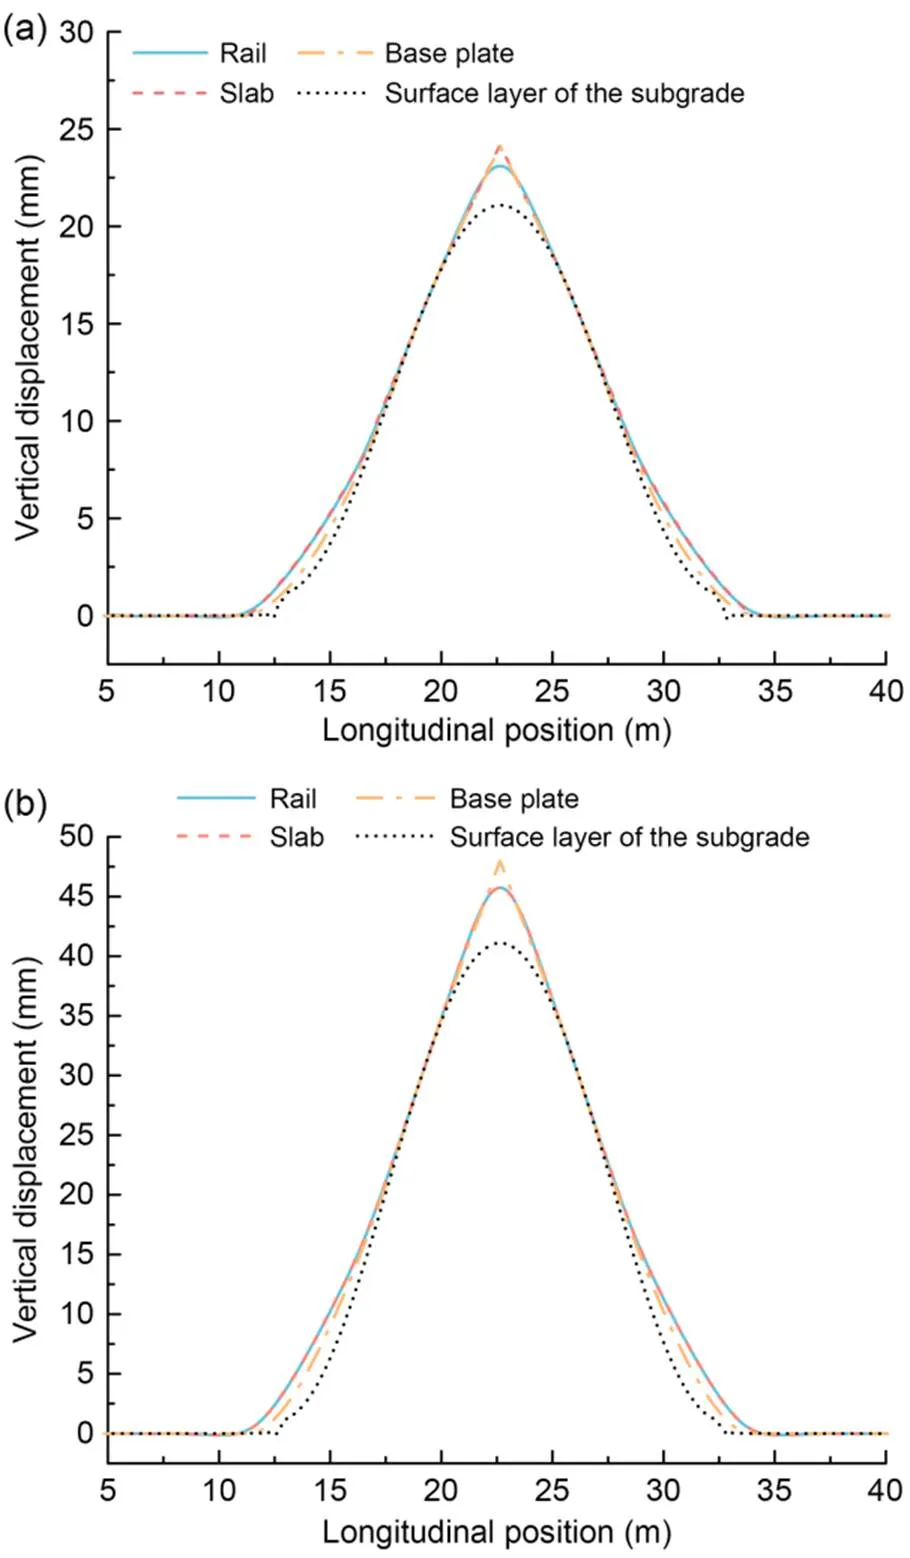
Fig. 9 Subgrade–base plate–slab–rail deformation transfer relation under different frost heave amplitudes: (a) frost heave amplitude of 20 mm; (b) frost heave amplitude of 40 mm
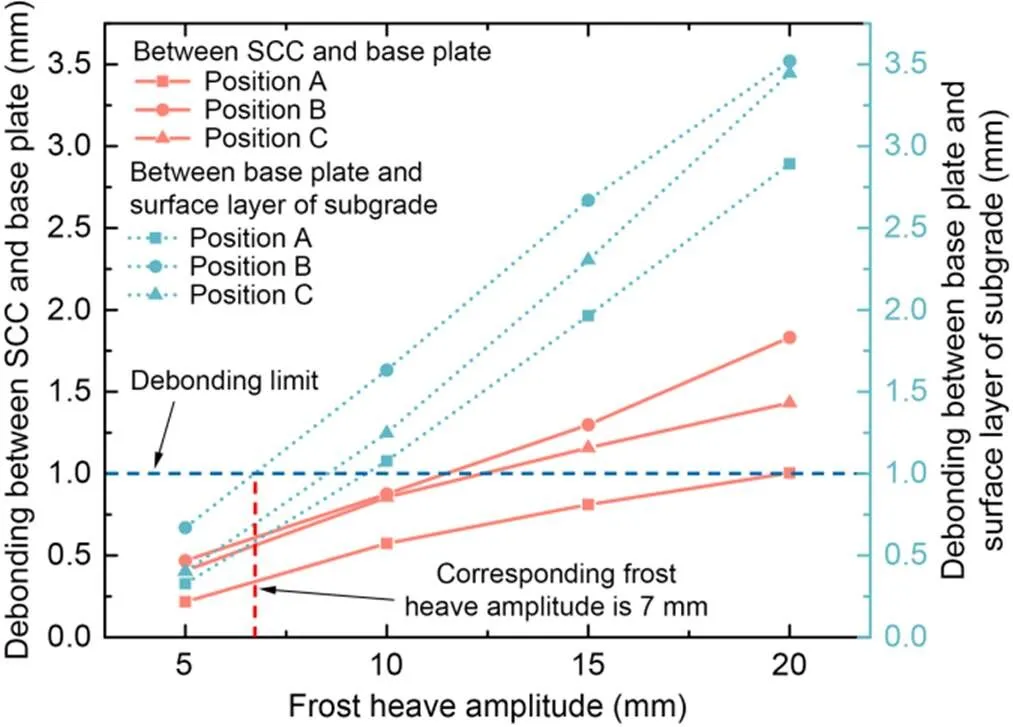
Fig. 10 Debonding between track structure layers
Fig. 10 shows the changes in the maximum debonding height between the SCC layer and the base plate and between the base plate and the surface layer of the subgrade. The debonding heights between the base plate and the surface layer of the subgrade and between the SCC layer and the base plate show a gradual but non-linear increase with the frost heave amplitude. The maximum debonding height between the base plate and subgrade surface layer is 3.52 mm, which is far larger than that between the SCC and base plate, regardless of loading conditions. The standard TG/GW 115–2012(MOR, 2012) stipulates that when the interlayer debonding height of a slab ballastless track is 1 mm or more, repair work should be performed. Therefore, when the subgrade frost heave wavelength is 20 m, to meet the requirement of the joint debonding limit, the subgrade frost heave amplitude should not exceed 7 mm.
4.3 Influence of frost heave wavelength on deformation transfer
The frost heave wavelength affects the area of track deformation transfer, and the longer the wavelength is, the greater the effect extends in the longitudinal direction of the line. To explore the effect of different frost heave wavelengths on subgrade–rail deformation transfer and interlayer debonding, we took the frost heave amplitude as 20 mm and analyzed the frost heave wavelengths of 10, 20, 30, and 40 m separately. The rail deformation curves under the different wavelengths are shown in Fig. 11.
Fig. 11 shows that at the same position, when the subgrade frost heave amplitude is constant, the smaller the frost heave wavelength, the greater the change rate of rail arching. When the subgrade frost heave peaks act on positions A and C, since the track structure is longitudinally symmetrical at the peaks, the vertical deformation of the rail is symmetrical. At position A, when the wavelength is 20 m, the vertical displacement of the rail reaches 22 mm, the largest difference from the deformation of the subgrade. In this case, there is debonding at the middle of the arch, which has a significant impact on the track structure and train operation. When the frost heave wavelength increases to 40 m, the arch deformation peak value point of the rail quickly approaches the subgrade deformation peak value point, and the deformation follow-up of the steel rail gradually stabilizes. At the same frost heave position, the increase in frost heave wavelength reduces the amplitude transferred to the rail, indicating the deformation follows better. The result shows that long-wave frost heave is more favorable than short-wave frost heave in terms of rail vertical deformation.

Fig. 11 Vertical displacement of rail under different frost heave wavelengths: (a) position A; (b) position B; (c) position C
Here, we introduce the wavelength transfer rate to illustrate the transfer relation between the wavelengths of subgrade frost heave and rail deformation. The wavelength transfer rates under different frost heave wavelengths are shown in Fig. 12. It shows that at any position, a certain amount of wavelengths of frost heave will be transferred to the rail, and a shorter frost heave wavelength causes a larger transfer rate. At positions A and B, when the wavelength is 10 m, the wavelength transfer rate to the rail is maximized to 180.5%, but the transfer rate at position C is only 82.65% of that at position A and 80.79% of that at position B. When the wavelength increases to 20 m, the transfer rates at positions A and B decrease rapidly, by 49.47% and 62.41%, respectively. The transfer rates then decrease slowly with the increase of frost heave wavelength, and most slowly at position C.

Fig. 12 Rail–subgrade wavelength transfer rate
Different wavelengths of frost heave cause variable degrees of propagation in the deformation wavelength of track layers and have different impacts on interlayer debonding. In Fig. 13, the debonding between the base plate and the subgrade reaches a maximum height of 12.64 mm at 10 m wavelength, and declines non-linearly with the increasing wavelength. At any frost heave wavelength, the debonding between the base plate and the subgrade is always far greater than that between the SCC layer and the base plate, with the former recording up to 6.3 times more than the latter. This is due to the better bonding and thus better follow-up between the SCC layer and the base plate. In addition, interlayer debonding is more sensitive at a wavelength of 20 m. When the wavelength changes from 10 m to 20 m, the debonding decreases sharply, with a maximum drop of 72%. Once it exceeds 20 m, the debonding height tends to stabilize.
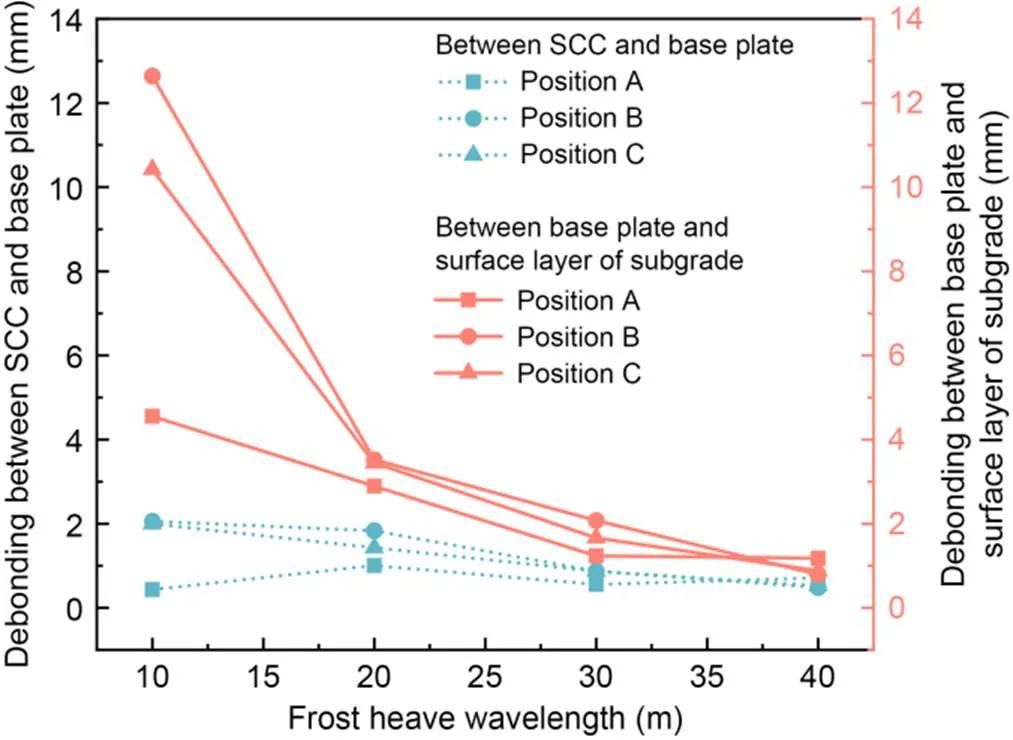
Fig. 13 Debonding between track structure layers at different wavelengths
5 Vehicle–track–subgrade frost heave spatial coupling finite element model
The stability and safety of vehicle operation are evaluated mainly through dynamic response indices, such as the vertical acceleration of the vehicle body and wheel–rail force. To explore the influence of frost heave on the running state of the vehicle body, a vehicle–track–subgrade frost heave spatial coupling finite element model was established. The deformation results of the static track–subgrade frost heave spatial coupling model are used as initial conditions and imported into the vehicle–track–subgrade frost heave model. Then, the vertical acceleration of the vehicle body and the wheel–rail force at the time when the vehicle passes through the frost heave ground can be obtained through finite element calculation.

Fig. 14 Vehicle–track–subgrade spatial coupling dynamic finite element model. f is the frost heave peak value; L is the wavelength
5.1 Vehicle model and parameters
Based on vehicle–track coupling dynamics and the finite element method, a coupled dynamic model of the vehicle–track–subgrade frost heave system was established (Fig. 14). To reduce calculation workloads, we made the following assumptions: the vehicle is regarded as a rigid body and is thus impervious to elastic deformation across the body, bogie, and wheelset; spring damping is seen as linear; all masses and moments of inertia are concentrated on the vehicle body, bogie, and wheelset; the vertical stop of the axle box spring and the transverse stop of the bogie were not considered. We considered the vertical vibration of the vehicle and set 10 degrees of freedom for each vehicle, including six degrees of freedom (vertical and pitch motion) for the vehicle body and the front and rear bogies, and four degrees of freedom (vertical motion) for the wheelset (Sharma et al., 2021). An electric multiple unit (EMU) (Chen et al., 2015) of the CRH380 high-speed train series in China was used for dynamics calculation. The main parameters of the vehicle are shown in Table 2 (Guo, 2017). The vehicle body, bogie, and wheelset were all set as analytical rigid. Line features were created with spring and damping attributes to simulate the primary suspension and secondary suspension systems. Full constraints were used at the bottom of the embankment, and the longitudinal degrees of freedom of the slab were restrained. The overall length of the model was 200 m and the total number of elements 206833.

Table 2 CRH380 EMU parameters for calculation
The dynamic equation for the vehicle system can be denoted by Eq. (2) (Zhai et al., 1996):
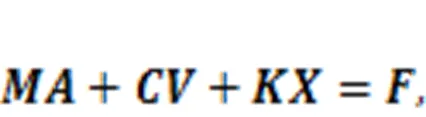
where,, andis the mass, damping, and rigid matrices of the vehicle subroutine, and,, andis the displacement, velocity, and acceleration variables, respectively, andis the load of the system.
5.2 Wheel–rail contact model
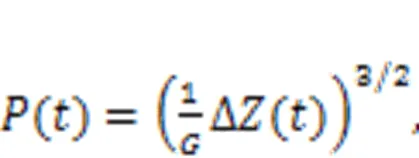
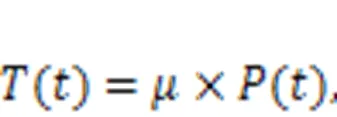
Wheel–rail contact is a structural rolling contact with the same elasticity, and the wheel–rail contact forces are mainly normal contact forces and creep–slip forces (Kalker, 1991). The contact mode in the normal direction is mainly Hertzian contact, while the contact mode in the tangential direction includes mainly linear creep–slip and non-linear creep–slip relationships. In this study, we used the Hertz elastic contact simulation (Zhai and Sun, 1994) in which the force is:
With wheel–rail contact and the coupling of the slab track and subgrade considered, the vehicle, track, and subgrade are coupled into one dynamic model. Compared with other dynamic models, this model fully considers the displacement of track layers and interlayer debonding under the initial frost heave, and the non-linear contact relationship between different track layers. In addition, this dynamic can incorporate the results of the static model, reducing calculation.
Validation of the kinetic model is provided in Section S3 of the ESM, including the comparison of the model results with the relevant literature and measured data.
6 Influence of subgrade frost heave on the dynamic response of a vehicle
The uneven frost heave deformation of the subgrade aggravates the dynamic interaction between the wheel and rail, impacting driving safety and ride comfort. In addition, it causes the track structure to vibrate, which affects the long-term service performance of the track. In this section, we describe how the vehicle–track–subgrade frost heave spatial coupling dynamic model was used to explore the influence of subgrade frost heave on the vehicle dynamic response.
6.1 Dynamic response at different frost heave wavelengths
To explore the influence of different frost heave wavelengths on vehicle dynamic response, the Fourier series frost heave waveform was taken as the input condition of the track–subgrade spatial coupling static model to calculate the initial deformation of the track structure. The results were then imported into the vehicle–track–subgrade spatial coupling dynamic model. The amplitude was 20 mm, the frost heave wavelength 10, 20, 30, or 40 m, and the vehicle speed 300 km/h. The time-history curve of the vertical acceleration of the vehicle body is shown in Fig. 15.
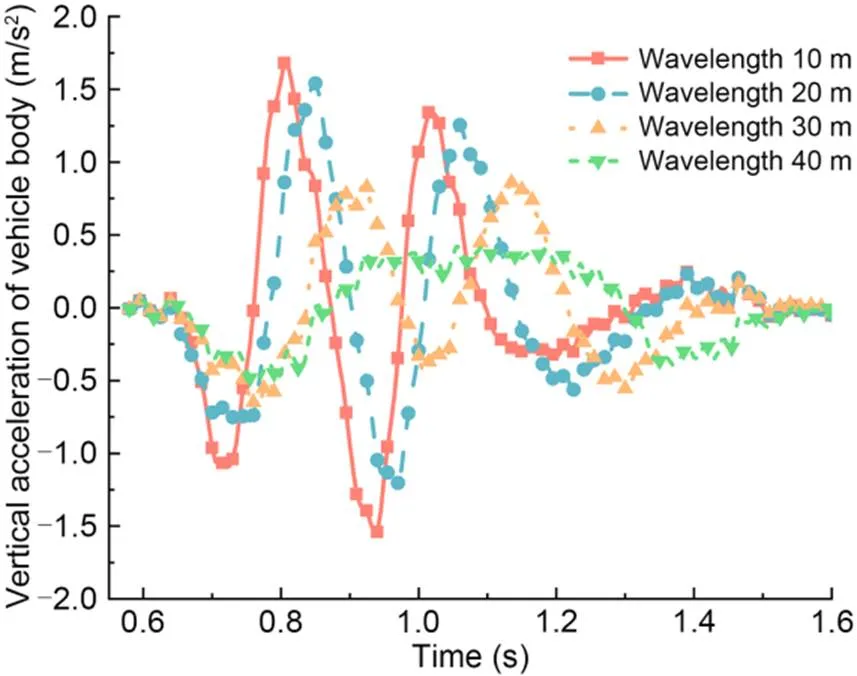
Fig. 15 Time-history curves of vertical acceleration of the vehicle body at different frost heave wavelengths
Fig. 15 shows that the maximum vertical acceleration of the vehicle body at 10, 20, 30, and 40 m frost heave wavelengths is 1.68, 1.54, 0.86, and 0.49 m/s2, respectively. When the vehicle passes through the frost heave area, the peak value of the vertical acceleration decreases as the frost heave wavelength increases. When the wavelength increases from 10 to 20 m, the maximum vertical acceleration decreases by 8.3%. From 20 to 30 m the maximum vertical acceleration decreases by 44.2%, and from 30 to 40 m drops by 43.0%. When the frost heave wavelength is less than or equal to 20 m, the maximum vertical acceleration of the vehicle body exceeds the daily management threshold of 0.15(is the gravitational acceleration) (Hasan, 2014). When the frost heave amplitude is 20 mm and the frost heave wavelength is greater than 30 m, the vertical acceleration of the vehicle body meets the daily management threshold.
The aforementioned change law of vertical acceleration was analyzed in terms of the time domain. The power spectrum was used to explore the change law of vertical acceleration for the vehicle body under different frost heave wavelengths in the frequency domain. The change in the power spectral density (PSD) is shown in Fig. 16.
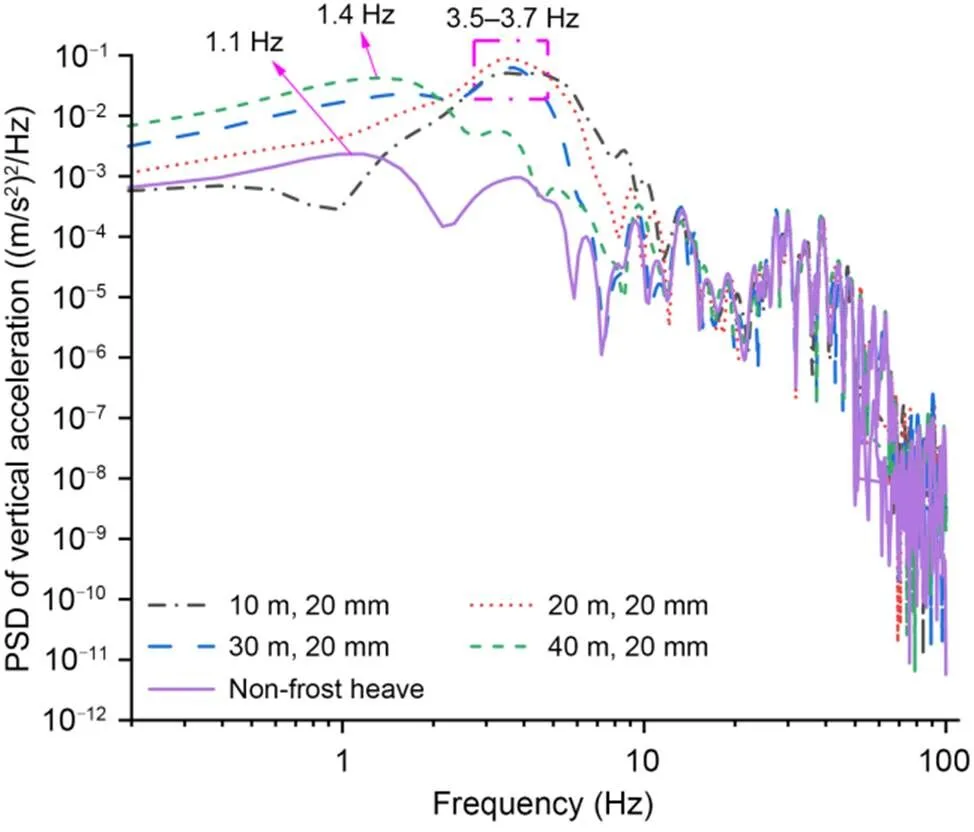
Fig. 16 PSD curves of vertical acceleration at different frost heave wavelengths
At a frost heave amplitude of 20 mm and wavelength of 20 m, the PSD peak value of the vehicle body vertical acceleration is greater than those at frost heave wavelengths of 10, 30, and 40 m. When the subgrade frost heave wavelength is 10, 20, or 30 m, the peak value of the vertical acceleration power spectrum of the vehicle body is concentrated between 3.5 and 3.7 Hz. However, when the subgrade frost heave wavelength was set at 40 m, the main frequency of the vehicle body acceleration is 1.4 Hz, which is close to the main frequency of the vertical acceleration of the vehicle body in the non-frost heave area, with a difference of only 0.3 Hz. From this, we ascertained that with increasing frost heave wavelength, the main frequency of the vertical acceleration of the vehicle body will gradually change from 3–4 Hz to around 1 Hz. Since 1 Hz is the natural dominant frequency of the vertical acceleration of the vehicle body, the result shows that a greater frost heave wavelength produces a smaller impact on the vertical acceleration of the vehicle body.
To explore the influence of subgrade frost heave wavelength on the vertical wheel–rail force, we studied the first wheelset of the vehicle body. A frost heave amplitude of 20 mm and wavelengths of 10, 20, 30, and 40 m were taken. The time history curves of the left and right wheels are shown in Fig. 17.

Fig. 17 Time-history curves of wheel–rail force at different frost heave wavelengths: (a) wavelength of 10 m; (b) wavelength of 20 m; (c) wavelength of 30 m; (d) wavelength of 40 m
Under the same frost heave amplitude, the maximum vertical wheel–rail force appears between 0.6 and 0.7 s, regardless of the corresponding wavelength. This can be accounted for by the time-history curve. In the period from 0.6 to 0.7 s, the vertical acceleration of the vehicle body is in the upward direction and reaches its peak value. At this time, the vehicle enters the frost heave area, and the front bogie reaches the position of the frost heave trough, so the first wheelset experiences the peak vertical wheel–rail force. The minimum value of vertical wheel–rail force appears between 0.7 and 0.8 s, 0.8 and 0.9 s, 0.9 and 1.0 s, and 0.9 and 1.0 s at frost heave wavelengths of 10, 20, 30, and 40 m, respectively. Comparing the time periods corresponding to the minimum force with the time history curve of vertical acceleration shows that the minimum values of the vertical wheel–rail force all appear in the time period when the vertical acceleration reaches its negative peak, indicating that the front bogie has reached the frost heave peak position. Further, analysis shows the peak value with the frost heave wavelength of 20 m is the largest, and the minimum value at this wavelength is the smallest, indicating the greatest range of wheel–rail force change. In conclusion, when considering the influence of the wheel–rail force on the track structure, the focus should center on the frost heave wavelength of 20 m.
6.2 Dynamic response at different frost heave amplitudes
The previous sections showed that a frost heave wavelength of 20 m produces greater vertical wheel–rail force and spectral density than other wavelengths. To determine the most unfavorable conditions and analyze the influence of frost heave amplitude on the dynamic response of the wheel–rail system, we set the frost heave wavelength as 20 m, amplitudes as 10, 20, 30, and 40 mm, and vehicle speed as 300 km/h. The time-history curves of vehicle body vertical acceleration under different amplitudes are shown in Fig. 18.
At a frost heave wavelength of 20 m, the peak vertical acceleration of the vehicle body is 0.80, 1.54, 2.29, and 3.16 m/s2when the amplitude is 10, 20, 30, and 40 mm, respectively. When the amplitude increases from 10 to 20 mm, 20 to 30 mm, and 30 to 40 mm, the peak acceleration increases by 92.5%, 48.7%, and 38.0%, respectively. Such growth is not linear and gradually slows down. From 10 to 40 mm, the vertical acceleration always peaks when the front and rear bogies simultaneously pass through the frost heave position. At that moment, both the front and the rear bogies are located near the frost heave peak, and their centripetal force is downward, resulting in the superposition of their dynamic responses.
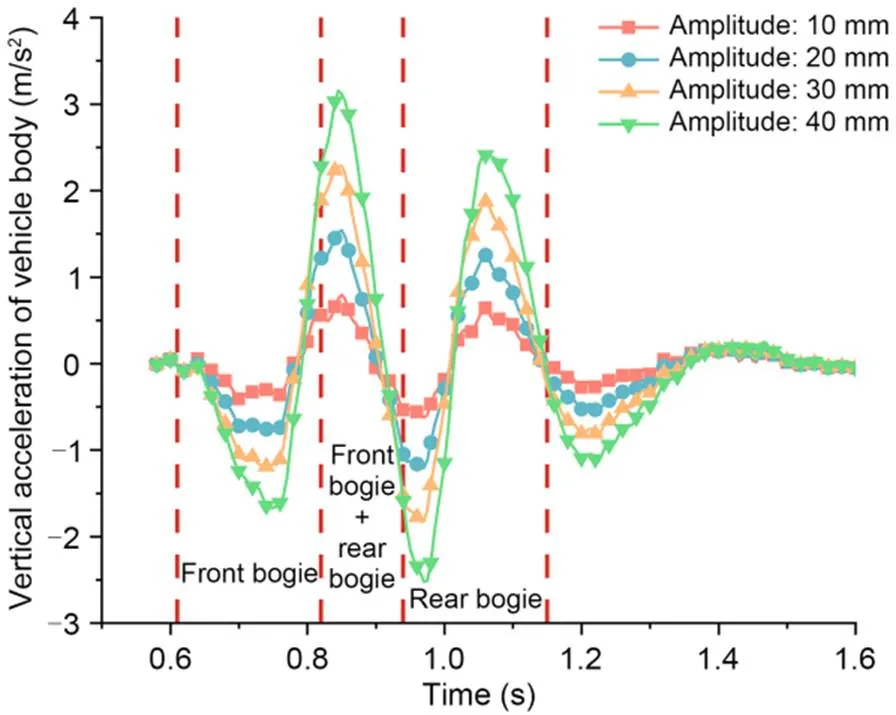
Fig. 18 Time-history curves of vertical acceleration with different frost heave amplitudes

Fig. 19 Time-history curves of vertical wheel–rail force with different frost heave amplitudes: (a) amplitude of 10 mm; (b) amplitude of 20 mm; (c) amplitude of 30 mm; (d) amplitude of 40 mm
Comparing Fig. 15 with Fig. 18 shows that a short frost heave wavelength (10 or 20 m) produces a time lag between the front and rear bogies passing through the peak and trough, which causes the superposition effect of the vehicle body acceleration. At 30 m wavelength, superposition is weaker, and the peak value of the vertical acceleration appears when the rear bogie passes through the frost heave area. At 40 m wavelength, the front and rear bogies could be treated as a single entity because the distance between them is far smaller than the frost heave wavelength, and there is no obvious interaction between them.
The time-history curves of the vertical wheel–rail force under different frost heave amplitudes are shown in Fig. 19. When the frost heave amplitude is 10 or 20 mm, the vertical wheel–rail force of the vehicle body reaches its peak value from 0.6 to 0.7 s. When at 30 or 40 mm amplitude, the peak value of the vertical wheel–rail force appears from 0.7 to 0.8 s. Whether the peak value occurs between 0.6 and 0.7 s or between 0.7 and 0.8 s, the two periods are when the front bogie passes through the frost heave zone. At a frost heave wavelength of 20 m, the maximum values of the vertical wheel–rail force are 115, 116, 126, and 134 kN corresponding to the frost heave amplitudes of 10, 20, 30, and 40 mm, respectively, showing an increasing trend and a total increase of about 16.5%. Short-wave and large-amplitude frost heave has a greater impact on the dynamics of the wheel and rail. Therefore, in areas with large frost heave amplitudes, it is important to limit the running speed of trains and strengthen daily management to minimize the frost heave effect and thereby extend the service life of the track structure.
7 Conclusions
The sensitivities of the track structure components to the frost heave position and wavelength are clarified in this paper. We propose that when the frost heave wavelength is 20 m, to meet the limit requirements of the debonding, the limit value of the frost heave amplitude is 7 mm. This can provide a theoretical basis for the prevention of subgrade frost damage and the maintenance of track structure. Additionally, the significance of the effects of frost heave wavelength and amplitude on the vehicle body vibration acceleration and wheel–rail force was explored from the time domain and frequency domain. We recommend that when the frost heave wavelength is in the range of 10–20 m and the train speed is 300 km/h, the train speed should be reduced to avoid the vertical acceleration of the vehicle body exceeding 0.15. This provides a reference for the evaluation of the smoothness and comfort of a ballastless track. The conclusions are as follows:
1. The position of frost heave greatly influences the arch deformation and debonding height. In terms of the arch deformation, the most unfavorable position is near the joint of the base plate, where we recorded a maximum vertical displacement of 24.07 mm for the track slab when the frost heave amplitude was 20 mm—an amplitude transfer rate of 120.4%. In terms of interlayer debonding, the most unfavorable position is near the middle of the track slab.
2. The maximum displacement of each layer of the track structure increases with the frost heave amplitude, and changes nearly linearly, with a maximum increase of 16.8%. The maximum wavelength transfer rate from subgrade to rail is 180.5%. With the same amplitude, long-wave frost heave has less impact on the track structure and causes less debonding than short-wave frost heave. The rail deformation obtained from transfer can be used directly as the initial condition for subsequent research on track irregularity and vehicle dynamic response.
3. A greater frost heave wavelength corresponds to a smaller impact of frost heave on the vertical acceleration of the vehicle body. In the wavelength range from 10 to 30 m, the vertical acceleration of the vehicle body presents double-peak fluctuations, and the main frequency of the acceleration PSD is concentrated between 3.5 and 3.7 Hz. When the frost heave wavelength is greater than or equal to 40 m, there is no double-peak phenomenon in the vertical acceleration of the vehicle body, and the main frequency of the PSD is 1.4 Hz.
4. Given a fixed frost heave wavelength, the vertical acceleration of the vehicle body increases nonlinearly along with the increase of the frost heave amplitude, and the increase gradually slows down. At any frost heave wavelength, the maximum vertical wheel–rail force is recorded when the front bogie passes through the frost heave zone. The peak value of the wheel–rail force increases as the frost heave amplitude increases from 10 to 40 mm, and the maximum increase (16.5%) is recorded at a frost heave wavelength of 20 m. Frost heave with short wavelengths and large amplitudes noticeably intensifies the dynamic interaction between the wheel and rail. In frost heave areas with wavelengths less than 20 m and amplitudes greater than 20 mm, the running speed of trains should be limited and daily maintenance should be strengthened.
This work is supported by the National Key R&D Program of China (No. 2021YFF0502100), the National Natural Science Foundation of China (Nos. 52022085 and 52278461), the Sichuan Provincial Youth Science and Technology Innovation Team (No. 2022JDTD0015), and the Research and Development Program of China State Railway Group Co., Ltd. (No. N2022G033), China.
Juanjuan REN: Conceptualization. Junhong DU: Writing–original draft. Kaiyao ZHANG: Writing–review & editing. Bin YAN: Writing–review & editing. Jincheng TIAN: Writing–review & editing.
Juanjuan REN, Junhong DU, Kaiyao ZHANG, Bin YAN, and Jincheng TIAN declare that they have no known competing financial interests or personal relationships that could have appeared to influence the work reported in this paper.
Auersch L, 2015. Excitation of ground vibration due to the passage of trains over a track with trackbed irregularities and a varying support stiffness., 53(1):1-29. https://doi.org/10.1080/00423114.2014.968173
Cai XP, Liang YK, Xin T, et al., 2019. Assessing the effects of subgrade frost heave on vehicle dynamic behaviors on high-speed railway., 158:95-105. https://doi.org/10.1016/j.coldregions.2018.11.009
Cai XP, Zhang Q, Zhang YR, et al., 2021. Deformation law and control limit of CRTSIII slab track under subgrade frost heave., 11(8):3520. https://doi.org/10.3390/app11083520
Chen ZW, Zhai WM, Cai CB, et al., 2015. Safety threshold of high-speed railway pier settlement based on train-track-bridge dynamic interaction., 58(2):202-210. https://doi.org/10.1007/s11431-014-5692-0
Gao L, Zhao WQ, Hou BW, et al., 2020. Analysis of influencing mechanism of subgrade frost heave on vehicle-track dynamic system., 10(22):8097. https://doi.org/10.3390/app10228097
Gou HY, Ran ZW, Yang LC, et al., 2019. Mapping vertical bridge deformations to track geometry for high-speed railway., 32(4):467-478. https://doi.org/10.12989/scs.2019.32.4.467
Guo LW, 2017. Study on Dynamic Behavior of Vehicle-Slab Track System under the Subgrade Frost Heaving in Cold Region. MS Thesis, Beijing Jiaotong University, Beijing, China (in Chinese).
Hasan N, 2014. Maximum curving speed., 140(4):04013023. https://doi.org/10.1061/(ASCE)TE.1943-5436.0000648
Hunt H, 2005. Modelling of rail roughness for the evaluation of vibration-isolation measures. Proceedings of the 12th International Congress on Sound and Vibration, p.11-14.
Hunt HEM, 2007. Types of rail roughness and the selection of vibration isolation measures. Proceedings of the 9th International Workshop on Railway Noise, p.341-347. https://doi.org/10.1007/978-3-540-74893-9_48
Hwang SH, Kim S, Lee KC, et al., 2018. Effects of long-wavelength track irregularities due to thermal deformations of railway bridge on dynamic response of running train., 8(12):2549. https://doi.org/10.3390/app8122549
Jiang HG, Li XL, Xin GF, et al., 2019. Geometry mapping and additional stresses of ballastless track structure caused by subgrade differential settlement under self-weight loads in high-speed railways., 18:103-110. https://doi.org/10.1016/j.trgeo.2018.10.007
Jiang HG, Li YX, Wang YJ, et al., 2022. Dynamic performance evaluation of ballastless track in high-speed railways under subgrade differential settlement., 33:100721. https://doi.org/10.1016/j.trgeo.2022.100721
Kalker JJ, 1991. Wheel-rail rolling contact theory., 144(1-2):243-261. https://doi.org/10.1016/0043-1648(91)90018-P
Lin ZJ, Niu FJ, Li XL, et al., 2018. Characteristics and controlling factors of frost heave in high-speed railway subgrade, Northwest China., 153:33-44. https://doi.org/10.1016/j.coldregions.2018.05.001
Luo B, Lai H, Ishikawa T, et al., 2017. Frost heave analysis of ballasted track above box culvert and its influence on train vibration., 9(3):229-235. https://doi.org/10.3724/SP.J.1226.2017.00229
Ma FX, Xi RJ, Xu N, 2016. Analysis of railway subgrade frost heave deformation based on GPS., 7(2):143-147. https://doi.org/10.1016/j.geog.2016.04.001
MOR (Ministry of Railways of the People’s Republic of China), 2012. Maintenance Rules for Ballastless Track Lines of High-Speed Railway (Trial Implementation), TG/GW 115–2012. National Standards of the People’s Republic of China (in Chinese).
Niu FJ, Zheng H, Li AY, 2020. The study of frost heave mechanism of high-speed railway foundation by field-monitored data and indoor verification experiment., 15(3):581-593. https://doi.org/10.1007/s11440-018-0740-8
Paixão A, Fortunato E, Calçada R, 2015. The effect of differential settlements on the dynamic response of the train–track system: a numerical study., 88:216-224. https://doi.org/10.1016/j.engstruct.2015.01.044
Polach O, 1999. A fast wheel-rail forces calculation computer code., 33(sup1):728-739. https://doi.org/10.1080/00423114.1999.12063125
Ren JJ, Zhang KY, Zheng JL, et al., 2022. Railway subgrade thermal-hydro-mechanical behavior and track irregularity under the sunny-shady slopes effect in seasonal frozen regions., 29(11):3793-3810. https://doi.org/10.1007/s11771-022-5189-0
Ren JJ, Zhang Q, Zhang YC, et al., 2023a. Evaluation of slab track quality indices based on entropy weight-fuzzy analytic hierarchy process., 149:107244. https://doi.org/10.1016/j.engfailanal.2023.107244
Ren JJ, Liu W, Du W, et al., 2023b. Identification method for subgrade settlement of ballastless track based on vehicle vibration signals and machine learning., 369:130573. https://doi.org/10.1016/j.conbuildmat.2023.130573
Sharma SK, Sharma RC, Lee J, 2021. Effect of rail vehicle–track coupled dynamics on fatigue failure of coil spring in a suspension system., 11(6):2650. https://doi.org/10.3390/app11062650
Sufaat M, Awaludin A, Satyarno I, et al., 2022. Finite element analysis of CRTS III slab track model. Proceedings of the 5th International Conference on Sustainable Civil Engineering Structures and Construction Materials, p.17-31. https://doi.org/10.1007/978-981-16-7924-7_2
Wang QZ, Tai BW, Liu ZY, et al., 2015. Study on the sunny-shady slope effect on the subgrade of a high-speed railway in a seasonal frozen region., 7(5):513-519. https://doi.org/10.3724/SP.J.1226.2015.00513
Wang ZC, Song Y, Wang JX, 2014. Relation between track irregularity of speed-increased railway and dynamic speed limits through simulation., 8:197-200. https://doi.org/10.2174/1874155X01408010197
Wu XY, Niu FJ, Lin ZJ, et al., 2018. Delamination frost heave in embankment of high speed railway in high altitude and seasonal frozen region., 153:25-32. https://doi.org/10.1016/j.coldregions.2018.04.017
Ye QZ, Luo Q, Feng GS, et al., 2023. Stress distribution in roadbeds of slab tracks with longitudinal discontinuities., 31(1):61-74. https://doi.org/10.1007/s40534-022-00287-w
Ye WL, Ren JJ, Zhang AA, et al., 2023. Automatic pixel-level crack detection with multi-scale feature fusion for slab tracks., 38(18):2648-2665. https://doi.org/10.1111/mice.12984
Zeng ZP, Xiao YC, Wang WD, et al., 2022. Research on dynamic performance of CRTSIII type slab ballastless track under long-term service., 15(6):2033. https://doi.org/10.3390/ma15062033
Zhai WM, Sun X, 1994. A detailed model for investigating vertical interaction between railway vehicle and track., 23(sup1):603-615. https://doi.org/10.1080/00423119308969544
Zhai WM, Cai CB, Guo SZ, 1996. Coupling model of vertical and lateral vehicle/track interactions., 26(1):61-79. https://doi.org/10.1080/00423119608969302
Zhang S, Sheng DC, Zhao GT, et al., 2016. Analysis of frost heave mechanisms in a high-speed railway embankment., 53(3):520-529. https://doi.org/10.1139/cgj-2014-0456
Zhang Y, Sun B, Li P, et al., 2020. Analysis of deformation and temperature characteristics of high-speed railway roadbed in seasonal frozen regions., 57(5):384-393. https://doi.org/10.1007/s11204-020-09682-z
Zhang YZ, Du YL, Sun BC, 2015. Temperature distribution analysis of high-speed railway roadbed in seasonally frozen regions based on empirical model., 114:61-72. https://doi.org/10.1016/j.coldregions.2015.02.010
Zhou WB, Nie LX, Jiang LZ, et al., 2020. Mapping relation between pier settlement and rail deformation of unit slab track system., 27:1066-1074. https://doi.org/10.1016/j.istruc.2020.07.023
Electronic supplementary materials
Sections S1–S3
季冻区路基冻胀与无砟轨道变形的映射关系及车辆动力响应
任娟娟1,2,杜俊宏1,2,章恺尧1,2,闫斌3,田晋丞4
1西南交通大学,高速铁路线路工程教育部重点实验室,中国成都,610031;2西南交通大学,土木工程学院,中国成都,610031;3中南大学,土木工程学院,中国长沙,410075;4中国电建集团昆明勘测设计研究院有限公司,机场工程所,中国昆明,650051
季冻区路基冻胀对高速列车运行的安全性和舒适性以及轨道结构的服役性能具有较大影响。基于实测数据,本文旨在建立轨道-路基冻胀空间耦合静力学模型和车辆-轨道-路基冻胀空间耦合动力学模型,并采用傅里叶级数进行冻胀波形拟合,进一步探究季冻区高速铁路路基冻胀与轨道结构变形映射关系、层间离缝特征及路基冻胀对车辆动力响应的影响,以期为季节性冻土路基冻胀问题的防治及研究提供依据。
1. 采用傅立叶级数对实测数据进行拟合,并将其作为有限元模型的输入边界条件;2. 提出将静力模型的计算结果作为动力模型初始条件的计算方法,简化计算过程,提高计算效率;3. 从时域和频域探讨路基冻胀波长和幅值对车体振动加速度和轮轨力的影响。
1. 采用傅立叶级数对现场实测数据进行拟合,并将其作为有限元模型的输入边界条件(公式(4));2. 通过建立路基冻胀-无砟轨道结构静力与动力模型,分析轨道结构层变形映射关系及车辆动力响应。
1. 冻胀位置对轨道垂向上拱变形及层间离缝影响较大;2. 轨道结构各层最大垂向变形随冻胀幅值的增大而增大,且几乎呈线性变化;3. 路基冻胀波长越大,对车体垂直加速度的影响越小;4. 当冻胀波长一定时,车体垂向加速度随冻胀幅值的增加呈非线性增加,且增加幅度逐渐变小。
无砟轨道;路基冻胀;映射关系;车辆-轨道-路基耦合;动力响应
https://doi.org/10.1631/jzus.A2300303
https://doi.org/10.1631/jzus.A2300303
Received June 7, 2023;
Revision accepted Sept. 24, 2023;
Crosschecked Dec. 5, 2023
© Zhejiang University Press 2024
猜你喜欢
杂志排行

Journal of Zhejiang University-Science A(Applied Physics & Engineering)的其它文章
- Influence of ground effect on flow field structure and aerodynamic noise of high-speed trains
- Constitutive modelling of concrete material subjected to low-velocity projectile impact: insights into damage mechanism and target resistance
- Effect of coral sand on the mechanical properties and hydration mechanism of magnesium potassium phosphate cement mortar
- Stress relaxation properties of calcium silicate hydrate: a molecular dynamics study