Annual growth of Fagus orientalis is limited by spring drought conditions in Iran’s Golestan Province
2024-01-26KhalilGhorbaniJahangirMohammadiLalehRezaeiGhaleh
Khalil Ghorbani · Jahangir Mohammadi ·Laleh Rezaei Ghaleh
Abstract Due to the lack of a uniform and accurate definition of ‘drought’,several indicators have been introduced based on different variables and methods,and the efficiency of each of these is determined according to their relationship with drought.The relationship between two drought indices,SPI (standardized precipitation index) and SPEI (standardized precipitation-evapotranspiration index) in different seasons was investigated using annual rings of 15 tree samples to determine the effect of drought on the growth of oriental beech (Fagus orientalis Lipsky) in the Hyrcanian forests of northern Iran.The different evapotranspiration calculation methods were evaluated on SPEI efficiency based on Hargreaves-Samani,Thornthwaite,and Penman–Monteith methods using the step-by-step M5 decision tree regression method.The results show that SPEI based on the Penman–Monteith in a three-month time scale (spring) had similar temporal changes and a better relationship with annual tree rings (R2=0.81) at a 0.05 significant level.Abrupt change and a decreasing trend in the time series of annual tree rings are similar to the variation in the SPEI based on the Penman–Monteith method.Factors affecting evapotranspiration,temperature,wind speed,and sunshine hours (used in the Penman–Monteith method),increased but precipitation decreased.Using non-linear modeling methods,SPEI based on Penman–Monteith best illustrated climate changes affecting tree growth.
Keywords Climate change · Drought index · Hyrcanian forests · SPEI · Annual growth rings · Fagus orientalis
Introduction
According to the Intergovernmental Panel on Climate Change (IPCC),intense and longer periods of droughts have been observed worldwide during the twentieth century,which are linked to higher temperatures and decreased precipitation (IPCC 2007).Global assessments have shown that future climate change will significantly impact forest productivity and growth (Pederson et al.2014;Frelich et al.2015).
The relationship between drought and radial growth is important from two perspectives,one is the reconstruction and duration of past events,and the other is predicting the effect of climate change on the future growth of forest species (Lapointe-Garant et al.2010;Chen et al.2011;Haghshenas et al.2016;Castaldi et al.2020;Jiao et al.2022;Qiao et al.2022;Stern et al.2023).Therefore,numerous studies have been carried out to determine the relationship between drought indices and the annual growth of trees,with the aim of identifying the most suitable drought index for this purpose.Tree chronologies investigate the relationship between climate and tree growth (Touchan and Hughes 1999;Levanič et al.2013;Pasho et al.2014;Yadav et al.2015;Pasho and Alla 2022).Tejedor et al.(2016) reconstructed the standardized precipitation index (SPI) over 318 years using 336 tree ring width samples from 169 trees of five different pine species in eastern Spain.The results identified 36 drought and 28 wet years.Touchan et al.(2005) reconstructed 747 years of a May–July SPI for most of Turkey using annual ring samples of fourJuniperus excelsaM.Bieb.trees.Climate variability was seen as a result of both interannual and interdecadal time scales.
Studies indicate that both precipitation and temperature are effective factors for tree growth.Therefore,instead of using a single-variable drought index based on precipitation,two-variable drought indices that consider the effect of temperature or evapotranspiration may give better results(Bhuyan et al.2017;Vakhnina et al.2022;Wang et al.2022).Dhyani et al.(2022) usedPinus wallichianaA.B.Jacks for the reconstruction of summer droughts in the western Himalayas.Their study indicated that the combined effects of precipitation and temperature in the form of the standardized precipitation drought index (SPEI) notably affected tree growth during the monsoon seasons more than drought indices based on precipitation or temperature alone.Gauli et al.(2022) investigated the effect of climatic variables on the growth of Scots pine (Pinus sylvestris),Norway spruce(Picea abies),and Douglas fir (Pseudotsuga menziesii) in northern Germany.The results showed that the increase in January–March temperatures of the current year significantly impacted the growth ofPinus sylvestrisandPseudotsuga menziesii.However,the increase in May–July precipitation and March temperatures of the current year were parameters affecting the growth ofPicea abies.
One of the issues that should be considered is that drought is defined in different periods and time windows,and finding the appropriate drought index that has a greater effect on tree growth is important.Cabral-Alemán et al.(2022) reconstructed a bivariate SPEI using annual rings ofPinus durangensisMartinez.Chronologies for earlywood and latewood were generated for 296 years.The earlywood residual chronology (EWres) had a good agreement with the six-month accumulative SPEI for February-May (SPEI6FM).Using a linear regression model,the SPEI6FM was reconstructed for 296 years and resulted in 16% of the years noted as drought conditions.Hadad et al.(2022) used annual rings ofAdesmia pinifoliaHook.&Arn.from the western Andes foothills of Argentina and reconstructed an SPEI for 412 years.They reported a strong relationship between the chronology and monthly precipitation,and with SPEI-12 month.In contrast,there was a negative relationship with temperature over the last 40 years.
The complexity of weather conditions leads to situations where the relationship between drought and annual tree growth do not follow a linear relationship,thus the use of non-linear models is inevitable.The decision tree model describes the data relationships by separating the data into individual subsets and presenting simple multivariate regression relationships transparently.The ability of this modeling has been evaluated in several studies (Sattari et al.2018;Yin et al.2018;Shamshirband et al.2020).Ghorbani et al.(2022) employed a stepwise M5 model tree to determine the factors influencing rainfall prediction in northeast Iran.Between the climatic signals,the Sunspots were considered the most significant,while the Nino 4,EA,and NAO were other significant predictors.
Few studies have examined the relationship of Oriental beech in Iran to drought (Balapour et al.2010;Oladi et al.2011;Pourtahmasi et al.2011;Oladi and Pourtahmasi 2012;Haghshenas et al.2016).
The Hyrcanian forests in northeast Iran are temperate forests.Oriental beech (F.orientalis) is one of the most valuable species in these forests and constitutes 17.6% of the area and 30.0% of the standing volume.Oriental beech has been used in numerous dendrochronological studies worldwide(Drobyshev et al.2010;Pluess and Weber 2012;van der Maaten 2012) and was chosen for this study as it reflects well climatic fluctuations of precipitation and temperature(Balapour et al.2010).
The purpose of this study was to evaluate the univariate SPI drought index based on precipitation and the bivariate SPEI based on precipitation and evapo-transpiration,to select the suitable drought index in different time periods and scales affecting the annual growth of Oriental beech in the Golestan province of Iran.Considering that potential evaporation-transpiration is calculated in the SPEI,therefore,three conventional methods of evapotranspiration-transpiration calculation were also evaluated to determine the most appropriate for calculation of the SPEI,and ultimately,to study the possibility of extending drought data for previous periods.
Materials and methods
Study area and climate data
The forests of Golestan province in Gorgan and Kordkoy cities were chosen as the study area (Fig.1).Due to extreme topographic changes,these forests have Mediterranean,semi-humid,and humid climates.Mean annual precipitation is more than 600 mm a-1and the average annual temperature is below 17 °C.Figure 2 illustrates the climograph of monthly precipitation and temperature data in the study area.The forests are three-layered with complex structures.Some parts of the study area are under active forest management,and some are conserved as natural forests.The main tree species areF.orientalisLipsky,Acer cappadoicicumGled,Acer velutiumBioss,Alnus glotinosaL.Gaerten,Alnus subcordataC.A.M.,Carpinus betulusL.,Dyospyrus lotusL.,Fraxinus excelsiorL.,Parrotia persica(DC) C.A.M.,Tilia begonifoliaStev,Ulmus carpinifoliaBorkh,andUlmus glabraHuds.The mean stand density,volume,and basal area are 514.6 ind.ha-1,262.9 m3ha-1,and 23.7 m2ha-1,respectively(Mohammadi et al.2017).
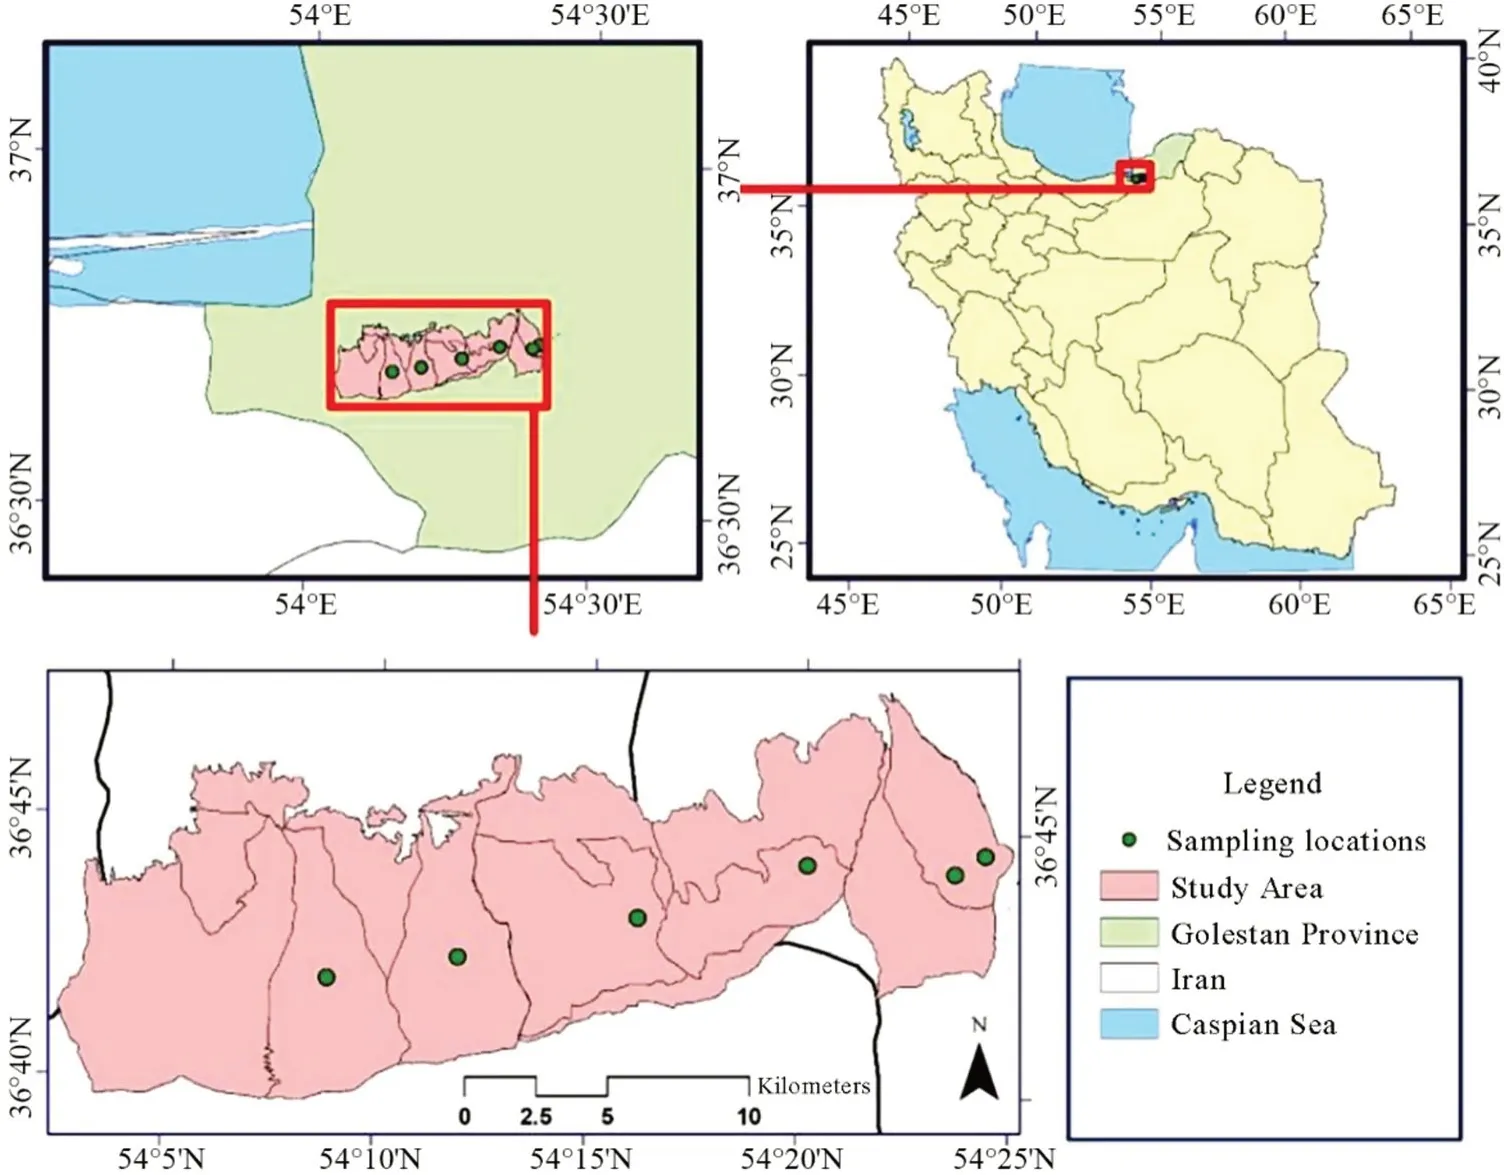
Fig.1 Location of the study area in Golestan Province

Fig.2 Climograph of monthly precipitation and temperature data in the study area
The historical climate data used for this study were obtained from Gorgan’s Hashem Abad synoptic station (36°50′ 44.31″ N,54° 26′ 21.61″ E),which consist of monthly precipitation totals (mm),monthly mean maximum,mean minimum,and mean temperatures (°C),monthly mean sunshine hours (h) and wind speed (m s-1) for 1985-2015.
Tree ring data and chronology development
Fifteen healthy Oriental beech trees from different altitudes were selected.A 10-cm thick disc was removed at diameter at breast height (DBH;1.30 m).The maximum,mean and minimum DBH were 76.0,53.5 and 44.0 cm,and their maximum,mean,and minimum heights were 32.9,29.3,and 27.5 m,respectively (Table 1).Oriental beech is shade-tolerant and highly competitive.It is found where the air moisture is high and there is often fog for most of the year,especially during the growing season.Hence,compared to other species,Oriental beech is suitable for investigating the effect of drought on annual radial growth.

Table 1 Study site and characteristics of oriental beech
The disks were left in the open air and shaded to dry at room temperature.After drying,120-,80-,and 60-grade sandpaper was used to increase the sharpness of the rings (Fig.3).The radial width was measured from the bark to the pith using a LinTab measuring device equipped with TSAP (Time Series Analysis and Presentation) software (Rinntech,Heidelberg,Germany) with an accuracy of 0.01 mm from the bark.For accurate results and to avoid errors,measurements were made for each sample in four directions with a-90°angle.After measuring,cross-dating between the growth curves and time series of growth curves was performed using skeleton plots that provide the relative growth for year t relative to yearst-1 andt+1.The Gleichlaufigkeit value (GLK) was calculated to verify the quality of cross-dating.GLK is a measure of the year-to-year agreement calculated to show the inter-annual growth tendencies among the trees (Eckstein and Bauch 1969;Schweingruber 1988).GLK values >60% were considered significant.

Fig.3 Disk of Fagus orientalis collected from the Shast-kalate site
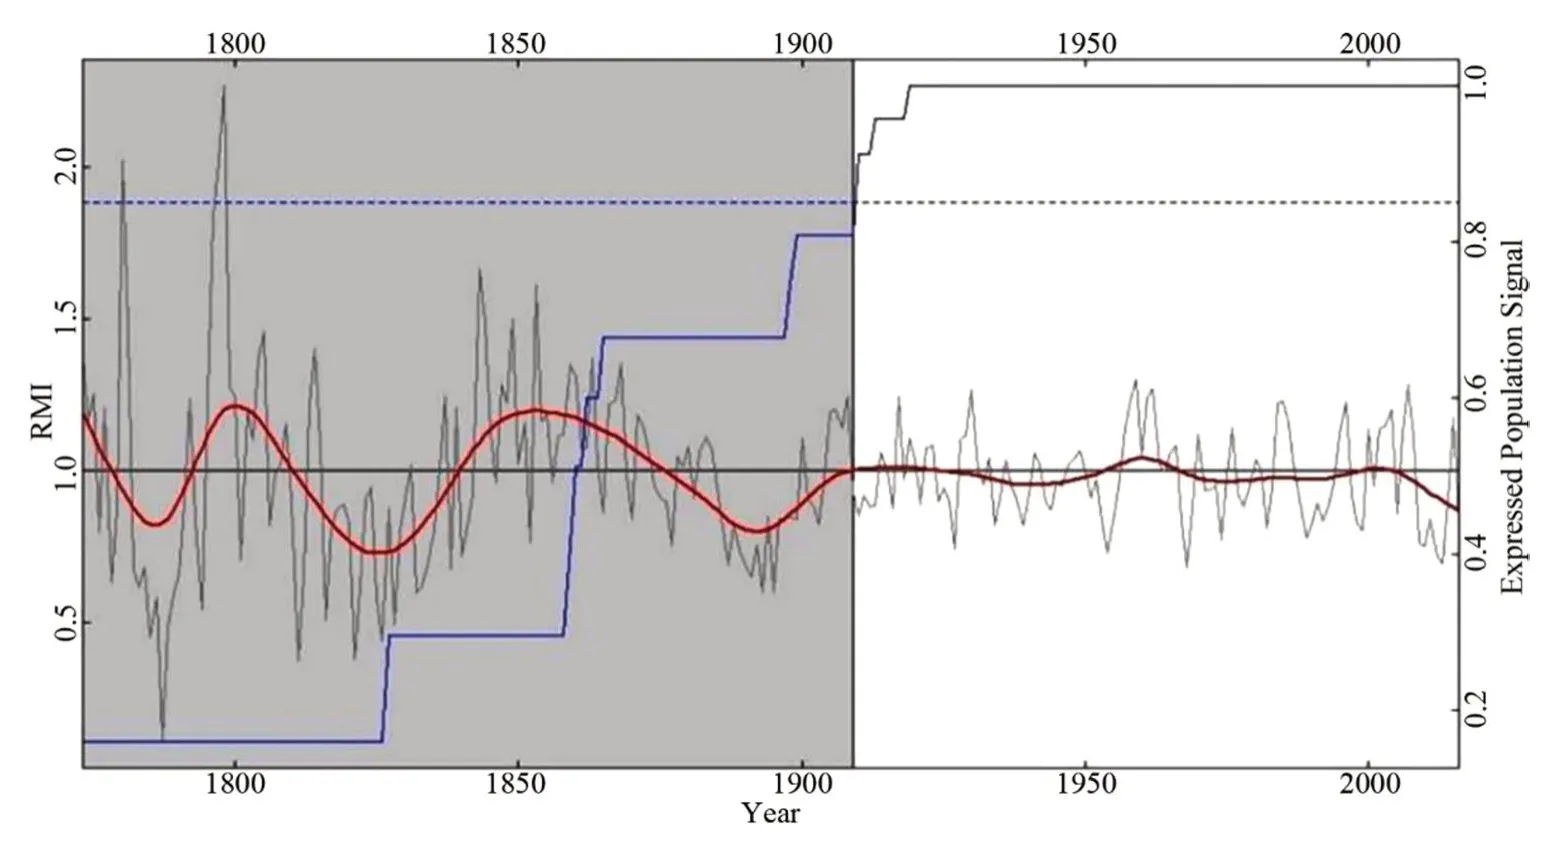
Fig.4 RES chronology of the study area and EPS diagram(EPS threshold was considered 85%);the blue dotted,and solid blue,red and grey lines demonstrate EPS threshold limit,the EPS,the smoothing Spline mean of chronology and Spline mean of chronology,respectively
To eliminate non-climatic trends,the standardization of growth rings was performed using the C-method with the help of R software (R Development Core Team 2016) and the dplR package (Eqs.(1–3) (Biondi and Qeadan 2008;Bunn 2008).
where,Ewlis the expected ring width,and l is the number of years since pith formation.Equation 1 is used when the basal area increment remains constant (c).
The dplR package in R software was utilized to generate the RES chronology (residual chronology) (Bunn 2008).Mean sensitivity (MS) and expressed population signal(EPS) were computed for the constructed chronology.MS is diagnostic for signal strength and demonstrates the relative changes in ring-width variance between sequential years(Fritts 1976;Rahman et al.2018).The EPS with its threshold,usually considered 0.85,shows the safest part of the chronology for the reconstruction (Cook et al.1990),according to the number and overlap in the number of samples used in the construction of the chronology (Biondi and Qeadan 2008;Buras 2017).
Calculation of drought indices
SPI(standardized precipitation index)
The SPI was introduced by McKee et al.(1993) and has been frequently used in drought assessment studies due to its versatility and robustness (Redmond 2002).SPI is computed by aggregating precipitation over ‘n’ months,named accumulation periods,and fitting a gamma probability density function (PDF) to these accumulated values from which probabilities are transformed to a standard normal distribution(μ=0,σ=1) to yield the SPI (McKee et al.1993;Guttman 1999;Lloyd-Hughes and Saunders 2002;Stagge et al.2015).This index has been recommended by the World Meteorological Organization (WMO 2012) for use in drought monitoring and early warning applications.
SPEI(standardized precipitation drought index)
The SPEI was proposed by Vicente-Serrano et al.(2010)and incorporates the atmospheric evaporative demand via estimation of the potential evapotranspiration (PET).The Penman–Monteith (Doorenbos and Pruitt 1977),Thornthwaite (Thornthwaite 1948),and Hargreaves-Samani (Hargreaves and Samani 1985) methods were used for calculating PET.SPEI is based on the monthly difference between precipitation (P) and potential evapotranspiration (PET),as shown in Eq.(4).
where,Dis the water deficit for the analyzed month at multiple time scales.The values were adjusted to normal standardized units using a three-parameter log-logistic distribution,and the SPEI value was calculated as the standardized values of cumulative probability ofDi,as follows:
where,Pis the probability of exceeding a specifiedDi,and the sign of the resultant SPEI is reversed forP>0.5(Abramowitz and Stegun 1965).The drought classification is shown in Table 2.Calculations of the SPI and SPEI were made using the ‘SPEI’ package developed within the R software (Beguería et al.2014).

Table 2 Classification of drought indices of SPI and SPEI
The frequently used accumulation periods 3,6,and 12 months are considered in this study.For example,SPEI or SPI with 3-,6-,9-and 12-time scales correspond to winter,spring,summer,and autumn seasons,respectively.
Data analysis
Mann–Kendall trend test
The Mann–Kendall trend test (Mann 1945;Kendall 1975)is a non-parametric rank-based test for evaluating the existence of a trend in a particular time series,which is broadly found in hydro-meteorological trend analysis research (Yue and Pilon 2004).The null hypothesis H0 considers that the data (Xk,i=1,2,…,m) are independent and identically distributed random variables.The alternative hypothesis H1 assumes that there exists a trend in X.The test statistic is computed using Eq.(8):
where,xldenotes consecutive data values,mis the length of the data set,and
Mann (1945) and Kendall (1975) indicated thatGfollows a normal distribution whenm≥ 8;the mean and the variance are calculated using Eq.10:
where,this the number of extenth.The standardized test statisticUis as follows:
0.01,0.05,and 0.1 are considered as the significance levels,and the corresponding |Uα| are 2.58,1.96,and 1.65,respectively.TheH0should be rejected in cases where|U| >|Uα|.
Pettitt test
The Pettitt test (Pettitt 1979) is a non-parametric test used to detect a significant abrupt change in a hydrological series or a climate time series with continuous data (Pohlert 2016).The null hypothesis indicates that data are homogeneous,whereas the alternative hypothesis H1 is that there is a date at which there is a change in the data.The test statisticUt,is given by the following equation (Ma et al.2008).
where,
The corresponding statisticKnand associated confidence levelρare given as follows:
The null hypothesis is rejected when the value ofρis smaller than the specified confidence level.The approximate significance probabilitypfor a change point is defined as:
All the statistical analysis were performed in the XLSTAT(Addinsoft) software package.
Multiple linear regression
Multiple regression analysis (MR) is a common framework for analyzing the relationship of independent variables to an individual dependent variable (Aiken et al.2003).MR is among the most commonly used statistical analysis (Aiken and West 1991) and is highly adaptable and lends itself to the examination of a wide variety of questions.The independent variables may be quantitative measures or they may be categorical measures.One general form of the regression equation can be expressed as:
where,Xi1,Xi2,…..,Xipare the scores of caseion thej=1,2,…..,ppredictors;b1,b2,…..bj…..bpare regression weights,andb0is the regression intercept (Aiken et al.2003).
MR statistical analysis were performed in RapidMiner data science software.
Decision tree
A decision tree is one of the data mining techniques used to find patterns and relationships between variables in a data set.They are a way of representing a set of rules that lead to a category or value and are formed by the sequential separation of data into a series of separate groups,and by increasing the distance between groups in the separation process.The structure of a tree model includes roots,internal nodes,and leaves.Decision tree models are used to solve many classification and regression problems.The most widely used decision tree models are the C5 and M5 to predict numerical values and classification,respectively (Quinlan 1993).The M5 provides a multivariate linear model built for the data in each node of the tree model,while conventional decision tree models represent discrete classes or classes as output.The structure of decision tree models involves creating a tree and pruning it (Quinlan 1992;Wang and Witten 1997).In tree construction,an inferential algorithm or division criterion is used to generate a decision tree.The division criterion in the M5 model evaluates the standard deviation of class values that reach a node as a quantity of error and calculates the expected reduction in this error because of testing each attribute in that node.Entropy division and interest rate criteria are used in the C5 decision tree.Decision tree analysis were performed in RapidMiner data science software.
Results
Chronology characteristics
After performing the time-matching process for two samples from each tree and calculating their average,the growth curve was developed for all trees.By averaging two measured samples from one tree and acquiring the growth curves,it was found that 12 out of 15 selected trees had the highest degree of agreement,and therefore three samples were removed.The GLK statistic for 12 trees and two samples from each tree was more than 60,the average was 65 and was significant at the level of 95% probability.In some samples,it reached 90% probability,and the results showed that 12 trees had a high agreement and a similar growth pattern.
Figure 4 shows the RES chronology with the number of specimens used in this site.During the chronological period,there were numerous fluctuations in the annual tree growth.The chronological length obtained for the Gorgan habitat was 242 years (1773 -2015),with a minimum age of 99 years,and an average age of 142 years.By calculating EPS with R software,the year 1910 was identified as the EPS threshold,i.e.,according to the number and the overlap of the samples,the RES from 2015 to 1910 had the highest reliability for reconstruction.Sensitivity analysis for the chronology of trees showed that the width of each ring fluctuated approximately 0.33 per year compared to adjacent rings.
Temporal changes in climatic factors and annual growth rings using non‑parametric tests
The temporal changes in the annual series of precipitation,temperature,sunshine hours,and wind speed were examined initially using modified Mann–Kendall tests to detect trends and the Pettitt test to detect change points in the data(Table 3).The results demonstrate that,except for annual precipitation,trends and abrupt changes were detected in other time series data,and increasing trends could also be seen in mean annual temperature,sunshine hours,and wind speed series.An abrupt change point is visible in the data time series of potential evapotranspiration,calculated by the Penman–Monteith method,due to the increasing trend in meteorological parameters affecting evapotranspiration(Fig.5A).
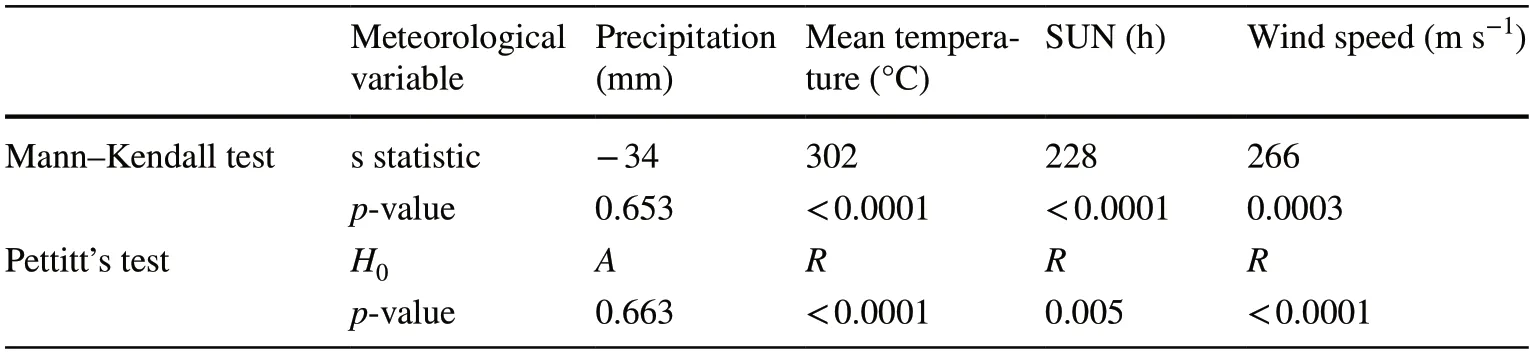
Table 3 Results of trend analysis by the Mann–Kendall test and Pettitt’s homogeneity test on meteorological data
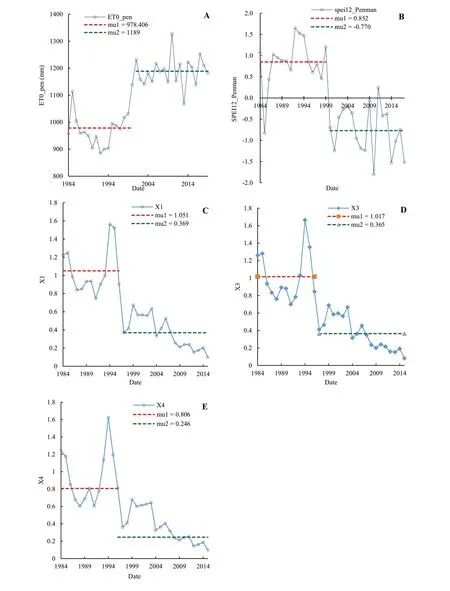
Fig.5 Abrupt change in the A time series of potential evapotranspiration data calculated by the Penman–Monteith method;B,the annual time series of the SPEI calculated by the Penman–Monteith method,C,D and E time series of standardized data of growth rings of trees.X1,X3 and X4 represent different trees,mu1 and mu2 represent change points
After calculating the SPEI based on the three methods of calculating evapotranspiration,the Pettitt homogeneity test was performed to detect abrupt changes in the different series of the SPEI.A decreasing abrupt change was only significant in the index based on the Penman–Monteith method (Fig.5B).This abrupt change has occurred since 2000 and shows drought conditions from 2000 to 2015,while the precipitation series did not show any significant change.However,the SPI is without any significant abrupt changes or trends.
By fitting the Mann–Kendall and Pettitt homogeneity tests to the data time series of the annual growth of the tree,it was found that there was an abrupt change and a decreasing growth trend for all trees under study (Fig.5C–E).
Correlation between meteorological data and drought indices with annual growth
By establishing a simple correlation between meteorological data and potential evapotranspiration performed by the three methods,Penman–Monteith,Hargreaves,and Thornthwaite,the results show that tree growth is strongly dependent on mean annual air temperature and wind speed,which are the most important factors affecting evapotranspiration and,interestingly,annual precipitation does not correlate with the annual growth (Table 4).Among the methods for calculating evapotranspiration,the Thornthwaite and Penman–Monteith methods,with a slight difference,were better (R2=70%)correlated with annual growth.

Table 4 Coefficient of determination between meteorological variables and annual growth
The trend of drought indices was examined using the Mann–Kendall test.As shown in Fig.6,the results indicate that,unlike the univariate SPI,the bivariate SPEI shows a significant decreasing trend in all-time steps,except in autumn.
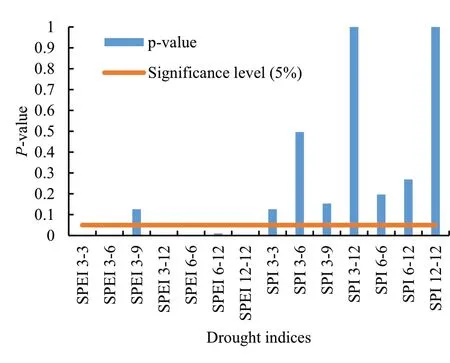
Fig.6 Significant trend of drought indices at different time scales
Relationships between drought indices and annual growth
To determine the relationship between the SPI and SPEI with annual growth,simple correlations of linear relationships were developed using linear to multivariate regression methods (Table 5);nonlinear relationships were investigated using the M5 decision tree regression method.The results show that,by using the M5 decision tree regression model,the best result was obtained with the annual SPEI withR2=82% and the root mean square error 0.56 (Table 6).Among the seasonal indicators,summer drought established a higher correlation with annual growth than other seasons.
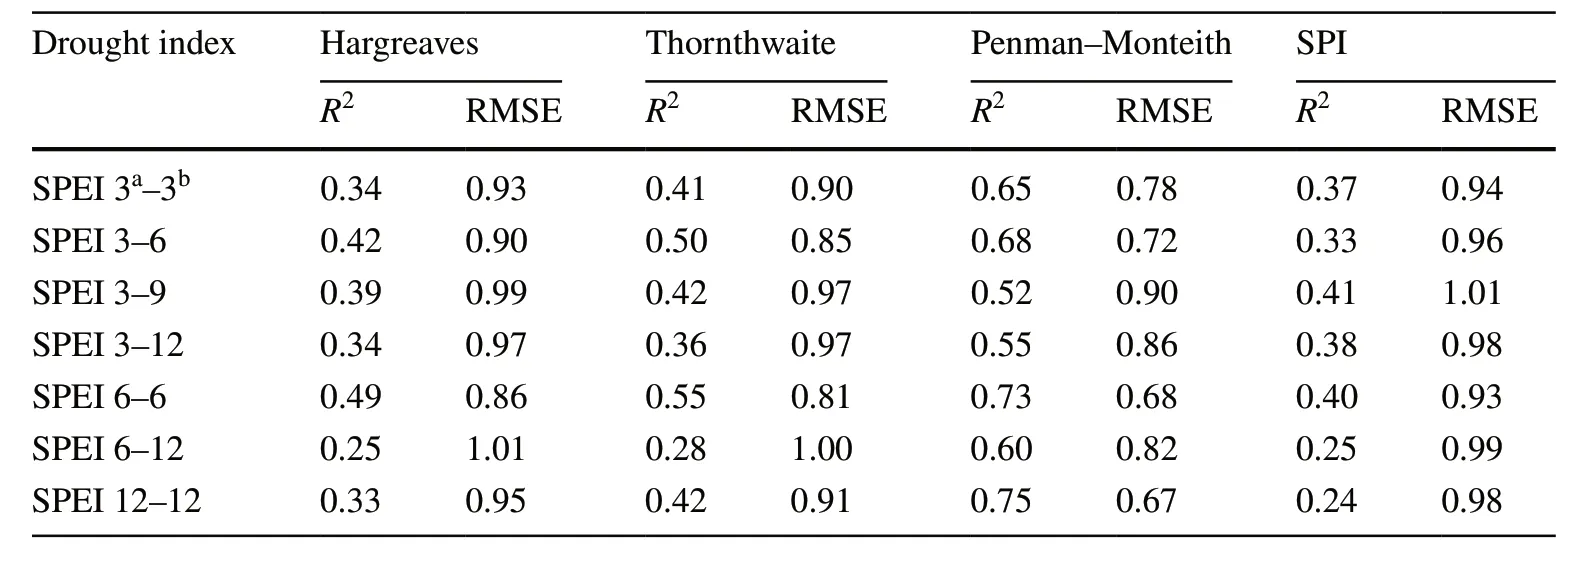
Table 5 The predicted error-values and coefficient of determination calculated via linear multivariate regression between different evapotranspiration methods and the SPI with SPEI at different time scales based on annual growth rings
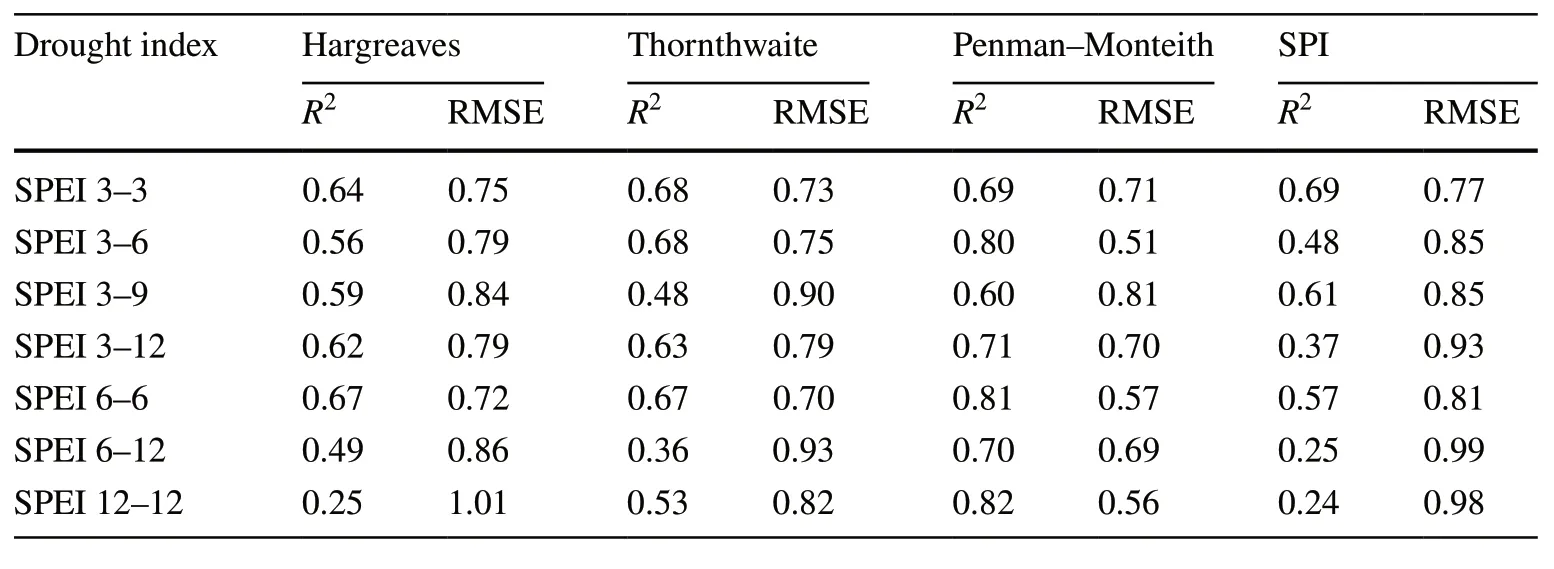
Table 6 Error values and coefficient of determination calculated via M5 decision tree regression between different evapotranspiration methods and SPI with SPEI at different time scales based on annual growth
SPEI was calculated based on available meteorological data for 1985–2015,and after finding the relationship between the annual growth and the annual SPEI (which had the best results),the drought conditions were reconstructed for 1922–1984.The results demonstrate that,before 1985,according to the definition of drought based on data from 1985 to 2015,no drought conditions occurred,although,from 1985–2015,more than 18% of the years experienced drought (Table 7).
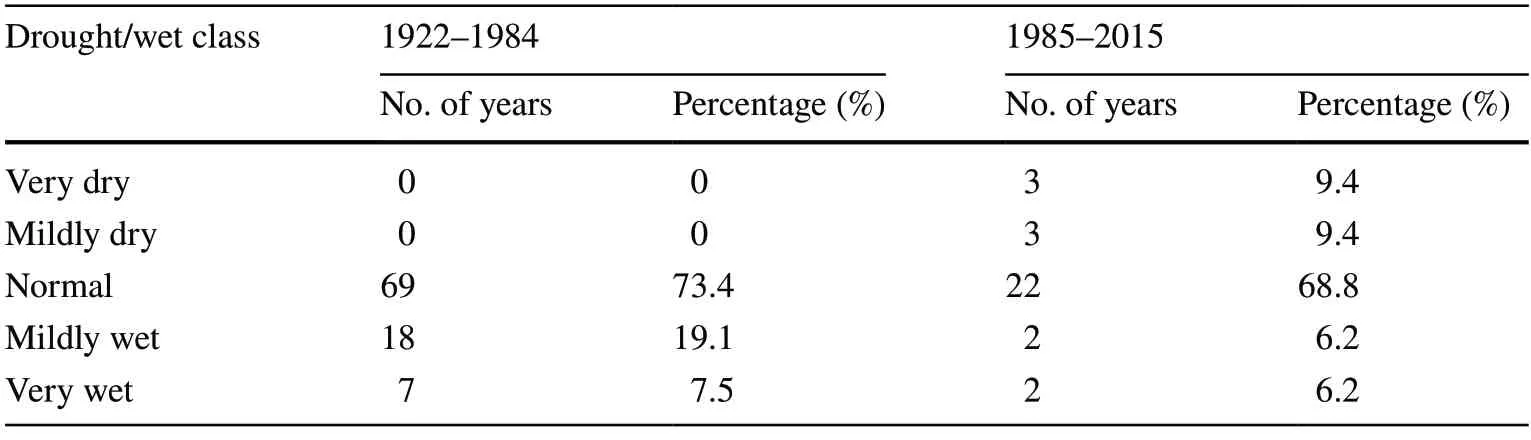
Table 7 Number of drought/wet classes and their percentage before and after 1985
Prediction of drought classes
According to Fig.7,severe wet and dry periods that are part of the drought conditions and their prediction are of considerable importance,are not correctly predicted using regression methods but are usually predicted as moderately wet and dry periods.Therefore,decision tree classification models were used to predict the drought classes.
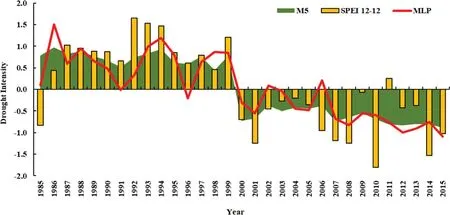
Fig.7 Comparison of M5 and MR methods in predicting the annual drought index (SPEI 12)
This study aimed to predict drought based on annual growth rings,therefore two scenarios were proposed.In the first,data of the previous year would not be entered into the model as an independent input variable,and only the same year’s growth data would be used in the prediction model.The results show that the prediction was inaccurate.Due to the high frequency of normal drought conditions,in most cases,the decision tree model predicted normal conditions(Table 8).

Table 8 Drought classes predicted with SPEI based on the decision tree model C5 without growth data of the previous year
By incorporating the difference between annual growth ring data at the current and the previous years,the accuracy of drought class predictions improved by up to 90%.However,all drought classes are also seen in the prediction;64.5% were in normal conditions and the remaining 35.5% were distributed among the other four drought classes,all are of considerable importance in predicting.Severe wet and dry conditions,which are predicted are especially key tools in water resources management.This decision tree model shows an acceptable result with an accuracy of more than 90.32%,and in some cases where there is an error in the prediction,the differences were not significant (Table 9).The important point in this decision tree model is the correct prediction of severe wet and dry conditions.
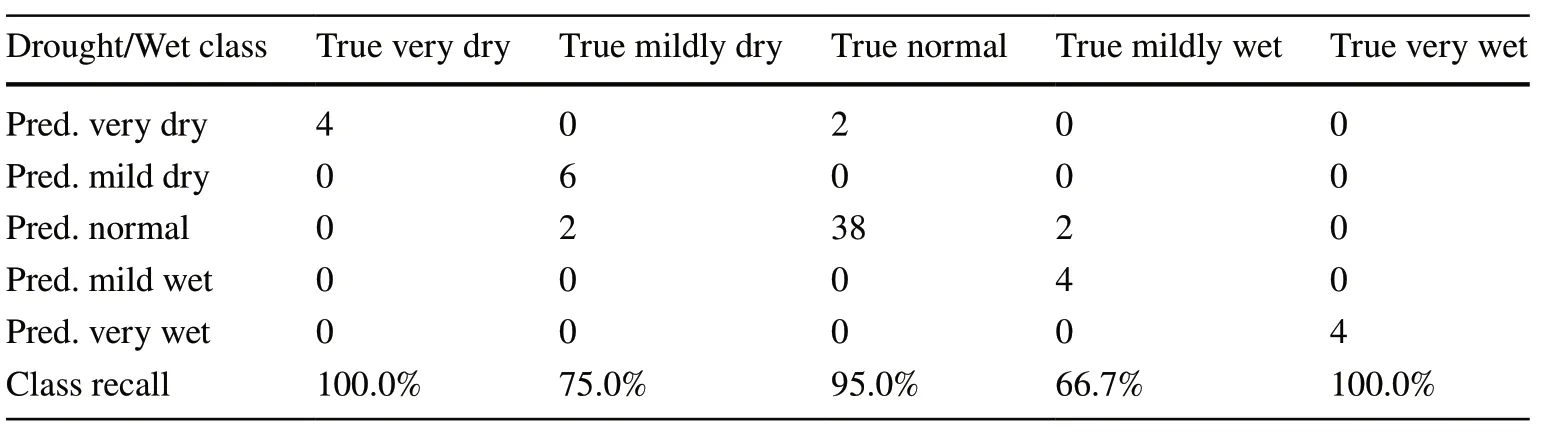
Table 9 Drought classes predicted with SPEI based on the C5 decision tree model with growth data of the previous year
The decision tree produced six leaves while predicting different drought classes,and an interesting point is the placement of the difference in tree growth for two consecutive years as a variable in the root of the tree,indicating that droughts of long duration can severely affect and slow tree growth (Fig.8).
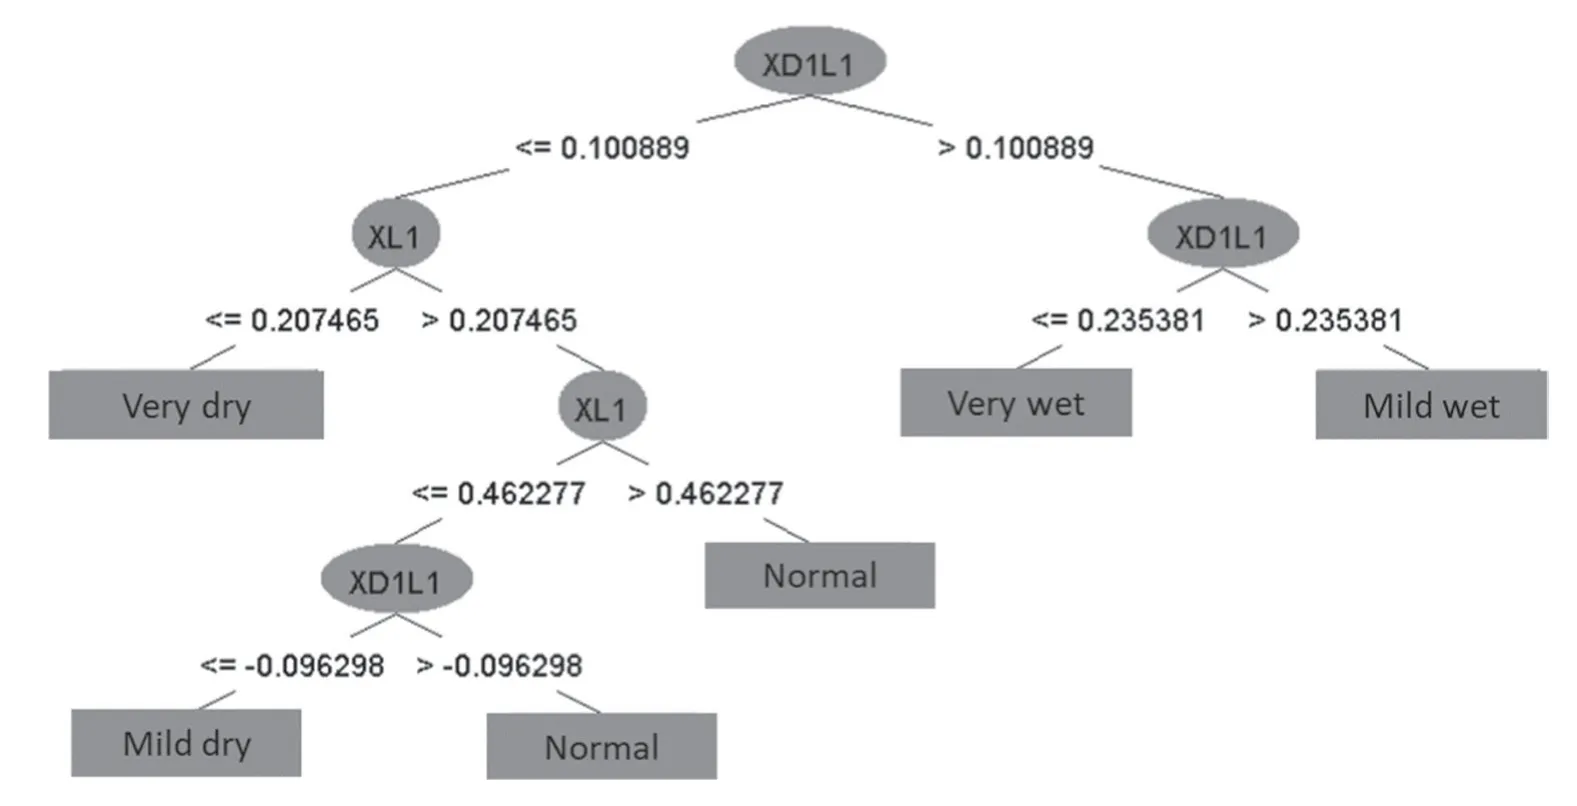
Fig.8 Prediction of different drought classes using the decision tree model.XD1:difference between annual growth ring data in the current and previous year X: tree ring growth of the current year
If the aim is to predict the SPI instead of the SPEI on an annual scale,our prediction was inaccurate,as only 3 of 5 drought classes were predicted,and mild droughts and severe wet years were not seen in the predictions (Table 10).
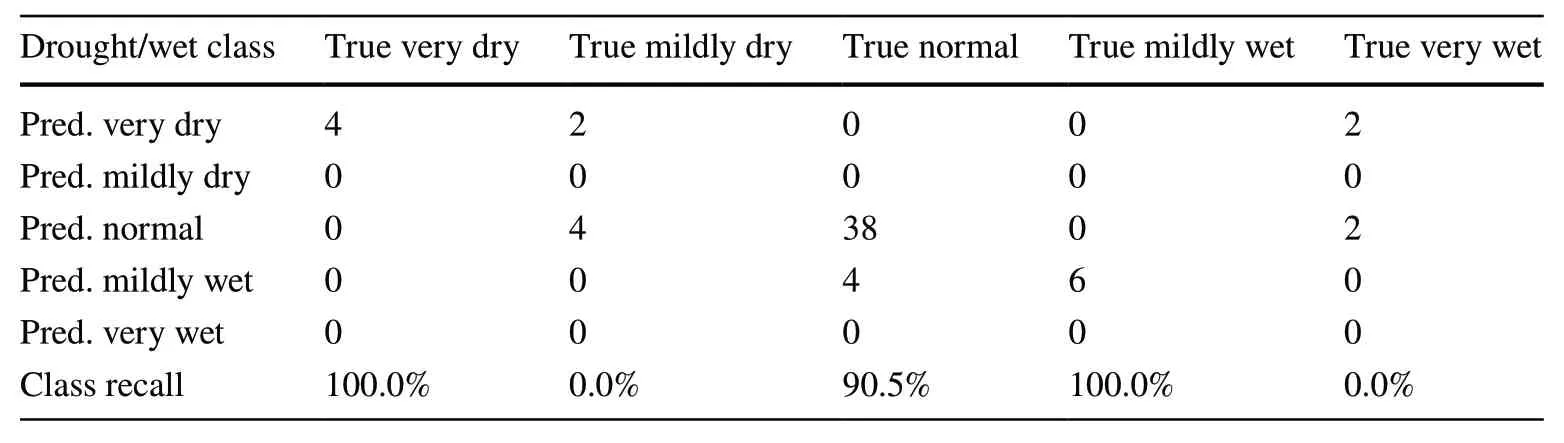
Table 10 Drought classes predicted with SPI based on the C5 decision tree model with growth data of the previous year
Discussion
Trend and homogeneity in time series of meteorological data,drought indices,and annual growth
The trends in homogenous data time series are a result of changes in climate and air,and therefore it is necessary to investigate these trends (Conrad and Pollak 1950).A homogeneity test is required before trend detection testing because non-climatic changes may lead to disruption in the homogeneity of the data (Selim Gülü 2020).To detect monotonic trends and change points in climate,environmental,and hydrological data time series,the Mann–Kendall trend detection and Pettitt change point detection tests were applied to the data of the Hashemabad-Gorgan synoptic station (the closest to the study area).The results show no significant increase or decrease in annual precipitation without any abrupt change (Table 3).Accordingly,in terms of annual precipitation,no climate change has occurred in the region.Therefore,the precipitation-based univariate drought index cannot show the drought situation and climate change clearly,unlike the annual precipitation,wind speed,air temperature,and sunshine hours which have been increasing significantly.Due to the significant increasing trend of parameters affecting annual evapotranspiration,in all three methods of evapotranspiration,a significant upward trend and upward jump were also observed.A significant upward trend in temperatures and wind speeds followed by evapotranspiration makes the bivariate SPEI,unlike the univariate SPI,results in a significant decreasing trend in all seasons and time scales,except autumn (Fig.6).This consistency indicates that the SPEI has a higher correlation with annual growth.This study showed that,despite the lack of significant change in precipitation which is in agreement with Rahimi et al.(2019),a significant increase in evapotranspiration can reduce water resources and increase both water demands (García-Ruiz et al.2011) and the possibility of wildfire.Although a large number of irrigation needs for cultivation in this area are provided by groundwater resources and water stored behind dams,these changes have caused water shortage problems and will increase in the future.These increasing trends in evapotranspiration can also cause the SPEI to abruptly change and trend toward drought conditions (Fig.5A).
Climate‑growth relationships
Mature trees have deep root systems and extract water from different depths (Balapour et al.2010).Due to the low annual fluctuations of groundwater,annual changes in precipitation appear to not have a major impact on annual tree growth.This was confirmed by the lack of correlation between annual precipitation and annual rings (Table 4).On the other hand,rising temperatures and wind speed,factors that increase evapotranspiration (Goyal 2004;Yin et al.2010),can stress trees and affect their growth (Kramer 1994;Vicente-Serrano et al.2015).This was also confirmed,and mean annual temperature and wind speed were correlated withR2=61% and 62% with annual growth,respectively(Table 4).The correlation between evapotranspiration and annual growth also showed that the Thornwaite and Penman–monteith methods have a higher correlation rate with annual growth (Table 4).
Linear and non‑linear regression‑ drought indices relationships
By modeling drought conditions based on numerical and classification methods,the SPEI was observed to be a better indicator to show the effect of drought on tree growth(Tables 5 and 6).However,the method used to calculate potential evapotranspiration can have different results in the relationship between the SPEI and annual growth.In this study,evapotranspiration calculated using the Penman–Monteith method was significantly different from the methods of Thornthwaite and Hargreaves (Tables 5 and 6).Investigating the temporal effect of drought on annual growth found that,among the seasons of the year,drought had a higher correlation in the summer and in the first half of the year(spring and summer).Summer is the hottest season of the year (Amir Chakhmaghi 2010;Arsalani et al.2012),and heat stress can cause drought stress and have a considerable impact on growth.Notably,although the annual precipitation did not show a high correlation with growth,spring precipitation,which is the beginning of the growing season,affects growth.Therefore,the univariate SPI also correlates well with growth in this season.However,this relationship has a complexity that can be identified by nonlinear modeling and must be built by nonlinear modeling methods such as M5 decision tree regression.
However,regardless of the evapotranspiration calculation method,the SPEI provides better results than the SPI.Given that the drought index has been calculated for the period 1985–2015 and also due to the occurrence of climate change in the region,if drought is calculated based on 1922–1948,no dry conditions were observed,and this demonstrates that the region is moving towards dry conditions which pose a severe risk (Table 7).
Prediction of drought classes
A decision tree predicts numerical values and classification.In this study,the decision tree regression model M5 did not predict the wet season and severe drought conditions well,but the classification model recognized these drought classes well (Tables 8 and 9).Also,by modeling with the help of decision tree regression,as indicated,growth rings of previous years can influence the growth of trees in the following year.Therefore,growth rings of previous years can be effective in predicting drought conditions of the following year and improving prediction precision,which is in agreement with Jalilvand (2008) and Nikray (2017).
Conclusion
In this study,the relationship between annual growth rings of Oriental beech was evaluated with two drought indices(SPI and SPEI) with the help of C5 and M5 decision tree models.However,more research is needed to evaluate the impact of drought indices on the annual growth of this and other species within the full ecological range of the Hyrcanian forests to better understand the effect of climate change on tree growth.Severe wet and dry conditions were predicted better with the decision tree classification model.Given that these drought classes are less common,increasing the number of statistical years can provide a more appropriate model.Overall,the SPEI has a high correlation with the annual growth of Oriental beech.The trend and change point detection analysis in our study showed increasing trends and abrupt changes in wind speed,temperature,and sunshine hours and consequently,an increasing trend was also observed in evapotranspiration and ultimately a decreasing trend in the SPEI,which makes this drought index a key component affecting annual growth rings of Oriental beech.
AcknowledgementsThis research has been conducted at the Gorgan University of Agricultural Sciences and Natural Resources and supported by the Iranian National Science Foundation (INSF) (grant no.96012844).The authors are grateful to the INSF for the financial support for this research.
Author contributionKhalil Ghorbani and Jahangir Mohammadi designed and conceptualized the study;Khalil Ghorbani and Jahangir Mohammadi collected the data and performed the analysis;all authors contributed in writing and commenting on the draft.Laleh Rezaei Ghaleh edited the final manuscript and all authors read and approved the final manuscript.
FundingThis work was supported by Iran National Science Foundation (INSF) (grant no.96012844).
杂志排行

Journal of Forestry Research的其它文章
- Physiological and psychological responses to tended plant communities with varying color characteristics
- Climate‑change habitat shifts for the vulnerable endemic oak species (Quercus arkansana Sarg.)
- Plant growth and metabolism of exotic and native Crotalaria species for mine land rehabilitation in the Amazon
- Peat properties of a tropical forest reserve adjacent to a fire-break canal
- Impact of cattle density on the structure and natural regeneration of a turkey oak stand on an agrosilvopastoral farm in central Italy
- Climate-growth relationships of Pinus tabuliformis along an altitudinal gradient on Baiyunshan Mountain,Central China