Microenvironmental effects on growth response of Pinus massoniana to climate at its northern boundary in the Tongbai Mountains,Central China
2024-01-26JianfengPengJiayueCuiJinbaoLiMengPengYongtaoMaXiaoxuWeiJinkuanLiXuanLiYamenLiuJiaxinLi
Jianfeng Peng · Jiayue Cui · Jinbao Li ·Meng Peng · Yongtao Ma · Xiaoxu Wei · Jinkuan Li ·Xuan Li · Yamen Liu · Jiaxin Li
Abstract The Tongbai Mountains is an ecologically sensitive region and the northern boundary of Pinus massoniana Lamb.To analyze the effect of different microenvironments on tree growth response to climate factors,we developed standard chronologies for earlywood width (EWW),latewood width (LWW),and total ring width (TRW) of P.massoniana at two sampling sites on slopes with different orientations,then analyzed characteristics of the chronologies and their correlations with climate variables from five stations in the region and with a regional normalized difference vegetation index (NDVI).Statistical results showed that the TRW/EWW/LWW chronology consistency and characteristics (mean sensitivity,signal to noise ratio,expressed population signal) for trees growing on the southeastern slope were much higher than for trees on the northeastern slope.Correlations indicated that temperature in current March and August has a significant positive effect on TRW/EWW/LWW formation,and the effect on the northeastern slope was weaker than on the southeastern slope.Compared to temperature,precipitation has more complicated effects on tree growth,but the effect on the northeastern slope was also generally weaker than on the southeastern slope.Stepwise linear regression analyses showed that temperature in August was the main limiting factor at the two sampling sites.Similarly,the response of tree growth on the southeastern slope as determined by the NDVI is better than on the northeastern slope,and the TRW/EWW/LWW chronologies for the southeastern slope explained over 50% of the total NDVI variances in June.Overall,the results indicate that the difference in the climate response of P. massoniana at two sampling sites is clearly caused by differences in the microenvironment,and such differences should be properly considered in future studies of forest dynamics and climate reconstructions.
Keywords Tree-rings · Pinus massoniana lamb · Microenvironment · Radial growth · Climate-growth response
Introduction
Tree growth is highly sensitive to climate change,and the growth response to climate can often be followed by evaluating the size of tree rings (Fritts 1976).In addition,the microenvironment affects the redistribution of heat and water,which often leads to differences in tree growth.Therefore,the climate response of the same tree species in different microenvironments can be very different.Global warming is indisputable (IPCC 2021) and has caused dramatic changes in the structure and function of forest ecosystems.As a result,many studies have attempted to elucidate the relationship between tree growth variables and climate factors to better understand the potential impacts of climate change on forest ecosystems and the feedback of forest dynamics on global warming (e.g.,Fan et al.2009;Gao et al.2013;Liang et al.2014;Lyu et al.2016;Cao et al.2019;Yu and Liu 2020;Peng et al.2021,2022a,b;Wang et al.2021;Jiao et al.2022;Ning et al.2022).
Pinus massonianaLamb (Pinaceae),a major tree species planted in southern China,and plays an essential role in regional ecological and economic development.Therefore,it is very important for the region to elucidate the relationship between its growth and climate.Huang et al.(2020) found that high temperature in July and August is a significant climate stressor onP.massonianaacross its geographical distribution and a critical factor behind the inverse trend between latitude and its net primary productivity.The height and radial growth ofP.massonianavary with climate zones,which combined with the influence of provenance,leads to significant variability in growth increments at the regional scale (Zhou 2001;Zhang et al.2020).Huang et al.(2021)conducted a meta-analysis using a network of 113 tree-ring width chronologies ofP.massonianafrom the geographical range of this species and found that temperature in January–March and precipitation in July–September generally enhance tree growth,whereas temperature in June–August leads to a decrease in tree growth.However,there are significant differences in the relationship between tree-ring width ofP.massonianaand climate factors in different studies.For example,Duan et al.(2012,2013) reported a sensitivity ofP.massonianato cold season (January-March or January-April) temperatures,based on a network of trees ofP.massonianain southeastern China.Chen et al.(2012)found that the total ring width ofP.massonianain the subtropical zone of Fujian Province was mainly influenced by summer–autumn temperature variability.Luo et al.(2017)found that summer and winter temperatures had negative effects,while early spring temperature had positive effects on tree growth ofP.massonianaandSchima superbain China’s subtropical monsoon mixed forest.Zeng et al.(2019)found that winter–spring (January–May) temperature was most critical forP.massonianain the Wuling Mountains in Central China.Li et al.(2019) found that the radial growth decline ofP.massonianawas mainly limited by dry conditions from May to October in the Daiyun Mountains in humid subtropical China.Others also found thatP.massonianais sensitive to the maximum temperature in June–September in Macheng in Southeast China (Cai and Liu 2013)and to precipitation in July–September on Mt.Dagangshan of South China (Qiao et al.2011).
The Tongbai Mountains,located in Central China in the transition zone from subtropical climate to the warm temperate monsoon climate,is an ecologically sensitive area and the northern boundary ofP.massonianain mainland China.However,despite the sensitivity ofP.massonianato climate change,only one tree-ring study has been done in the area(Cai and Liu 2021).In this study (Cai and Liu 2021),the authors analyzed the climate–growth relationship ofP.massonianaand reconstructed the mean minimum temperature for May–July of the past century using ring widths.Nonetheless,further research is needed to better understand the factors that affectP.massonianain the Tongbai Mountains.
With the development of dendrochronology,treering studies of earlywood width (EWW),latewood width(LWW),and total ring width (TRW) have been carried out in China in recent years (Xu et al.2012;Zheng et al.2012;Lan et al.2014;Zhang et al.2016;Zhao et al.2014,2019;Chen et al.2015;Gu et al.2020;Peng et al.2022a,b).These studies have revealed differences in the sensitivity of these tree-ring variables to climate.For example,Feng et al.(2012) showed that EWW ofP.armandiin the Huashan Mountain was greatly affected by a daily mean temperature of 3 °C,while LWW was greatly influenced by a daily mean temperature of 8 °C and was limited when temperature was higher than 11 °C.Zhao et al.(2019) found that EWW was more sensitive to climate factors than LWW and TRW ofP.tabulaeformisin the eastern Qinling Mountains.Gu et al.(2020) pointed out that EWW ofP.massonianawas more sensitive to climate than LWW in the margin and central distribution areas,and the temperature increase would inhibit radial growth early in the growing season.Peng et al.(2022a,b) found EWW chronology ofP.taiwanensisis most sensitive to mean temperature in May–June in the Tongbai Mountains.Therefore,the study of TRW/EWW/LWW ofP.massonianain different microenvironments in the Tongbai Mountains should help elucidate the relationship between tree growth and climate factors in this transition zoon.
We aimed to (1) distinguish the chronology characteristics and growth differences ofP.massonianagrowing in different microenvironmental conditions;(2) determine the main limiting climatic factors on the EWW/LWW/TRW growth ofP.massoniana;and (3) establish multiple stepwise regression models to verify the microenvironmental effects on tree growth.
Materials and methods
Study region
The study region is located in the Tongbai Mountains,which borders Henan Province and Hubei Province in Central China.It lies between the Funiu Mountains and the Dabie Mountains,stretching northwest to southeast for more than 120 km.The main peak is 1140 m above sea level (a.s.l.).The vegetation is mixed evergreen conifer-broadleaf forests and deciduous broadleaf forests,with dominant tree species such asP.massoniana,P.taiwanensis,andQuercus suber.The area is also the northern boundary ofP.massonianaand thus an ideal place to study its relationship with climate factors.The basic soil type in the northern slope of the mountains is mainly yellow–brown soil at elevations below 700 m a.s.l.,dark yellow–brown soil between 700 and 1000 m a.s.l.,and brown mountain soil above 1000 m a.s.l.(Zhu and Liu 1992).
Climate data and vegetation index
Climate data from 1969 to 2018 were acquired from five stations near the two sampling sites (Fig.1),including Biyang(BY,113.33° E,32.72° N),Queshan (QS,114.02° E,32.82°N),Tanghe (TH,112.8° E,32.68° N),Tongbai (TB,113.3°E,32.4° N),and Xinyang (XY,114.09° E,32.15° N),and averaged to represent the regional mean (RE) climate.During 1969–2018,the annual RE temperature was 15.32 ℃and regional annual total precipitation was 936.29 mm.The highest and lowest monthly mean temperatures were recorded in July (27.52 ℃) and January (1.78 ℃) (Fig.2a).Precipitation fell mainly in the summer (June–August),accounting for 49.5% of the annual total (Fig.2b).Therefore,the climate is the typical subtropical monsoon with high temperature and rainfall in summer and mild temperature and low rainfall in winter.

Fig.1 Map of study area and sampling sites,meteorological stations and the region for averaging NDVI data (32–33°N,113–114°E)
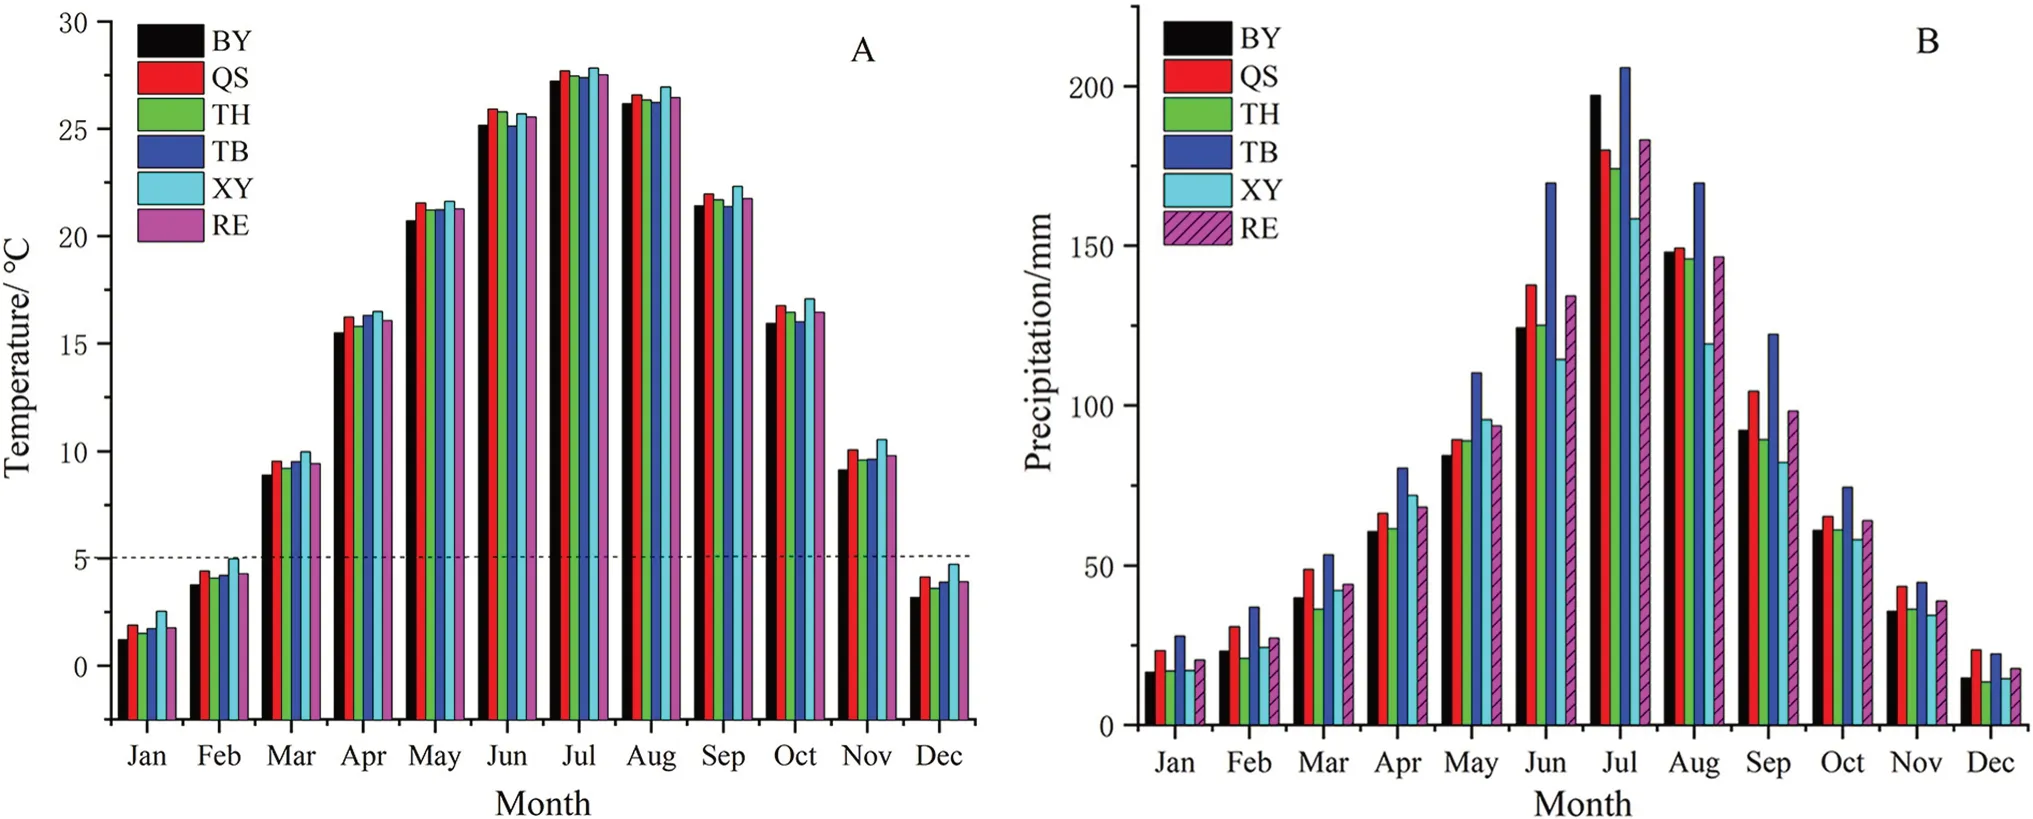
Fig.2 Mean monthly temperature (A) and precipitation (B) during 1969–2018 recorded at the five meteorological stations and regional average in the Tongbai Mountains area.BY: Biyang;QS: Queshan;TH: Tanghe;TB: Tongbai;XY: Xinyang;RE: regional
The selection of meteorological stations is crucial in tree-ring research.Climatic data often differ due to the microenvironments of each meteorological station.In a dendrochronological study,the correlation between tree growth and various climate factors are analyzed using climatic data from almost all the surrounding meteorological stations,and then the climatic data from the weather stations that had the best correlation with tree growth are selected for climatic reconstruction.The five meteorological stations around the two sampling sites in the Tongbai Mountains (Fig.1) that we selected are located in different locations and slope orientations around the Tongbai Mountains.Xinyang is south of the two sample sites and has the highest monthly mean temperature,while Queshan is on the south slope of the northern Tongbai Mountains and has the second highest monthly mean temperature (Fig.2).Biyang is on the north slope of the Tongbai Mountains and has the lowest monthly mean temperature.Mean annual temperature of five meteorological stations showed highly consistent correlations from 0.815 to 0.976(p<0.001),and a warming trend from 1969 to 2018(Fig.3A).Correlations for the annual precipitation at the five stations ranged from 0.511 to 0.826 (p<0.001).The regional precipitation showed a slightly downward trend during 1969–2018 (Fig.3B).Overall,the consistency of the mean annual temperatures from the five stations in the study area is higher than for precipitation,indicating the spatial homogeneity of temperature is better than precipitation.Nonetheless,there is a slight difference in warming rate of each weather station,which may also be the result of the difference in their microenvironment.
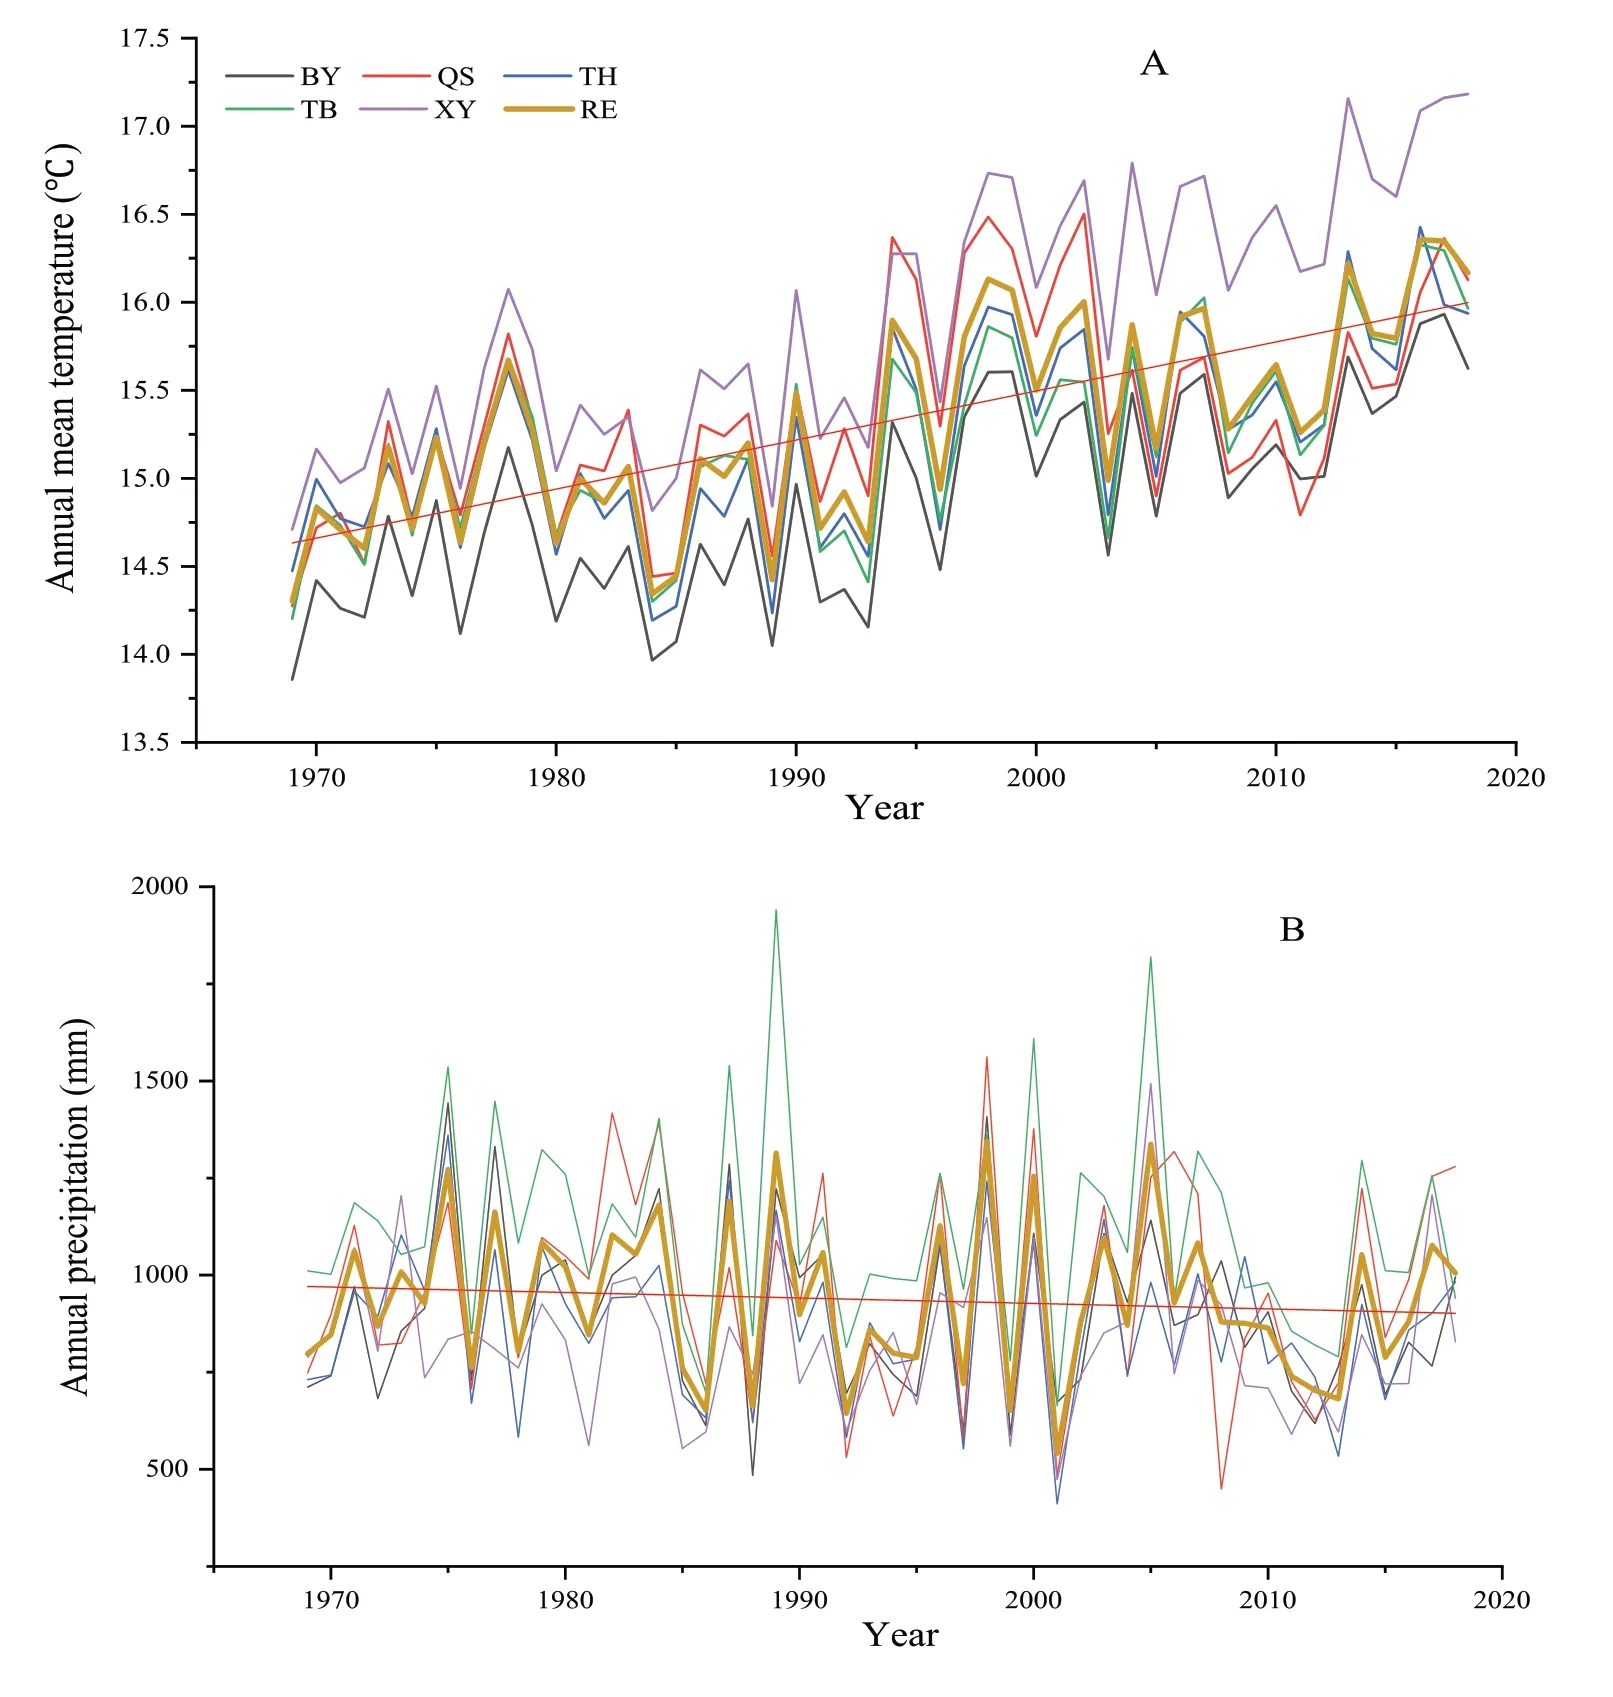
Fig.3 Annual mean temperature (A) and annual total precipitation (B) recorded at the five meteorological stations and regional average for 1969–2018.The straight red line in each panel represents the regional trend.BY: Biyang;QS: Queshan;TH: Tanghe;TB:Tongbai;XY: Xinyang;RE:regional
The normalized difference vegetation index (NDVI)data were derived from the NOAA Climate Data Record(CDR) of Advanced Very High Resolution Radiometer(AVHRR) Surface Reflectance (Vermote 2019).The NDVI data as an indicator of forest health were taken from the NOAA AVHRR Global Area Coverage (GAC) version 5,which is provided at the 0.5-grid resolution by the Royal Netherlands Institute for Climate Research (http:// clime xp.knmi.nl).Regional NDVI data (32–33° N,113–114°E) around the sampling sites were selected to measure regional forest growth during 1981–2018.
Tree-ring data
In March 2021,we collected tree-ring samples ofP.massonianafrom two sites on different slopes at Dongchansi in the Tongbai Mountains (Fig.1,Table 1): site DCS08(32°21′35.45″ N,113°19′18.32″ E,645 m a.s.l.) on the southeastern slope and site DCS09 (32°21′33.17″ N,113°19′18.13″ E,676 m a.s.l.) on the northeastern slope.Using standard methods for dendrochronology (Stokes and Smiley 1968;Cook and Kairiukstis 1990),two cores were generally extracted from each tree using an increment borer at breast height.In total for DCS08 and DCS09,32 and 36 cores were respectively collected from 17 to 19 healthy trees.Samples were brought to the laboratory,air dried,mounted in a wooden trough and sanded with progressively finer sandpaper to discern the ring boundaries.Samples were visually cross-dated to identify false rings or absent rings.The boundary of earlywood (EW)and latewood (LW) was determined based on the method of Stahle et al.(2016).Each EW/LW width was measured to the nearest 0.001 mm using the Velmex measuring system (Bloomfield,NY,USA).The width sequences of earlywood (EWW),latewood (LWW),and total tree-ring(TRW) were obtained,and the accuracy of their cross-dating and measurements were checked using the COFECHA program (Holmes 1983).The successfully cross-dated series were conservatively standardized to remove nonclimatic trends resulting from tree age and stand dynamics using a linear function or negative exponential function via the ARSTAN program (Cook and Holmes 1986).Finally,standard EWW/LWW/TRW chronologies were developed for the southeastern and the northeastern slope (Fig.4).The relevant statistics for the chronologies are in Table 1.

Table 1 Information for treering samples and chronological statistics for EWW (earlywood width),LWW (latewood width),and TRW (tree ring width)

Fig.4 Standard TRW (tree ring width),EWW (earlywood width),and LWW (latewood width) chronologies (A,C) and sample sizes (B,D) for trees from the southeastern slope(A,B) and northeastern slope(C,D)
Statistical analyses
Pearson’s correlations were calculated between the EWW/LWW/TRW chronologies and monthly climate factors to determine the main factors limiting radial growth ofP.massonianaon the different slopes.The correlations were calculated with monthly mean temperature (T) and month total precipitation (P) for 21 months from the prior March to current November during 1969–2018.Moreover,the correlations of the chronologies with the NDVI were calculated for 10 months from January to October during 1981–2018.Dendroclim2002 software was used for all these correlation analyses (Biondi 2000).Finally,the stepwise regression models between tree growth and climate factors (including NDVI) and the main limiting factors were established using the SPSS software version 26 (IBM,Armonk,NY,USA).
Results
Chronology statistics and growth differences
A longer chronology,from 1897 to 2020,was developed at DCS08 on the southeastern slope,the shorter one was from 1962 to 2020 for DCS09 on the northeastern slope of the Tongbai Mountains (Table 1).During the common period 1978–2013,high values for the expressed population signal(EPS),signal to noise ratio (SNR) and mean sensitivity (MS)indicated that all chronologies contain high levels of climatic signals,but these statistics for the chronologies from the southeastern slope were higher than those from the northeastern slope.In contrast,serial correlations of chronologies from the southeastern slope were generally lower than those from the northeastern slope.
The correlations among the six chronologies were all above 0.55 (p<0.01),indicating that overall,all chronologies from the southeastern and northeastern slopes had a high level of consistency (Table 2).The highest correlation was generally between TRW and EWW chronologies,while the lowest correlations were between EWW and LWW chronologies.The correlations (0.984,0.975,0.935) among the TRW,EWW,and LWW chronologies from the southeastern slope were higher than those (0.973,0.791,0.69) of the chronologies from the northeastern slope,indicating that the growth of EW and LW differed between the two sampling sites.The correlation between the two TRW chronologies was the highest (0.779),while the correlation between the two LWW chronologies was the lowest (0.572),indicating that there was a significant difference in the late growing period of trees between the two sites on different slopes.Taken together,the TRW/EWW/LWW chronology consistency and values for MS,SNR,and EPS on the southeastern slope were generally higher than those on the northeastern slope.

Table 2 The correlations among TRW (tree ring width),EWW (earlywood width),and LWW (latewood width) chronologies on the southeastern (DCS08) and northeastern (DCS09) slopes
Climate-growth relationships
Correlation results showed that monthly mean temperatures in the current March and August have the most significant positive correlations with the TRW/EWW/LWW chronologies on the southeastern slope (Fig.5A,C,E).Significant positive correlations with the prior August temperature were also found for the three chronologies on the southeastern slope,albeit the correlations were only marginally significant.On the northeastern slope,significant positive correlations with the current March and August temperature were also found for the three types of chronologies (Fig.5B,D,F),but the correlations were generally weaker than those on the southeastern slope.No significant positive correlations with the prior August temperature were found for the three chronologies on the northeastern slope.Overall,temperature from the Queshan Station had the most significant correlations with the chronologies on both slopes.The highest positive correlations were found between the current August temperature and LWW series on the southeastern slope (r=0.546) and between the current August temperature and TRW series ion the northeastern slope (r=0.531).
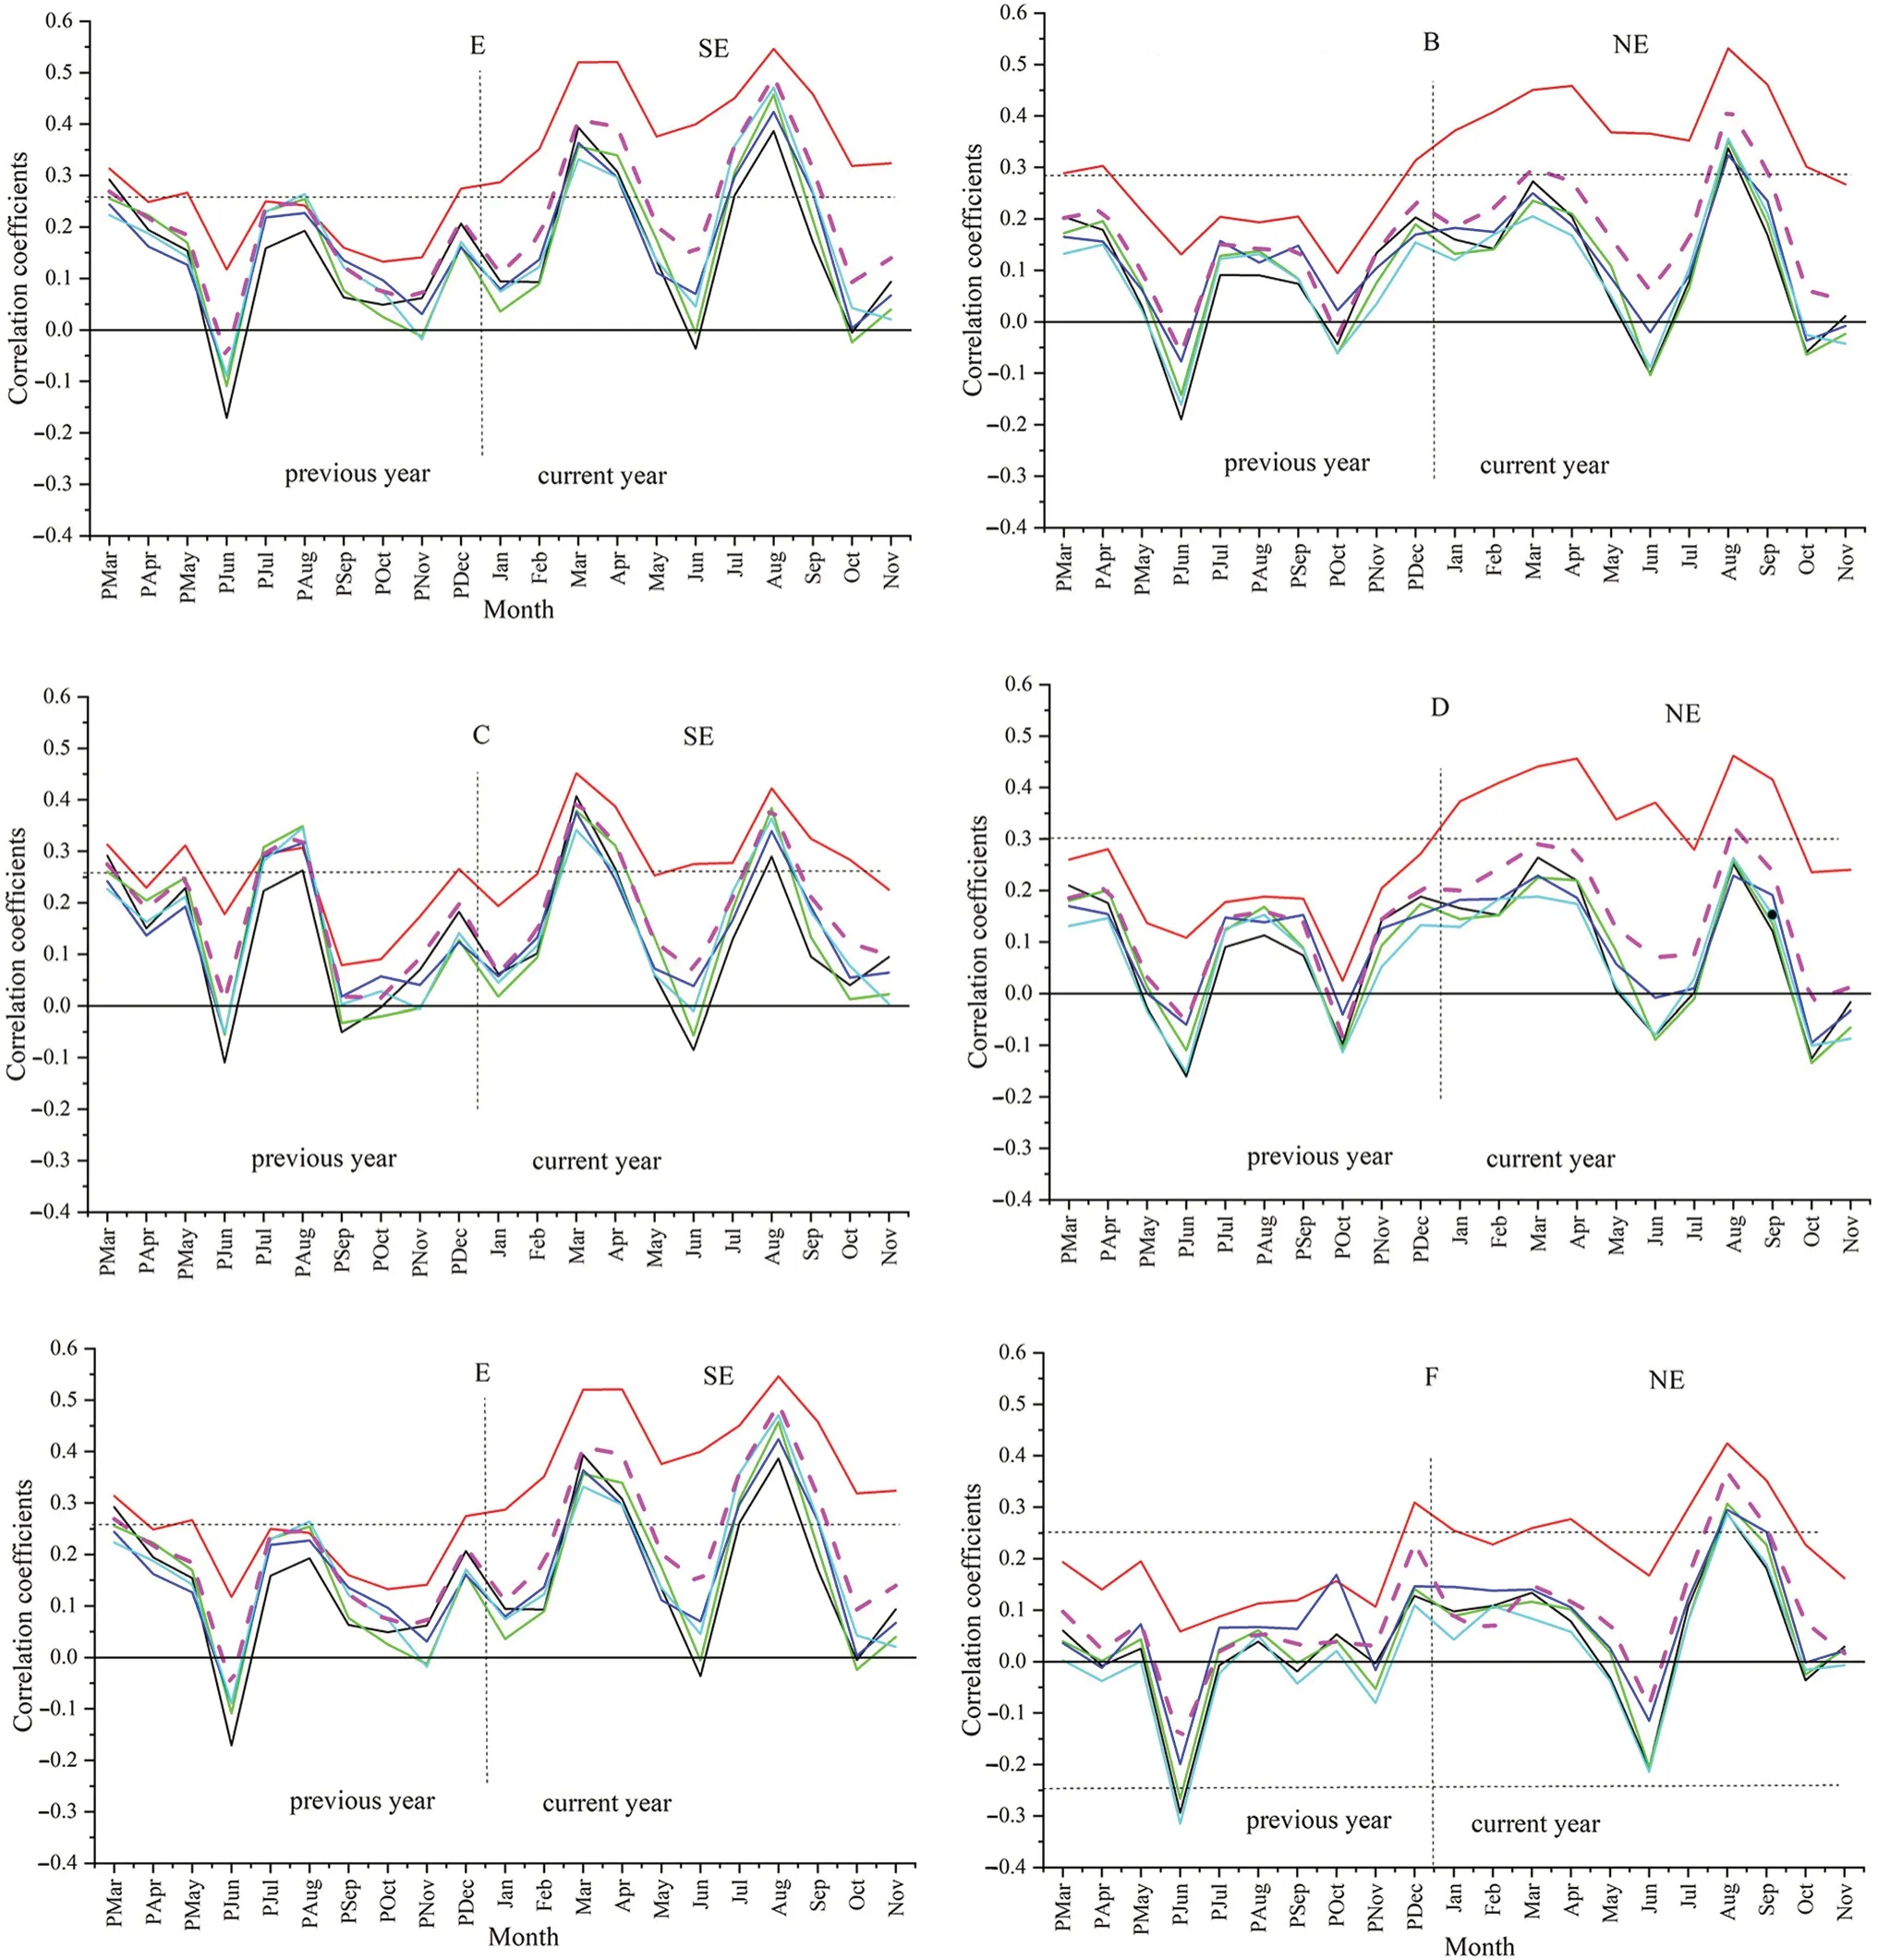
Fig.5 Correlation coefficients for the relation of the TRW,EW,and LW chronologies for trees on the southeastern slope (SE;A,C,E)and the northeastern slope (NE;B,D,F) with mean monthly temperature at the five meteorological stations and the regional climate during 1969–2018.The horizontal dotted lines represent the 95% confi-dence level.BY: Biyang;QS: Queshan;TH: Tanghe;TB: Tongbai;XY: Xinyang;RE: regional.The vertical lines represent the boundaries between the previous year and the current year.PMar: March in the previous year.Jan: January in the current year
Similarly,the correlation results showed that the effects of precipitation on tree growth on the southeastern slope were highly consistent (Fig.6A,C,E),wherein the TRW/EWW/ LWW chronologies had significant negative correlations for the prior July,and significant positive correlations for the prior April,prior September and current April.On the northeastern slope,the correlations of the three chronologies with precipitation were complex (Fig.6B,D,F).Figure 6 B showed that TRW chronology had significant positive correlations for the prior September to November and current October,and significant negative correlation in current February.The EWW chronology showed a similar correlation pattern to the TRW chronology,even though the correlations were overall weaker (Fig.6D).The LWW chronology showed a different response to precipitation compared with the TRW and EWW chronologies.The most significant positive correlation with precipitation was in the prior September,and it had no significant correlations in the current October (Fig.6F).Overall,precipitation in the current April did not affect tree growth on the northeastern slope,but was a critical factor for tree growth on the southeastern slope.
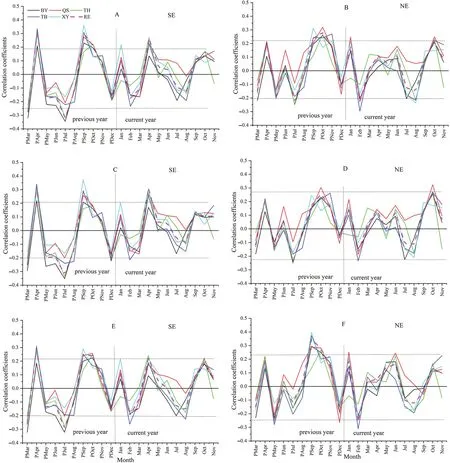
Fig.6 Correlation coefficients for the relation of the TRW,EW,and LW chronologies for trees on the southeastern slope (SE;A,C,E)and the northeastern slope (NE;B,D,F) with mean monthly total precipitation at the five meteorological stations and the regional climate during 1969–2018.The horizontal dotted lines represent the 95% confidence level.BY: Biyang;QS: Queshan;TH: Tanghe;TB:Tongbai;XY: Xinyang;RE: regional.The vertical lines represent the boundaries between the previous year and the current year.PMar:March in the previous year.Jan: January in the current year
NDVI-growth relationships
The correlation analyses between the EWW/LWW/TRW chronologies and NDVI showed that there was a good consistency at the two sampling sites (Fig.7).Significant positive correlations with the NDVI were found for the current June at both sites,but the correlation values were much higher for the southeastern slope (0.78,0.8,0.75) than those on the northeastern slope (0.5,0.49,0.32).Similarly,positive correlations with NDVI in the current September were significant for the southeastern slope but not for the northeastern.The above results indicated that the relationship of tree growth with the NDVI on the southeastern slope was better than on the northeastern slope.
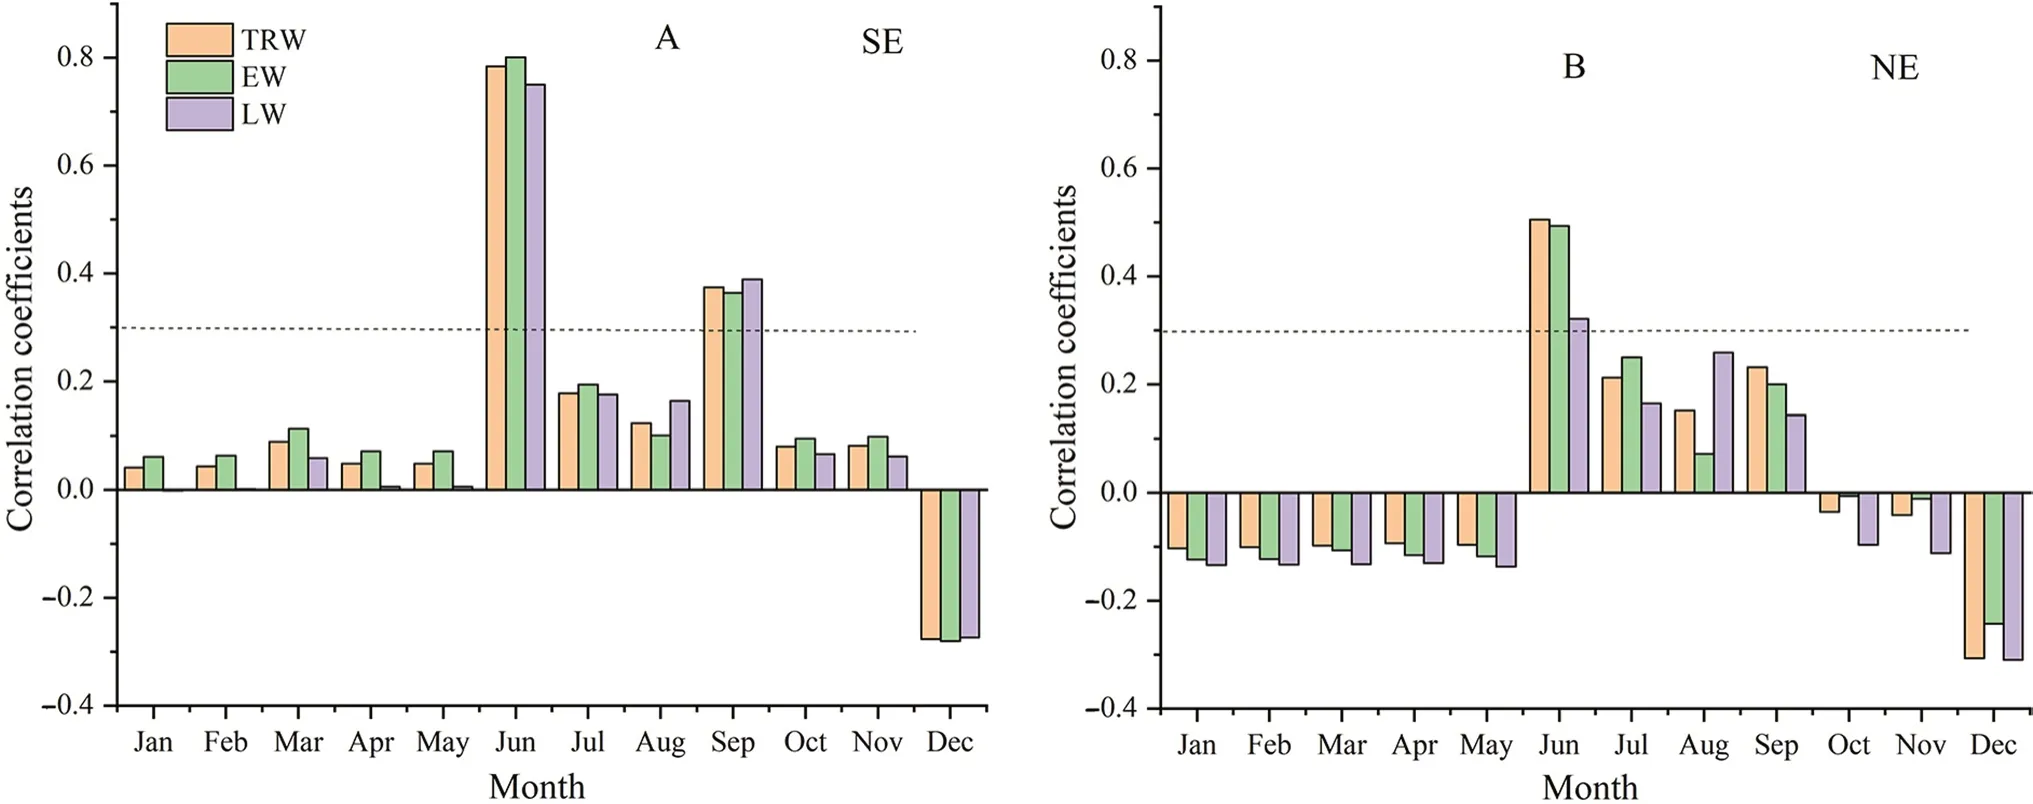
Fig.7 Correlation coefficients for relation of the TRW,EW,and LW chronologies for tree growth on the southeastern slope (SE;A) and northeastern slope (NE;B) with the NDVI during 1981–2018.The horizontal dotted lines represent the 95% confidence level
Multiple regression models and main limiting factors
The above correlation analyses showed that the temperature recorded at Queshan Station had a higher correlation with tree growth than that at the other stations.Hence,the stepwise linear regression analyses between tree growth and climate factors at Queshan were performed to establish a series of climate-growth models.Independent variables include temperature and precipitation in Queshan Station from January to October during 1970–2018,and NDVI from January to October during 1981–2019.The main limiting factors by stepwise regression models are shown in Table 3.
The Enchanter waited until the King and Queen had seated themselves upon their throne, and then, taking his place between them, he began solemnly: My name is Grumedan

Table 3 Limiting factors(Variable X) in stepwise regression models using climate data from the Queshan station and regional NDVI
The results of the stepwise linear regression analyses showed that temperature in the current August was the main limiting factor on both slopes,but only precipitation in the current October had a significant effect on EW growth on the northeastern slope (Table 3).The single climatic variable that explained the most variance for tree growth was the current August temperature,which explained 30.5% of the total variance in LW growth on the southeastern slope (F=20.599,p<0.001).
The results of the stepwise regression analyses showed that the TRW/EWW/LWW growth on the southeastern and the northeastern slope reflected the change in NDVI well for the current June (Table 3).Similarly,the relationship between tree growth and NDVI change on southeastern slope is better than that on northeastern slope.The TRW/EWW/LWW chronologies of the southeastern slope explained over 50% of the total NDVI variances in June.
Discussion
Microenvironment affects the response of tree growth to climatic factors
Effects of microenvironment on tree growth
P.massonianais a typical subtropical tree species that prefers light and temperature and typically grows on ridges and sunny slopes with an annual average temperature of 13–22ºC and annual precipitation of 800–1800 mm.The samples ofP.massonianain the study were collected from both southeastern and northeastern slope in the Tongbai Mountains.The growing conditions on the southeastern slope are conducive to the growth ofP.massoniana,whereas the semisunny northeastern slope receives less precipitation and is less favorable for the growth ofP.massoniana.Therefore,chronology statistics (MS,SNR,EPS) for the EWW/LWW/TRW chronologies from the southeastern slope were higher than those for the northeastern slope during 1978–2013(Table 1),reflecting the influence of the microenvironment.
Response of tree growth to climate factors in different environment
The Queshan meteorological station is south of the Tongbai Mountains with a microenvironment similar to the sampling sites on the two slopes.Therefore,the correlations between tree growth (including TRW/EWW/LWW) and temperature at the Queshan station are the highest (Fig.4).All correlations showed that tree growth were greatly affected by temperature in the current March and August.March is the beginning of the growing season in the study area,when high temperature is beneficial for germination and tree growth(Cao et al.2012),especially the formation of EW.The high temperature and rain in August during the monsoon rainy season,are conducive to rapid growth and thus beneficial to the growth of EW and LW,and finally the TRW.Similarly,Qiao et al.(2019) found that temperature was the main limiting factor on different slopes in Jiangle,Fujian Province,China.Wang et al.(2011) showed a great difference in north subtropical regions of China,in which tree growth ofP.massonianahad significant positive correlations with monthly mean temperature in the prior June and July and current January,August,and September in Nanzheng County,Shanxi Province,while only a significant negative correlation with the current May in the Jigong Mountains,Henan Province.Gu et al.(2020) analyzed EW and LW forP.massonianain the Tongbai Mountains (32°24′ N,113°16′ E,509 m) and also found that temperature has a great influence on EW,but their results suggest that September temperature instead of August temperature was most crucial for tree growth in the area,possibly as a result of an altitude difference.
Trees growing on different slopes have different responses to precipitation.The consistency of tree growth on the southeastern slope in response to precipitation of all meteorological stations is better than on the northeastern slope (Fig.5).Nonetheless,growth of trees at both sites exhibited a lagged effect of precipitation in the prior September/October.By September,the monsoon rain belt has moved from the study area,and precipitation becomes critical to alleviating hightemperature induced drought and growth of EW and LW(Harley et al.2012;Huang et al.2018;Liang et al.2019).Tree growth (especially EW) on the southeastern slope was also greatly affected by precipitation in the current April.High temperature and intensified evaporation in April lead to severe spring drought.Precipitation can then supply water for tree growth and promote EW formation.
The stepwise linear regression model results suggest that only EW growth on the northeastern slope was greatly influenced by precipitation in the current October;likely the long growing season in the subtropical region and continuing high temperature in October prolongs the EW formation.Therefore,precipitation in October was positively correlated with tree growth and benefited EW formation.Using a microsampling approach,Huang et al.(2018) found that xylem growth ofP.massonianain subtropical China peaked in the current autumn (September–November),with the highest rate of cell division when the climate is warm and dry,which further supports our results.However,the results from the Jigong Mountains are different from ours;Wang et al.(2011) found that precipitation in May had significant positive correlation with tree growth.Gu et al.(2020) showed that the LW in the Tongbai Mountains is greatly affected by precipitation in November and December;thus,the influence of precipitation on LW also differed from our results,perhaps due to differences in microenvironments and altitudes.
Temperature due to the influence of atmospheric circulation is spatially more homogeneous than precipitation affected by topography,so the correlations between tree growth and the temperature among the different meteorological stations were highly consistent.Because precipitation is greatly affected by the local environment,the correlations between tree growth and precipitation for the various meteorological stations differed to some extent.When the meteorological stations had similar microenvironment,such as at Biyang and Xinyang stations north of the Tongbai and Jigong Mountains,then the correlations were highly consistent with tree growth.Therefore,the microenvironments for the tree sites and meteorological stations need to analyze to better understand climate–growth relationship and achieve reliable climate reconstructions.
Relationships of tree growth and regional NDVI
The NDVI is an indicator of forest health,so the study of the relationship of tree-rings and NDVI is beneficial to understanding forest landscape change.Microenvironment not only influences the physiology of tree growth,but also affects the canopy greenness index,NDVI.As discussed earlier,P.massonianatypically grows better on a sunny slope than a semi-sunny slope.Therefore,the correlations between the TRW/EWW/LWW chronologies for trees on the southeastern slope and June NDVI were much higher than those on the northeastern slope.However,there were also significant positive correlations between the TRW/EWW/LWW chronologies for trees on the southeastern slope and September NDVI.Wang et al.(2011) reported similar results for the northern subtropical region in China: the NDVI for Nanzheng County had significant negative correlations with treering chronology in March,August,and December,while the NDVI for Jigong Mountain had a significant positive correlation with tree-ring chronology in September.Although both are located at the northern margin of the subtropical zone,the relationship between tree-rings and NDVI found by Wang et al.(2011) differed greatly from the results of the present study due to differences in the microenvironments.Similar results with the highest correlation with NDVI in August were found in Delingha (He and Shao 2006) and the western Qilian Mountains (Wang et al.2010).
Conclusions
We developed standard EWW,LWW,and TRW chronologies using samples ofP.massonianacollected from two sites that differed in slope aspect and thus microenvironment on the Tongbai Mountains,Central China.Our analyses of these chronologies and their correlations with climatic factors showed that the chronology consistency and mean sensitivity (MS),signal to noise ratio (SNR) and expressed population signal (EPS) for trees on the southeastern slope were much higher than those on the northeastern slope.The mean temperature in the current March and August had significant positive effects on TRW/EWW/LWW at the two sampling sites.Precipitation in April and October tended to promote tree growth,but precipitation in the prior July and current February tended to inhibit tree growth.The above temperature and precipitation effects on the northeastern slope were generally weaker than on the southeastern slope.Stepwise linear regression showed that temperature in the current August is a major limiting factor for growth on both slopes,but only precipitation in current October had significant effect on EW growth on the northeastern slope.Similarly,the relationship of tree growth on the southeastern slope with the NDVI was better than that on the northeastern slope,and the highest correlation between tree growth and NDVI was found on the southeastern slope in June.Overall,these results suggest that microenvironment plays a critical role in tree growth,which should be appropriately considered when studying forest dynamics and developing models for climate reconstruction.
AcknowledgementsThe authors thank the National Field Scientific Observation and Research Station of Forest Ecosystem in Dabie Mountains,Henan Province.
杂志排行
Journal of Forestry Research的其它文章
- Physiological and psychological responses to tended plant communities with varying color characteristics
- Climate‑change habitat shifts for the vulnerable endemic oak species (Quercus arkansana Sarg.)
- Plant growth and metabolism of exotic and native Crotalaria species for mine land rehabilitation in the Amazon
- Peat properties of a tropical forest reserve adjacent to a fire-break canal
- Impact of cattle density on the structure and natural regeneration of a turkey oak stand on an agrosilvopastoral farm in central Italy
- Climate-growth relationships of Pinus tabuliformis along an altitudinal gradient on Baiyunshan Mountain,Central China