Ecological network analysis reveals complex responses of tree species life stage interactions to stand variables
2024-01-26HengchaoZouHuayongZhangToushengHuang
Hengchao Zou · Huayong Zhang · Tousheng Huang
Abstract Tree interactions are essential for the structure,dynamics,and function of forest ecosystems,but variations in the architecture of life-stage interaction networks (LSINs)across forests is unclear.Here,we constructed 16 LSINs in the mountainous forests of northwest Hebei,China based on crown overlap from four mixed forests with two dominant tree species.Our results show that LSINs decrease the complexity of stand densities and basal areas due to the interaction cluster differentiation.In addition,we found that mature trees and saplings play different roles,the first acting as “hub”life stages with high connectivity and the second,as “bridges”controlling information flow with high centrality.Across the forests,life stages with higher importance showed better parameter stability within LSINs.These results reveal that the structure of tree interactions among life stages is highly related to stand variables.Our efforts contribute to the understanding of LSIN complexity and provide a basis for further research on tree interactions in complex forest communities.
Keywords Tree interactions · Life stages · Interaction networks · Ecological complexity
Introduction
Understanding plant interactions is essential to appreciate various complex ecological processes of growth,community assembly,and biogeochemical cycling (Montgomery et al.2010) and allow us to deduce drivers of the diversityecosystem functioning relationship (Trogisch et al.2021).In forest ecosystems,the relative importance of tree interactions may shift over life stages (Newbery and Stoll 2013;Piao et al.2013).Life stages can regulate tree interactions and conversely,interactions among life stages affect community dynamics and species coexistence (Armas and Pugnaire 2009;Chu and Adler 2015).Assessing tree interactions among multiple life stages will help identify the underlying mechanisms of ecosystem structure and diversity maintenance (Zhu et al.2015).
Previous studies have evaluated plant interactions among life stages by plant fitness,such as seed fecundity (García-Cervigón et al.2016),individual survival (Pu and Jin 2018),or root dry mass (Schlau et al.2021).These classical methods involve measuring the performance of individuals with and without neighbours (Díaz-Sierra et al.2017).Methods for understanding the mechanisms of plant interactions need to reveal the dynamic complexity among different life stages(Losapio et al.2018),while most previous studies have simplified the complexity of natural communities (Wang and Li 2016).In recent years,mathematical models for quantifying plant interactions have continued to improve (Adler et al.2018;Hart et al.2018;Kikvidze and Brooker 2019).In particular,models that can overcome the limitations of classical methods (Damgaard and Weiner 2021),such as time-series analysis (Damgaard and Weiner 2017) and higher-order interaction (Grilli et al.2017),have been widely applied for decades.However,there is concern about empirically based models for their gross inaccuracy (Rinella et al.2020),and the complexity of plant interactions has been overlooked,limiting our knowledge about the organization of plant communities (Losapio et al.2019).
To address these limitations,ecological network analysis has emerged as a robust framework for exploring the complexity and dynamics of ecosystems (Pilosof et al.2017).One of the significant obstacles in ecological network analysis is constructing meaningful interaction networks (Morales-Castilla et al.2015).Traditional ecological network studies generally took species as nodes and their interactions as edges (Nakagawa et al.2016).In mixed forests,species coexistence forms a complex interaction network,influencing the maintenance and dynamics of ecological communities (Mougi and Kondoh 2012).Such species-based networks have various intra-and interspecific interactions (Subrahmaniam et al.2018).However,speciesbased networks fail to describe the heterogeneities among individuals (Ings et al.2009;Guimaraes 2020).Individual heterogeneity can shape life stage trajectories and directly affect community structure when plant interactions depend on individual traits (Hamel et al.2018).For example,multiple life stages may occur within a species,and the differences among life stages can alter the network structure(Nakagawa et al.2016).
Incorporating life stages into network analysis would provide a practical approach to resolving how complexity affects the stability of ecological networks (Rudolf and Lafferty 2011).Although some plant interaction networks based on mature-seedling stages have been proposed (Losapio et al.2018;Kinlock 2021),factors driving the complexity of interaction networks among multiple life stages in mixed forests remain unclear.Thus,based on mathematical formalism to embrace ecological complexity (Strydom et al.2021),developing a tree interaction network with life stages as nodes,would be expected to reveal the intricate nature of tree interactions across forests.
In this study,the life-stage interaction network (LSIN)is introduced to analyze tree interactions.The strength of interactions among plants varies with life stages because of the differences in niches and nutrient requirements (Tomiolo et al.2022).Thus,the hypothesis that certain life stages occupy disproportionate importance in their association with others would be reasonable.In this study,the LSINs and their parameters are quantified for four life stages of each tree species in the mountainous forests of northwest Hebei,China.These networks were based on individual tree networks,and links were defined as the tree crown overlap related to light interception (Pretzsch 2014;Ding et al.2022).Four LSIN-level parameters were then selected to quantify the connectivity and complexity,combined with four LSIN size-level parameters to quantify the connectedness and centrality of each life stage.Finally,the stability of life stages in LSINs was determined.The following questions are addressed concerning the complexity and dynamic processes of tree interactions: (1) How does the complexity of LSINs vary across forests with different stand variables?(2) What are the driving factors behind observed shifts in LSIN structures? and,(3) Which life stages play pivotal roles in LSINs?
Materials and methods
Study area
This study was carried out in four sites in the Chongli District,Zhangjiakou City in Hebei Province.Approximately 80% of the territory is mountainous with a forest cover of 52.4% (Zhang et al.2021a).The elevation is 1700–2100 m a.s.l.,the mean annual temperature is 3.7 °C,and mean annual precipitation 483.3 mm (Song et al.2018).The forest ecosystems are deciduous broad-leaved and coniferous forests (Zhang et al.2021b).Soil types are mainly luvisols and podzols,with pockets of leptosols and gleysols,according to the IUSS Working Group WRB 2022.The dominant tree species are birch (Betula platyphyllaSuk.) and larch (Larix principis-rupprechtiiMayr.),which form three typical stand types: pure birch secondary forests,pure larch plantations,and birch-larch mixed forests.
Data collection
In 2019 and 2020,four 1-ha birch-larch mixed forest plots were selected and enclosed to prevent human disturbance.All have a similar aspect and soil type (Table 1).Each plot contains four replicated blocks at 10 m intervals.From July to October,trees in the four plots with diameter at breast height (DBH) ≥ 1 cm were tagged,measured,and positioned.DBH was measured by a vernier caliper (0.01 cm),height (H) by an altimeter (0.1 m),and position by Real Time Kinematic (RTK,1 cm).Forty-three birch trees and 37 larches outside the blocks were randomly selected to determine crown width (CW).Based on the DBH classes and field survey,all trees were divided into four life stages (Zhou et al.2019): (a) saplings,1 cm ≤ DBH <5 cm;(b) juveniles,5 cm ≤ DBH <10 cm;(c) sub-adults,10 cm ≤ DBH <15 cm;(d) mature,DBH ≥ 15 cm (Table 1).

Table 1 Stand properties of four plots
Network construction
The zone of influence (ZOI) is a circular area around a tree where resource competition occurs (Berger and Hildenbrandt 2000).In plant ecology,it is a common assumption that all plants whose ZOI overlap interact by competition for resources (Grimm and Railsback 2005).The ZOI radius is measured by crown radius (Pommerening and Maleki 2014) and so the association of a pair of trees is quantified by crown overlap (Schmid et al.2020).It was assumed that each crown was a circle centred at the coordinates of the tree and the radius (r) was half of the maximum length of theCW.This assumption was for practical reasons as it reduced the computational time by several orders of magnitude (Zambrano et al.2022).
Crown radius is strongly correlated to tree diameter(Grote 2003;Bechtold 2004).Measuring the crown radius of each tree is challenging and labour-intensive.Thus,crown width was estimated by several allometric equations(Sánchez-González et al.2007;Raptis et al.2018).r-DBH equations were determined from several basic models by the fit results of birch and larch trees (Table S1).Based on the location of trees and the estimated crown radius,undirected tree networks were constructed (since we could not quantify the crown height of different individuals,the directed network was not constructed).Ifdij(distance between treeiand treej) ≤ri+rj(Fig.1),we defined the elementaij=1 in the adjacency matrix.Otherwise,we definedaij=0.

Fig.1 Construction of the undirected tree networks
LSINs were obtained from the tree networks where nodes represent all life stages,(all nodes which belong to the same species and life stages were condensed into one node),that occur in the forest plots.Ifaij=1 in the adjacency matrix,whereiandjbelong to different tree species or life stages,then we defined the elementmkl=1(kandlare two life stages) in the adjacency matrix of the LSINs.W=ωklis defined as the weighted adjacency matrix,whereωklrepresents the number of life stageskconnected with life stageslin the tree networks.
Data analyses
Biomass allocation strategies generally determine the competitive interactions among neighbouring plants (Weigelt et al.2002).Therefore,the strength of the linkages was defined by the biomass ratio of two interactive plants,and the node strength of individual treeiwas calculated by:
wherenis the number of interactive neighbour trees,jthe individual interactive tree,andAGBthe aboveground biomass,which is also calculated by non-linear equations (birch:AGB=0.0011DBH3.46H0.43;larch:AGB=0.0379DBH2.56H0.08).The interactive neighbour trees were defined in the same way.To prevent edge effects,5-m wide buffer zones were designed around the four blocks in each plot.Individuals in the buffer zones were connected as network nodes but not as focal trees.
Four parameters were used to describe the overall associations of all life stages (the LSIN-level parameters): the edge density,average path length,and diameter were used to quantify the connectivity of LSINs,and the average clustering coefficient was used to quantify the complexity (Table 2).The importance of life stages in LSINs was described by the four parameters.The node degree and closeness represented the connectedness of each life stage;clustering coefficient and betweenness represented the centrality (Table 2).

Table 2 LSIN-level and LSIN size-level parameters describing the topology of networks
All the analyses were performed in R (version 4.2.1,R Development Core Team 2022).Tukey’s multiple comparisons tested differences in the LSIN-level parameters among the four plots with the significance level set atp≤ 0.05.To test the relationships between network parameters and stand variables,linear mixed-effect models (LMMs) were used.Stand variables were fitted as fixed factors and the plot as a random factor was used to determine the relative importance of the stand variables for network parameters.All variables were standardized (deviation from mean value/SD).Linear mixed-effects models were fitted by the functionlmerwithin the packagelme4(Bates et al.2015).Marginal coefficients of determination (R2m) to LMMs were calculated by ther.squaredGLMM(Nakagawa et al.2017).The percentage of variance explained by stand variables was determined by the packageglmm.hp(Lai and Nimon 2022).
Next,the stability of each LSIN size-level parameter across four plots was calculated to assess the importance of life stages (Eq.2).The equation of stability (Zhang et al.2017) is defined as:
whereMeanrepresents the average network parameter across sixteen blocks andSDthe corresponding standard deviation.Finally,ordinary least squares regression analyses were conducted to test the relationships between the stability and the mean of LSIN size-level parameters.
Results
Topology properties of the tree individual interaction network
The 16 ecological networks consisted of 3967 nodes (individual trees),including 1939 nodes for birch and 2028 nodes for larch.A similar node degree distribution is found in tree interaction networks (Fig.2),which can be accurately described by Gaussian distribution (normal distribution),showing a unimodal pattern.Tukey’s multiple comparison showed that there was no significant difference (p>0.05) in the average clustering coefficient,edge density,diameter,and average path length among the four plots (Fig.3).An individual tree in the mixed forest was connected to approximately 9.0 other trees (Table 3).Hence,the network edge density was high (the average density of the 16 networks was 0.8).

Fig.2 Node degree distribution of tree individual interaction networks;(a) P1,(b) P2,(c) P3,(d) P4.k: node degree;P(k): frequency of nodes with node degree k;colours represent blocks
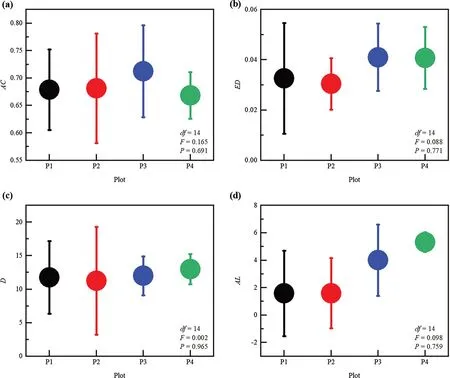
Fig.3 Topology parameters of tree individual interaction networks;(a) average clustering coefficient (AC),(b) edge density (ED),(c) diameter(D),and (d) average path length (AL) across four plots

Table 3 Description of parameters in LSINs
At the node level,the strength of interactions among individual trees was distributed differently among plots.The number of trees with strength of interaction higher than average generally increased with stand density (P1=197,P2=182,P3=260,P4=367,Fig.4).The node degree of individual trees had a similar distribution pattern to the interaction strength.The decline in DBH was more pronounced in forests with greater stand density (Fig.4d).

Fig.4 Rankings of focal tree individual strengths (tree nodes along the x axis) in each plot,node degree and DBH are also displayed;(a)P1,stand density: 884 ind.ha-1;(b) P2,stand density: 935 ind.ha-1;(c) P3,stand density: 1469 ind.ha-1;(d) P4,stand density: 1525 ind.ha-1.Dotted lines are reference thresholds set by mean values to show the number of focal trees assembled by four subplots with node strength above or below it in each plot
Variations in the complexity of LSINs along stand variables
Based on the tree individual interaction networks,LSINs were constructed for each block (Fig.5).The linear mixedeffects models showed that the average clustering coefficient,edge density,and average path length were significantly correlated with stand density;edge density and average path length were significantly correlated with the basal area (Fig.6).Average clustering coefficient and edge density significantly increased with stand variables (Fig.6a,b,f).Average path length was negatively related to stand density and basal area (Fig.6c,g).Diameter was notably statistically independent of the two stand variables,and most values were equal to 2 (Fig.6d,h;p>0.05).We also tested whether average tree height could affect the LSINs(Fig.6i–l).Across the stands,all LSIN-level parameters were statistically independent of tree height (p>0.05) except for diameter (Fig.6l).
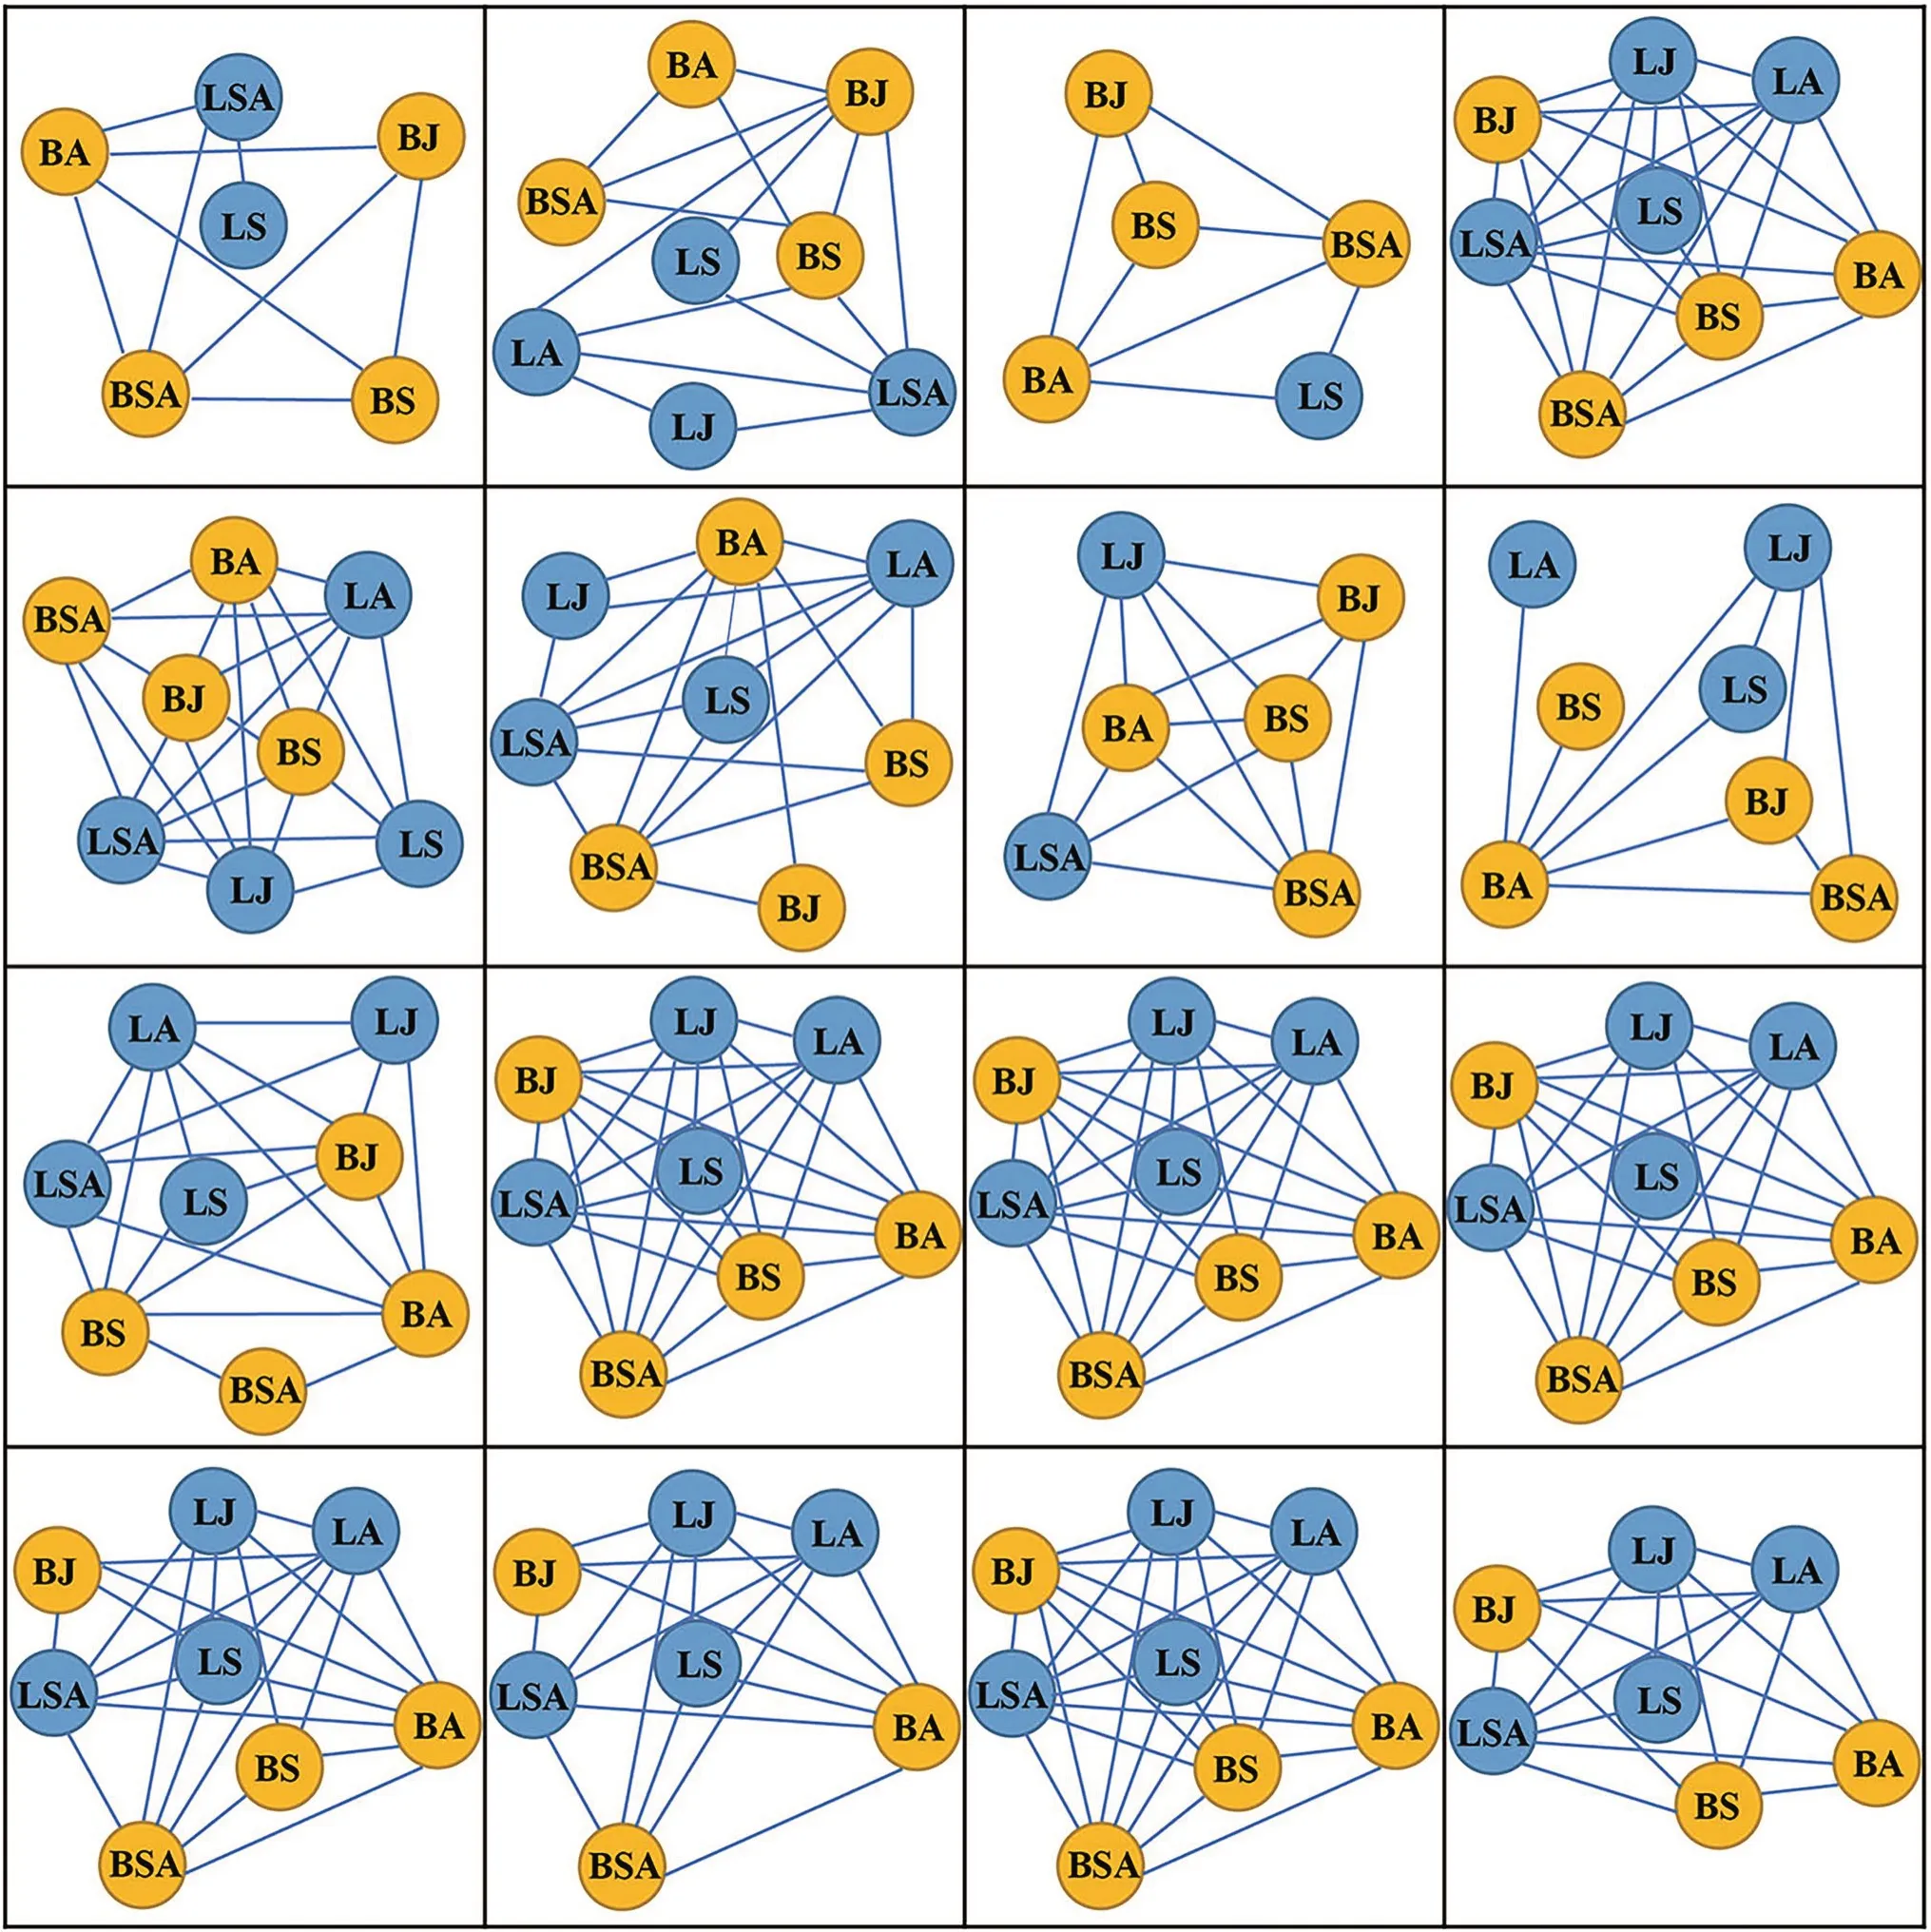
Fig.5 LSINs across 16 blocks in four forests.BS,birch saplings;BJ,birch juveniles;BSA,birch sub-adults;BA,birch adults;LS,larch saplings;LJ,larch juveniles;LSA,larch sub-adults;LA,larch adults

Fig.6 Relationships between LSIN-level parameters and stand-level variables across four forests;(a,e,i) average clustering coefficient(AC),(b,f,j) edge density (ED),(c,g,k) average path length (AL),and (d,h,l) diameter (D);black lines were fitted by the linear mixedeffects models.Shaded areas indicate 95% confidence intervals.StD stand density,BA basal area,AH average tree height
After obtaining the relationship between network structures and stand variables,the relative importance of stand density and basal area were further examined.Variations in LSIN-level parameters are mainly explained by the stand density (AC: 60.5%,ED: 52.1%,AL: 50.1%,Fig.7).Basal area explained a relatively lower percentage of variation in average clustering coefficient (17.1%) and a nearly equivalent percentage of the variation in edge density and average path length (ED:18.0%,AL: 18.6%,Fig.7).The interaction of stand density and basal area accounted for a larger percentage of the variation in average path length(31.3%) than average clustering coefficient and edge density (AC: 22.5%,ED: 29.9%,Fig.7).

Fig.7 Percentage of variation in LSIN-level parameters explained by stand-level variables;AC average clustering coefficient,ED edge density,AL average path length,StD stand density,BA basal area,StD × BA interactions between stand density and basal area
Importance and stability of life stages within LSINs
For saplings,birch always had higher node degree and closeness than larch (Table 4).However,the clustering coefficient decreased with the life stage,and adult (mature) trees had the lowest values (Table 4).The betweenness of larch showed a similar pattern,and saplings had a higher betweenness than other life stages (Table 4).For birch,mean betweenness decreased continuously with life stages (from 5.9 to 2.9) but then increased to the highest from sub-adults to adults.

Table 4 Mean values of LSINs size-level parameters across four forests
Across the stands,the stability of LSIN size-level parameters was related to the average parameter values (Fig.8).The stability of node degree,betweenness,and closeness significantly increased with the mean,though not the clustering coefficient (p>0.05).The stability of node degree and betweenness was fitted well by a linear regression (Fig.8a,c),while the stability of closeness fitted the best by the exponential function (Fig.8d).Further,the relationship between parameter value and stability was species-dependent,birch were always more consistent with this relationship than larch(Fig.8).
Discussion
Variations in the complexity of LSINs along stand variables
In many forest ecosystems,stand variables have been shown to alter plant interactions (Pranchai et al.2018;Wright et al.2018;Chaves and Rossatto 2021).Our study further analysed the complexity of the intraspecific and interspecific interactions among life stages across forests.Beyond quantifying variations in the associations among individuals,ecological networks provide new insights in identifying general features of these associations and understanding community dynamics (Bahram et al.2014).
As hypothesized,LSINs shifted across forests in the mountainous area of northwest Hebei with stand density and basal area,from more complex networks for stands with lower stand variables to simpler networks for stands with higher variables.Thus,the average clustering coeffi-cient was positively correlated with stand density and basal area,indicating increasing life-stage interaction clusters within LSINs.Similarly,a recent study revealed that forests were organized into clumps across life stages at the community level (Perea et al.2021).The findings in this research could be explained by previous studies which reported that density dependence and mechanisms of plant interactions varied among life stages (De Steven 1991;Goldberg et al.2001).Moreover,the differentiation of interactions in our study may result from the variable direction and intensity of plant interactions among life stages (Schiffers and Tielbörger 2006).In a given space with a high number of individuals,increased intraspecific competition will change the population structure (Zhao et al.2023;Getzin et al.2008).Apart from stand density,basal area is usually used to characterize crowding indices (Kunstler et al.2011).In crowded stands,size-dependent mortality is generally substantial (Luo and Chen 2011),which may also explain more clusters of life-stage interactions.In addition,variations in the complexity and connectivity of LSINs were mainly explained by stand density.In fact,plant interactions mainly depend on density (Pyke and Archer 1991).The greater contribution of stand density is similar to the well-known dependence of plant competition on neighbourhood density,often referred to as the “competition-density rule”(Kira et al.1953).In addition,the intra-and interspecific competition among trees begin when the canopy closes and competition intensities increase with stand density (Brunner and Forrester 2020).
Similarly,we found that edge density also increased with stand density and basal area.Such effects indicate that forests with high density and basal area are more likely to show significant associations among life stages and thus result in greater network density.This result is like previous studies about other tree species which noted that different growth stages had positive associations at small scales (Martínez et al.2010;Gu et al.2019).Considering additional life stages would further explore tree interaction network connectivity and complexity.Notably,the average path length showed a significantly negative correlation with stand density.As described previously,in a crowded forest,trees are more clustered (higher average clustering coefficient),and some life stages break down their original associations with each other.This result indicates that not all tree life stages have the opportunity to interact with each other,which agrees with previous studies assessing tree interactions in forests in China based on spatial point pattern analysis (Gu et al.2019;Liu et al.2020;Jiao et al.2022;Xin et al.2022).
Importance and stability of life stages within LSINs
The hypothesis that certain life stages occupy disproportionate importance in their interactions with others has received strong support from our study.The connectedness and centrality of given life stages within the LSINs were evaluated across four forests to determine their general importance.Life stages that have high node degree and closeness are considered “hub”life stages (Jalili et al.2015).As hypothesised,mature trees had higher node degrees and closeness.The size,shape,and position of the crown determine the amount of light interception (Pretzsch 2014;Williams et al.2017).Mature trees have larger crowns,causing them to shade other neighbourhood life stages.
In contrast,the betweenness of saplings was superior to other life stages.Batool and Niazi (2014) have shown that betweenness varies according to the topology while having no obvious or regular patterns.Nodes with high betweenness(saplings) could be regarded as “bridges”,controlling the flow of information between the other life stages in LSINs(Estrada et al.2009).Previous observations may explain this which showed that changes in the spatial structure across plant life stages generate a spatial footprint at the sapling stage,providing conditions for long-term interactions between older plants (Perea et al.2021).The earliest stages could date back to seed dispersal which generated many complex spatial patterns of saplings.For example,large clusters may accommodate many small clusters (Wiegand et al.2007,2009).In particular,this complex structure at the sapling stage may persist into adulthood (Moeur 1997).
In the LSINs,the stability of connectedness and centrality,namely the life stages’ general importance for the four forests,was related to the mean parameter values.Our results show that the stability of node degree,betweenness,and closeness were significantly related to their average values (p<0.05),though not the clustering coefficient.Thus,life stages with a higher importance in the LSINs could maintain their hierarchy more readily.This result broadly corroborates the findings of Losapio et al.(2018)who found that the stability of plant interaction networks was affected by life history stages.For example,mature larch maintain their shade role consistently,while saplings are more adept at serving as bridges by connecting other life stages.Life stages that have lower network parameter values are more vulnerable in their roles within LSINs,ie.,interactions between adults (or saplings) and other life stages are sturdier than those among secondary life stages (juveniles or sub-adults).Moreover,the relationship between parameter values and their stability was inconsistent between the two species.This suggests that species tend to be distributed independently along the ontogenetic gradient (Julliard et al.2006).
Implications and outlooks
In this study,the association and adaptation of tree life stages across stands were clarified,with their interactions evaluated by the ecological network analysis.Recently,plant interactions have become a central topic in evaluating the structure and dynamics of plant communities along stress gradients (He and Bertness 2014;Hortal et al.2017),leading to the development and optimization of various models (Qi et al.2018;Detto et al.2019;Rinella et al.2020).Although several methods have been explored to analyse the interactions among different life stages (Schenk and Mahall 2002;Armas and Pugnaire 2005;Cheng et al.2014;Zhou et al.2019),few studies determined the strength of life-stage associations individually or shifts of interaction networks across forests.In particular,information about the effects of multiple life stages on the complexity and stability of tree interaction networks needs to be improved (Losapio et al.2018).In contrast to the existing methods,our study detected the complexity of tree interactions among life stages by ecological networks.As a supplement to other plant interaction analyses (such ask-nearest neighbour analysis or spatial point pattern analysis),LSINs provide a better consideration of the ecological complexity and precise identification of key tree life stages.
Network analysis has successfully highlighted plant interactions (Soliveres et al.2015;Losapio and Schöb 2017;Schmid et al.2020),while this study further promoted the evaluation of the complexity of tree interaction among life stages.Our results show that LSINs became simpler along stand variables,reflecting the clusters’ differentiation of interactions between life stages under the competition-density rule.This revealed a considerable potential of LSIN parameters which highlighted the variations in intra-and interspecific interactions across forests and underlined the degree to which stand variables regulate them.Most importantly,based on the LSINs,we found that key life stages act as a hub or bridge in mixed stands in northern China.This will help in the conservation and management of tree species at specific life stages (e.g.,saplings).
Our study represents the first attempt to investigate trends in LSINs of dominant tree species.We attribute our results to the rigorous experimental design,the careful selection of plants to be measured,and the employment of more effective analytical tools.Nevertheless,this study has some limitations that should be acknowledged.Firstly,the choice of life stages may have influenced the structure of LSINs,emphasizing the need for proper selection of nodes and edges.Additionally,the use of static data from only one census limits our ability to fully capture the dynamic nature of species interactions which can be affected by various ecological processes such as germination,senescence,and regeneration.To address this limitation,future studies should incorporate life cycle dynamics and include multiple time points to capture the temporal changes in LSIN structures.In addition,to refine tree species associations and better understand the relationships between LSIN structures and stand variables,it is necessary to expand the scope of the analysis to include more species and forest communities at larger scales.The value of interaction networks will motivate greater efforts to collect more precise data,thereby improving the development and application of LSINs in forest ecology.
Conclusions
LSINs were constructed to explore tree interactions among life stages along stand variables.The results reveal that the complexity and connectivity of LSINs decreased with stand density and basal area and were primarily regulated by stand density.Mature trees and saplings have different roles,acting as hub life stages with high connectedness and as bridges that control information flow with high centrality,respectively.Moreover,life stages with more importance could increase species stability in LSINs,suggesting that they affect the development and stability of interaction networks.This study has contributed to the research gap on the response of LSIN structure to stand variables.In future research,expanding life stage interactive networks to a large scale with complex forest communities should bring valuable information to ecologists and forest practitioners in understanding ecosystem structure and determining management practices.
AcknowledgementsThanks are due to Yu Zheng,Xinxin Zhen,and Zhuoqing Bai for assistance with experiments and data processing.
杂志排行
Journal of Forestry Research的其它文章
- Physiological and psychological responses to tended plant communities with varying color characteristics
- Climate‑change habitat shifts for the vulnerable endemic oak species (Quercus arkansana Sarg.)
- Plant growth and metabolism of exotic and native Crotalaria species for mine land rehabilitation in the Amazon
- Peat properties of a tropical forest reserve adjacent to a fire-break canal
- Impact of cattle density on the structure and natural regeneration of a turkey oak stand on an agrosilvopastoral farm in central Italy
- Climate-growth relationships of Pinus tabuliformis along an altitudinal gradient on Baiyunshan Mountain,Central China