Effects of thinning on the understory light environment of different stands and the photosynthetic performance and growth of the reforestation species Phoebe bournei
2024-01-26ShichengSuNianqingJinXiaoliWei
Shicheng Su · Nianqing Jin · Xiaoli Wei
Abstract Light levels determine regeneration in stands and a key concern is how to regulate the light environment of different stand types to the requirements of the understory.In this study,we selected three stands typical in south China(a Cryptomeria japonica plantation,a Quercus acutissima plantation,and a mixed stand of both) and three thinning intensities to determine the best understory light environment for 3-year-old Phoebe bournei seedlings.The canopy structure,understory light environment,and photosynthesis and growth indicators were assessed following thinning.Thinning improved canopy structure and understory light availability of each stand;species composition was the reason for differences in the understory light environment.Under the same thinning intensity,the mixed stand had the greatest light radiation and most balanced spectral composition.P. bournei photosynthesis and growth were closely related to the light environment;all three stands required heavy thinning to create an effective and sustained understory light environment.In a suitable understory light environment,the efficiency of light interception,absorption,and use by seedlings was enhanced,resulting in a higher carbon assimilation the main limiting factor was stomatal conductance.As a shade-avoidance signal,red/far-red radiation is a critical factor driving changes in photosynthesis and growth of P. bournei seedlings,and a reduction increased light absorption and use capacity and height: diameter ratios.The growth advantage transformed from diameter to height,enabling seedlings to access more light.Our findings suggest that the regeneration of shade-tolerant species such as P.bournei could be enhanced if a targeted approach to thinning based on stand type was adopted.
Keywords Thinning · Understory light environment ·Phoebe bournei · Photosynthetic performance · Growth performance
Introduction
Sustainable forest management often uses economically and ecologically valuable tree species to enhance the structure and quality of stands (Schwartz et al.2015).In the process,the understory light environment has received considerable attention (Cogliastro and Paquette 2012;Gustafsson et al.2016;Santos and Ferreira 2020) because improving light availability is closely associated with promoting tree growth and stand development and hence,determines future silvicultural benefits (Forrester 2017).Following a comprehensive analysis of the stands’ complexity and the ecological strategy of reforestation species,the understory light environment can be regulated to improve growth to achieve management goals (Daryaei et al.2019).
The canopy determines the quality of the understory light environment (Forrester et al.2018;Orman et al.2021) by intercepting sunlight and thereby directly influencing the radiation intensity and spectral composition that reaches the understory through reflection,transmission,and absorption(Lochhead and Comeau 2012;Schwartz et al.2015).Crown configuration varies by tree species and the structure of the canopy is determined by the constituent species (Ellsworth and Reich 1993).Canopy structure is a major driver of light diversity during secondary forest succession.For example,successive changes in canopy structure were responsible for changes in light conditions in 14 secondary forest stands in southeastern Mexico (Matsuo et al.2021).Within a forest stand,there are a wide range of light gradients and understory plants compete for light resources (Ishii et al.2004;Niinemets 2010;Forrester et al.2018).Silvicultural measures such as thinning are the simplest,most direct,and most reliable way of changing the canopy structure to provide target species with their optimal light environment and to reduce competition for resources (Beaudet and Messier 2002;Wiener 2010;Santos et al.2020).Changing light conditions affects the growth and development of plants throughout their life cycle.Furthermore,light requirements and colonization strategies differ among species,therefore any measure that affects light availability should consider both the canopy structure and the ecological needs of the targeted species (Asanok et al.2013;Giertych et al.2015).A quantitative understanding of the effects of silvicultural measures on the light environment of different types of forest stands and an analysis of the performance of species in the understory are important for quantifying ecosystem dynamics and the application of forest practices (Dumais et al.2018;Daryaei et al.2019).When planting targeted species under different canopies,structure modification to control the light environment should be performed in a specific manner.
The leaf is the most sensitive and adaptable organ with regards to changes in light levels,and several studies have shown that the degree of photosynthetic plasticity can indicate the light requirements of a species (Li et al.2017;He et al.2019;Santos and Ferreira 2020).Photons are intercepted,absorbed,and utilized by leaves to complete photosynthesis and assimilate carbon (Dahlgren et al.2006;Santos and Ferreira 2020).Leaf photosynthetic pathways represent the basic mechanisms by which plants respond to changes in light resources (Poorter and Bongers 2006;Santos et al.2019).Photosynthesis is driven by captured photons and depends on the wavelength of the absorbed light.Zhen and Bugbee (2020) demonstrated that far-red light (701–750 nm),which accounts for a relatively large proportion of understory light (Zhen et al.2022),also has significant photosynthetic activity.However,studies on the understory light environment have often only focused on photosynthetically active radiation (400–700 nm) (Oguchi et al.2006;Wei et al.2019) and have ignored the importance of far-red light.
Phoebe bournei(Hemsl.) Yang is a unique evergreen broadleaf species endemic to China (Wang et al.2021b).BecauseP.bourneihas a tall,straight trunk,and aromatic and durable wood that is dense and lustrous with beautiful patterns (Ge et al.2014),it is widely used in southern China to transform inefficient secondary forests and restructure pure stands of coniferous trees (Zha et al.2022).During the early stages of growth,P.bourneiseedlings exhibit strong shade tolerance and require lightlimited conditions for survival and to prevent damage from excessive radiation.However,their light requirements vary with age and hence,P.bourneiis considered to be rather exacting with regards to light requirements (An et al.2022).Therefore,when modifying the canopy to meet the light requirements ofP.bourneigrowth and development in the understory,a targeted approach is needed,depending on the stand type (Annighöfer 2018;Sendall et al.2018).To date,little is known about the specific canopy modifications needed to different stands to enhance the understory light environment for the growth and development ofP.bournei.
Three stand types typical of south China were selected:aCryptomeria japonica(L.f.) D.Don plantation to represent a pure coniferous stand;aQuercus acutissimaCarruth.plantation as representative of a pure broadleaf stand;and a mixed stand ofC.japonicaandQ.acutissimato represent a mixed forest.Three different thinning intensities for each were designed to analyze the effects of thinning on canopy structure and the understory light environment and to investigate the causes of differences in the light environment in the different stands after thinning.In addition,the photosynthetic capacity and growth performance ofP.bourneiplanted in the understory was measured to determine its adaptability when the light environment was altered by reducing the canopy cover.The importance of understory far-red light on the growth ofP.bourneiwas examined and the hypothesis tested that photosynthetic leaf traits can be used to predict silvicultural effectiveness.Finally,the effects of different stand light environments on the early silvicultural benefits of aP.bourneiwere analyzed to determine how to regulate understory light to optimize the initial growth ofP.bourneiseedlings.This study should provide support for using photosynthetic leaf traits to predict silvicultural effectiveness and help forest managers to regulate the light environment of forest stands.
Materials and methods
Study site
This study was conducted in the Bailong Branch of the State-owned Zhazuo Forest Farm (106° 51′–107° 4′ E and 26° 2′–26° 8′ N),Guizhou Province,China,located in a karst basin landscape with a medium-thick loamy soil (Fig.1).The climate is subtropical humid monsoon with a mean annual temperature of 15.8 °C,a mean annual precipitation of 1213.4 mm,and 282 frost-free days per year.The forest farm is mainly secondary forest because most of the primary vegetation has been removed.The tree species areC.japonica,Q.acutissima,Pinus massonianaLamb.andLiquidambar formosanaHance;shrubs consist ofRhododendron simsiiPlanch.andRhus chinensisMill.;and herbs are mainlyPteridium aquilinum(L.) Kuhn var.latiusculum(Desv.) Underw.ex A.Heller andMiscanthus sinensisAndersson.
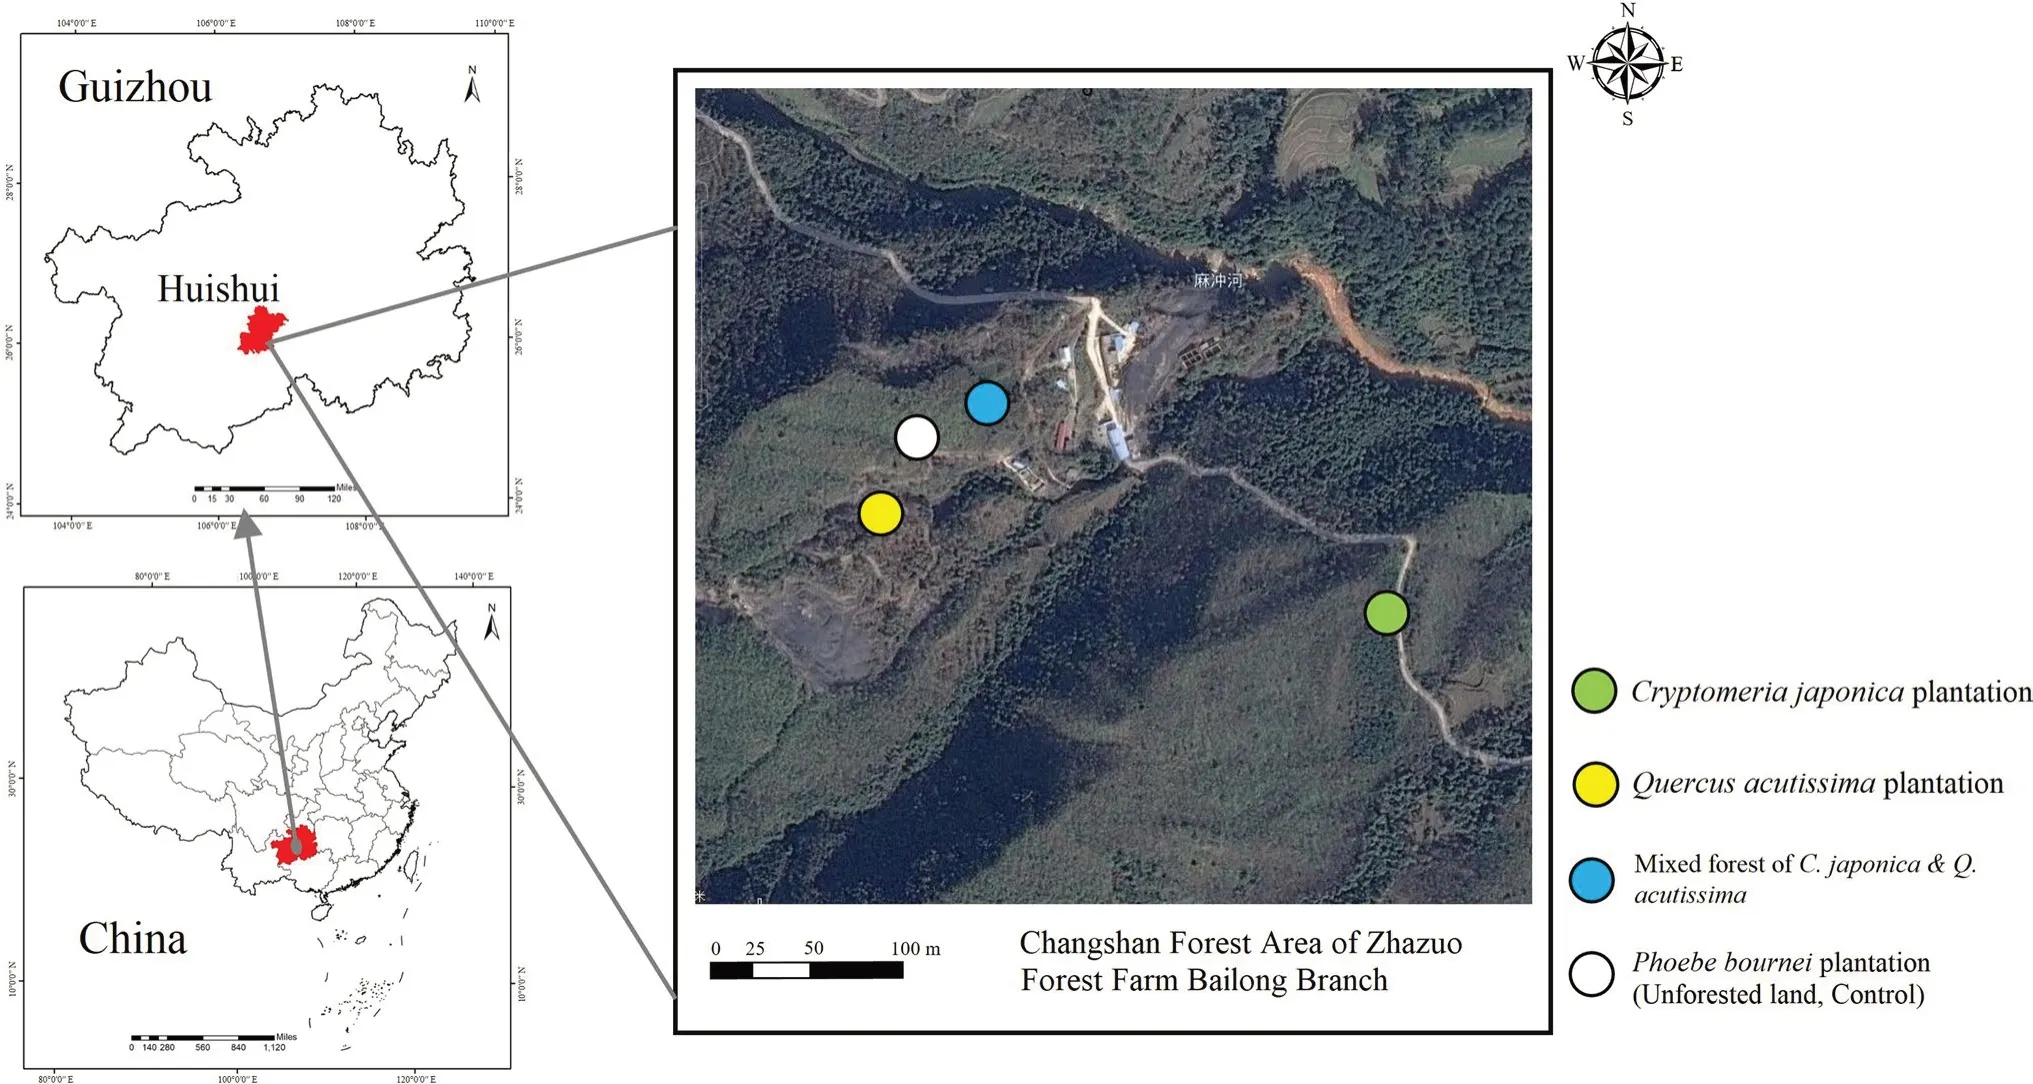
Fig.1 Study site location
The study was carried out in three stand types: aC.japonicaplantation (C),aQ.acutissimaplantation (Q),and a planted mixed stand ofC.japonicaandQ.acutissima(M).These stands are at the stage of half-mature forest in the Changshan forest area of the forest farm.Between September and November 2019,an inventory of 10 representative 20 m × 30 m sample plots in each of the three stand types was undertaken (Table 1).Site characteristics (latitude,longitude,altitude,slope and aspect) were determined using GPS and topographic maps (Table 1).The trees in the three stands grew evenly;however,because the stands were mainly composed of one or two species and had a high density,all stands had high canopy closure,weak growth,and a simple hierarchical structure.
Experimental design
Three thinning intensity levels were carried out: heavy (C1,59.7%;Q1,57.3%;M1,53.7%);moderate (C2,30.6%;Q2,26.7%;M2,28.4%);and light (C3,0.7%;Q3,1.3%;M3,1.5%) for each of the three stands (Table S1),which were determined by the percentage of the stand section area at breast height (SABH) removed by thinning compared with the total SABH of the pre-thinned stand.There were three replicate plots of each thinning intensity level in each of the three stands.Each plot was 400 m2(20 m × 20 m) with a space of 10 m between plots to avoid adjacent plot interference.At the same time,a 667 m2plot of bare ground was set as the control (CK).Twenty-eight plots were established(3 stand types × 3 thinning intensity levels × 3 replicate plots+1 control plot).

At the beginning of March 2020,the free-thinning method was used to harvest trees that were marked according to the experimental design and the actual situation in each plot,giving priority to stressed,dead,and dying trees,while ensuring that a uniform canopy was created as much as possible.All harvest residues and other vegetation in the understory were removed after harvesting to reduce resource competition and to increase the persistence of thinning treatments (Santos et al.2020).At the end of the month,36P.bourneiseedlings were planted in each replicate plot.Based on previous planting experience withP.bourneiseedlings and forest inventory results,a spacing of 3 m × 3 m and a planting hole size of 50 cm × 50 cm × 40 cm were used(Fig.S1).A slow-release compound fertilizer (100 g;total nutrients ≥ 45%;A slow-release compound fertilizer (100 g;total nutrients ≥ 45%: 15% N;15% P;15% K) was added to each hole as a base fertilizer.In total,1046 3-year-oldP.bourneiseedlings (height: 48.9 ± 4.5 cm;root collar diameter: 6.5 ± 0.5 mm) were planted (36 seedlings in each of the 27 treatment plots and 74 in the control plot).The seedlings had been cultivated at the experimental nursery at the College of Forestry of Guizhou University (Huaxi,Guiyang)and were marked with red paint at the root collar diameter measurement.
Canopy structure measurements
Hemispherical photographs of the canopies were obtained and analyzed using WinSCANOPY Pro 2019a (Levelling device: 24MP DSLR Compact OMount;high-resolution camera: SONY ILCE-6000;fish-eye lens;Regent Instruments Inc.,Montreal,Quebec,Canada).The center of each plot and the midpoint along a line from the center to the four corners were set as photographing points (Fig.S2) at a camera height of 1.3 m.Three photographs were taken at each of the five photographing points.During the inventory(before thinning,October 2019),450 hemispherical photographs were taken (i.e.,three photographs at each of the five points in ten representative sample plots in each of the stands).In addition,four sets of hemispherical photographs were taken at three (July 2020),six (October 2020),nine(January 2021),and 12 months (April 2021) after thinning in 28 plots (i.e.,15 × 28=420 hemispherical photographs × 4 sets=1680 hemispherical photographs).A total of 2130 hemispherical photographs (450+1680) were taken.The photographs were taken in the morning (07:00–08:00 am) or in the afternoon (17:00–18:00 pm) on cloudy,windless days to ensure consistent light conditions and to minimize halos caused by direct light.When the hemispherical photographs were analyzed,information (latitude,longitude,m above sea level,slope and aspect) relating to each photographing point was entered (Fig.S3).The stand canopy status in each plot was determined using the mean values of the hemispherical photograph analysis data.Canopy openness (CO) and leaf area index (LAI) were used to characterize the canopy structure,and the under-canopy photosynthetic photon flux density (UPPFD,including direct and diffuse radiation) was used to characterize the understory light conditions.
Spectral measurements above the crown of P. bournei seedlings
Spectral measurements were conducted using a high-sensitivity spectrometer (cosine corrector: CC-3;fiber: QP400-2-VIS–NIR;software: Oceanview 1.6.3 and MAYA2000,Ocean Optics Inc.,Dunedin,FL,USA) from 11:00–14:00 h on consecutive,sunny days.Measurements were recorded at three (July 2020),six (October 2020),nine (January 2021),and twelve months (April 2021) after planting the seedlings.EighteenP.bourneiseedlings were selected in each plot(uniformly distributed within the plots,Fig.S1).The cosine corrector was placed 5 cm above their crowns and spectral measurements of the following waveband data were recorded once every 15 s for a total of three times: red radiation (R,655–665 nm),far-red radiation (FR,725–735 nm),wideband red radiation (Rw,600–700 nm),and wideband blue radiation (Bw,400–500 nm).R/FR and Rw/Bw ratios were calculated.
Photosynthetic leaf trait measurements
Every three months (July 2020,October 2020,January 2021 and April 2021) after planting,five average plants were selected from each plot,and photosynthetic traits (light interception,absorption,use,and gas exchange characteristics)of peripheral leaves on the second or third branches down from the top of the crowns were measured.Leaves used for measurements were fresh,pest-free,and fully developed.When the first light-use and gas-exchange characteristics were measured,leaves were marked with a label.
Light interception: specific leaf area (SLA)
Three leaves were cut from each sample plant and a 1-cm2area cut from each leaf,which were oven-dried at 105 °C for 0.5 h and then at 75 °C for 48 h until a constant weight was reached.The SLA was determined by calculating the leaf area (cm2): dry mass (g) ratio.
Light absorption: chlorophyll a and b ratio (Chla/b)and total chlorophyll content (Chltotal)
Three fresh leaves were cut from each sample plant to determine photosynthetic pigments: 0.1 g of fresh leaves of each sample plant were placed in a graduated test tube,10 ml of 95% ethanol added and the tube then placed in the dark for 48 h until the leaves turned white.After filtration,chlorophyllaand chlorophyllbabsorbance readings were taken at two wavelengths (663 and 645 nm) using a UV-2100 spectrophotometer (Unico,Dayton,NJ,USA).Chla/band Chltotalconcentrations in the extracts were calculated based on the content of chlorophyllaand chlorophyllb(mg g–1)(Lichtenthaler and Wellburn 1983).
Light use: maximum quantum yield of photosystem II(PSII),Fv/Fm;actual quantum yield of PSII,Y(II)
Light use measurements were carried out on three leaves of each plant using a MONI-PAM fluorometer (Heinz Walz GmbH,Effeltrich,Germany) after dark adaptation for 0.5 h and avoiding the main veins of the leaves.TheFv/Fmvalue was calculated by determining the initial fluorescence value (Fo) using an irradiation measurement light(<0.5 µmol m–2s–1),and the maximum fluorescence value(Fm) was determined using a 0.6 s saturation pulse (approximately 10,000 µmol m–2s–1) (Tsimilli-Michael and Strasser 2008;Strasser et al.2010).
Gas exchange characteristics: light-saturated photosynthesis rate (Asat) and stomatal conductance (gs)
Three leaves per plant were measured using a portable gas exchange analyzer (LI-6800,Li-Cor Inc.,Lincoln,NE,USA)between 09:00 and 11:00 am on typical,consecutive sunny days.The chamber was adjusted to the following parameters:a flow rate of 400 µmol m–2s–1,a CO2concentration of 400 µmol mol–1,a leaf temperature of 25 °C,and a photosynthetic photon flux density of 1500 µmol m–2s–1.
Seedling growth measurements
Every three months after planting,height (H,cm),root collar diameter (D,mm),and crown radii (cm) of all seedlings were measured.The crown area (CA,cm2) was calculated using Eq.1:
whereAandBare the lengths of the long and short axes of the crowns,respectively.The approximate aboveground seedling biomass was calculated by determiningHD2(Kohyama and Hotta 1990).The annual relative growth rate (RG)of the aboveground biomass was calculated using Eq.2:
Statistical analysis
Microsoft Excel 2021 was used for preliminary data organization and statistical analyses performed in SPSS 26.0.One-way ANOVA was used to test statistical differences among treatments,and Tukey’s test was used for post-hoc analysis (P<0.05).The Spearman correlation method was used to preliminarily analyze the correlations of all indicators.Path analysis was used to study the correlation structure between the independent variableXi(i=1,2,…,n) and the dependent variableY(Silveira et al.2015;Wang et al.2021a) to distinguish the effects ofXionYinto direct and indirect effects after obtaining the optimal regression equation using stepwise regression analysis,and to judge the relative importance of the contributions of the respective variables to the dependent variable by determining the magnitude of the path coefficients (Fig.2).

Fig.2 Graph of path analysis;double-headed arrows indicate the indirect effect of Xi on Y via the Xj correlation path (rij,indirect determination coefficient);single-headed arrows indicate the direct effect of Xi on Y (PnY,direct determination coefficient)
Results
Canopy structure and understory light environment
With greater thinning intensity,CO (canopy opening) and UPPFD (under canopy photosynthetic photon flux density)increased significantly,and LAI (leaf area index) decreased significantly in the three stands (Fig.3).At the same thinning intensity,CO was greatest in theQ.acutissimaplantation and smallest in theC.japonicaplantation,with the CO of theQ.acutissimaplantation 1.4,2.2 and 2.2 times greater following light,moderate,or heavy thinning,respectively.The regrowth of canopies resulted in a reduction in CO over time,with theQ.acutissimaplantation showing the greatest reduction (i.e.,a reduction 3.8 times greater than that of theC.japonicaplantation,which showed the smallest reduction).Q.acutissimais a deciduous species,therefore the CO of the plantation and mixed stand increased rapidly in January (winter).The LAI of each stand showed the opposite to that observed for CO.
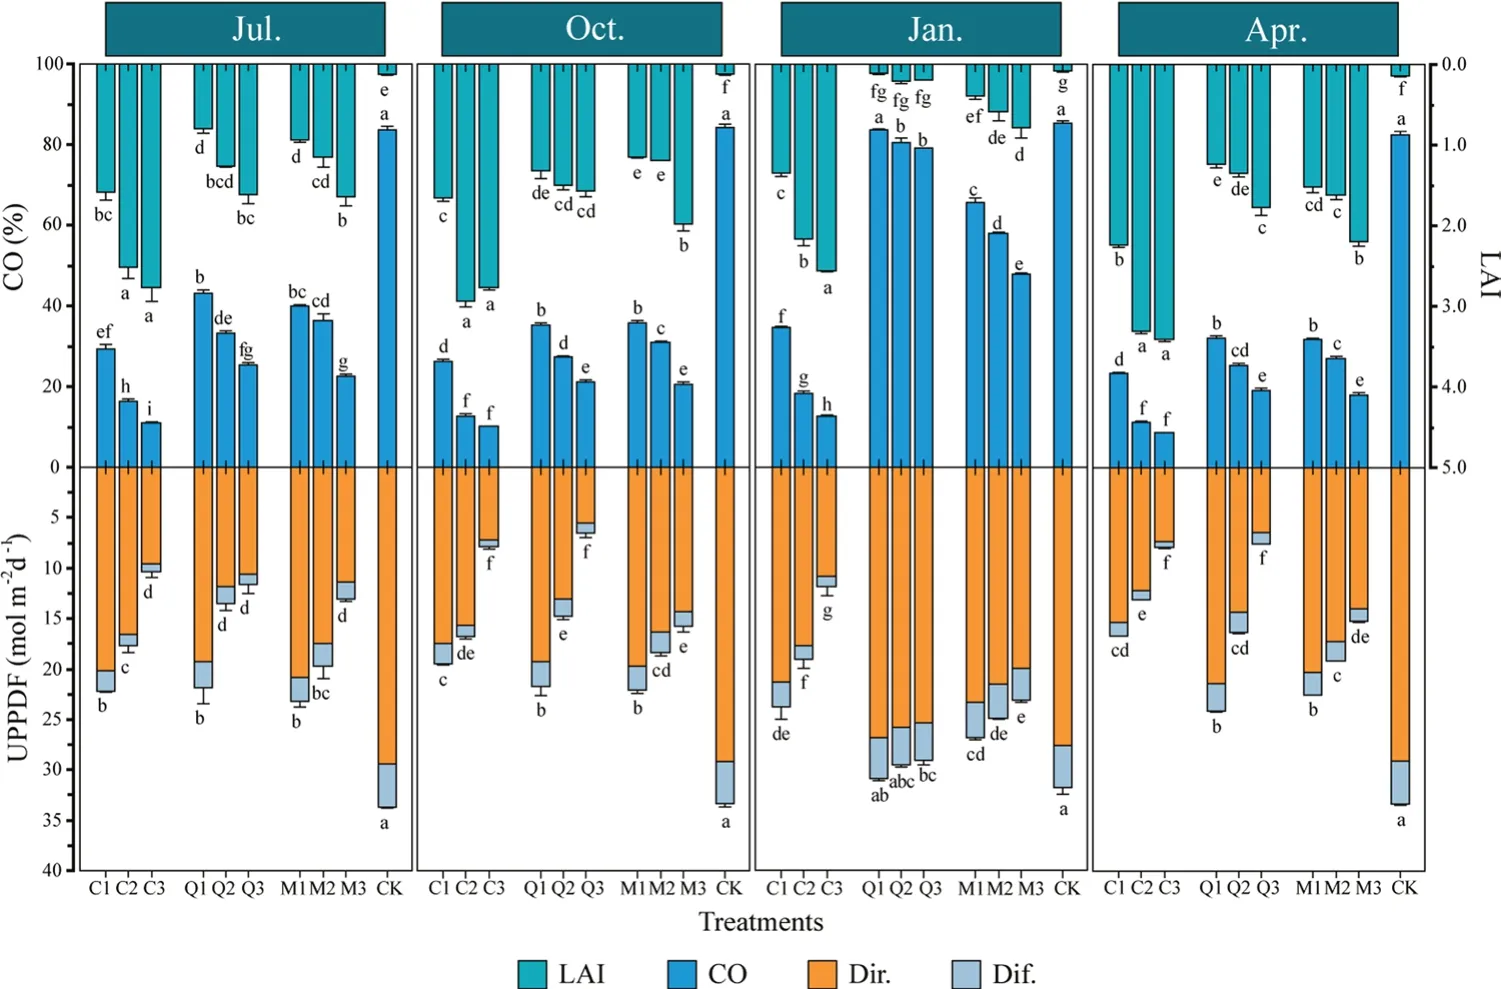
Fig.3 Effects of three thinning intensities (1,heavy;2,moderate;3,light) on CO,LAI,and UPPFD in three forest stands(C,Cryptomeria japonica;Q,Quercus acutissima;M,mixed forest of C. japonica and Q. acutissima;and CK,bare ground control) over time.Bars indicate means and error bars indicate the total standard error.Different letters in the same month indicate significant differences between treatments(P <0.05) according to Tukey’s test.Abbreviations: CO,canopy openness;LAI,leaf area index;UPPFD,under-canopy photosynthetic photon flux density(Dir.,direct radiation;Dif.,diffuse radiation)
Comparisons of UPPFD in different stands that received the same thinning revealed that the mixed stand had the highest value (Fig.3).Canopy structure of the species differed and hence the proportion of each radiation component reaching the understory was different.Direct radiation in theC.japonicaplantation was relatively high,comprising 92.0% of the UPPFD,whereas diffuse radiation in theQ.acutissimaplantation was 12.3% of the UPPFD.TheC.japonicaplantation showed an average decrease in UPPFD of 25.1% over time under all three thinning regimes.In contrast,there was little change in UPPFD over time in the mixed stand.
Spectra above the crown of P. bournei seedlings
The spectra above the crowns ofP.bourneiseedlings in the different stands after different thinning intensities showed significant differences (Table 2).The greater the CO,the higher the radiation in each wavelength,and R/FR and Rw/Bw were also significantly higher.Except in January,R/FR and Rw/Bw decreased over time in each stand,with the maximum R/FR in plots of heavily thinnedC.japonicaand the minimum in plots ofC.japonicasubjected to moderate or light thinning.The opposite situation was recorded in the mixed stand,with the R/FR ofC.japonicaplots 1.1,0.9,and 0.9 times higher than those in mixed stands subjected to heavy,moderate,or light thinning,respectively.Rw/Bw did not differ significantly among heavily thinned stands;however,Rw/Bw was lowest in theC.japonicaplantation subjected to moderate or light thinning and the maximum was in theQ.acutissimaplantation,about 1.1 times that of theC.japonicaplantation.Following thinning,theC.japonicaplantation showed the greatest variation in R/FR and Rw/Bw among the three stands,and the understory spectral composition was the most strongly influenced by thinning.
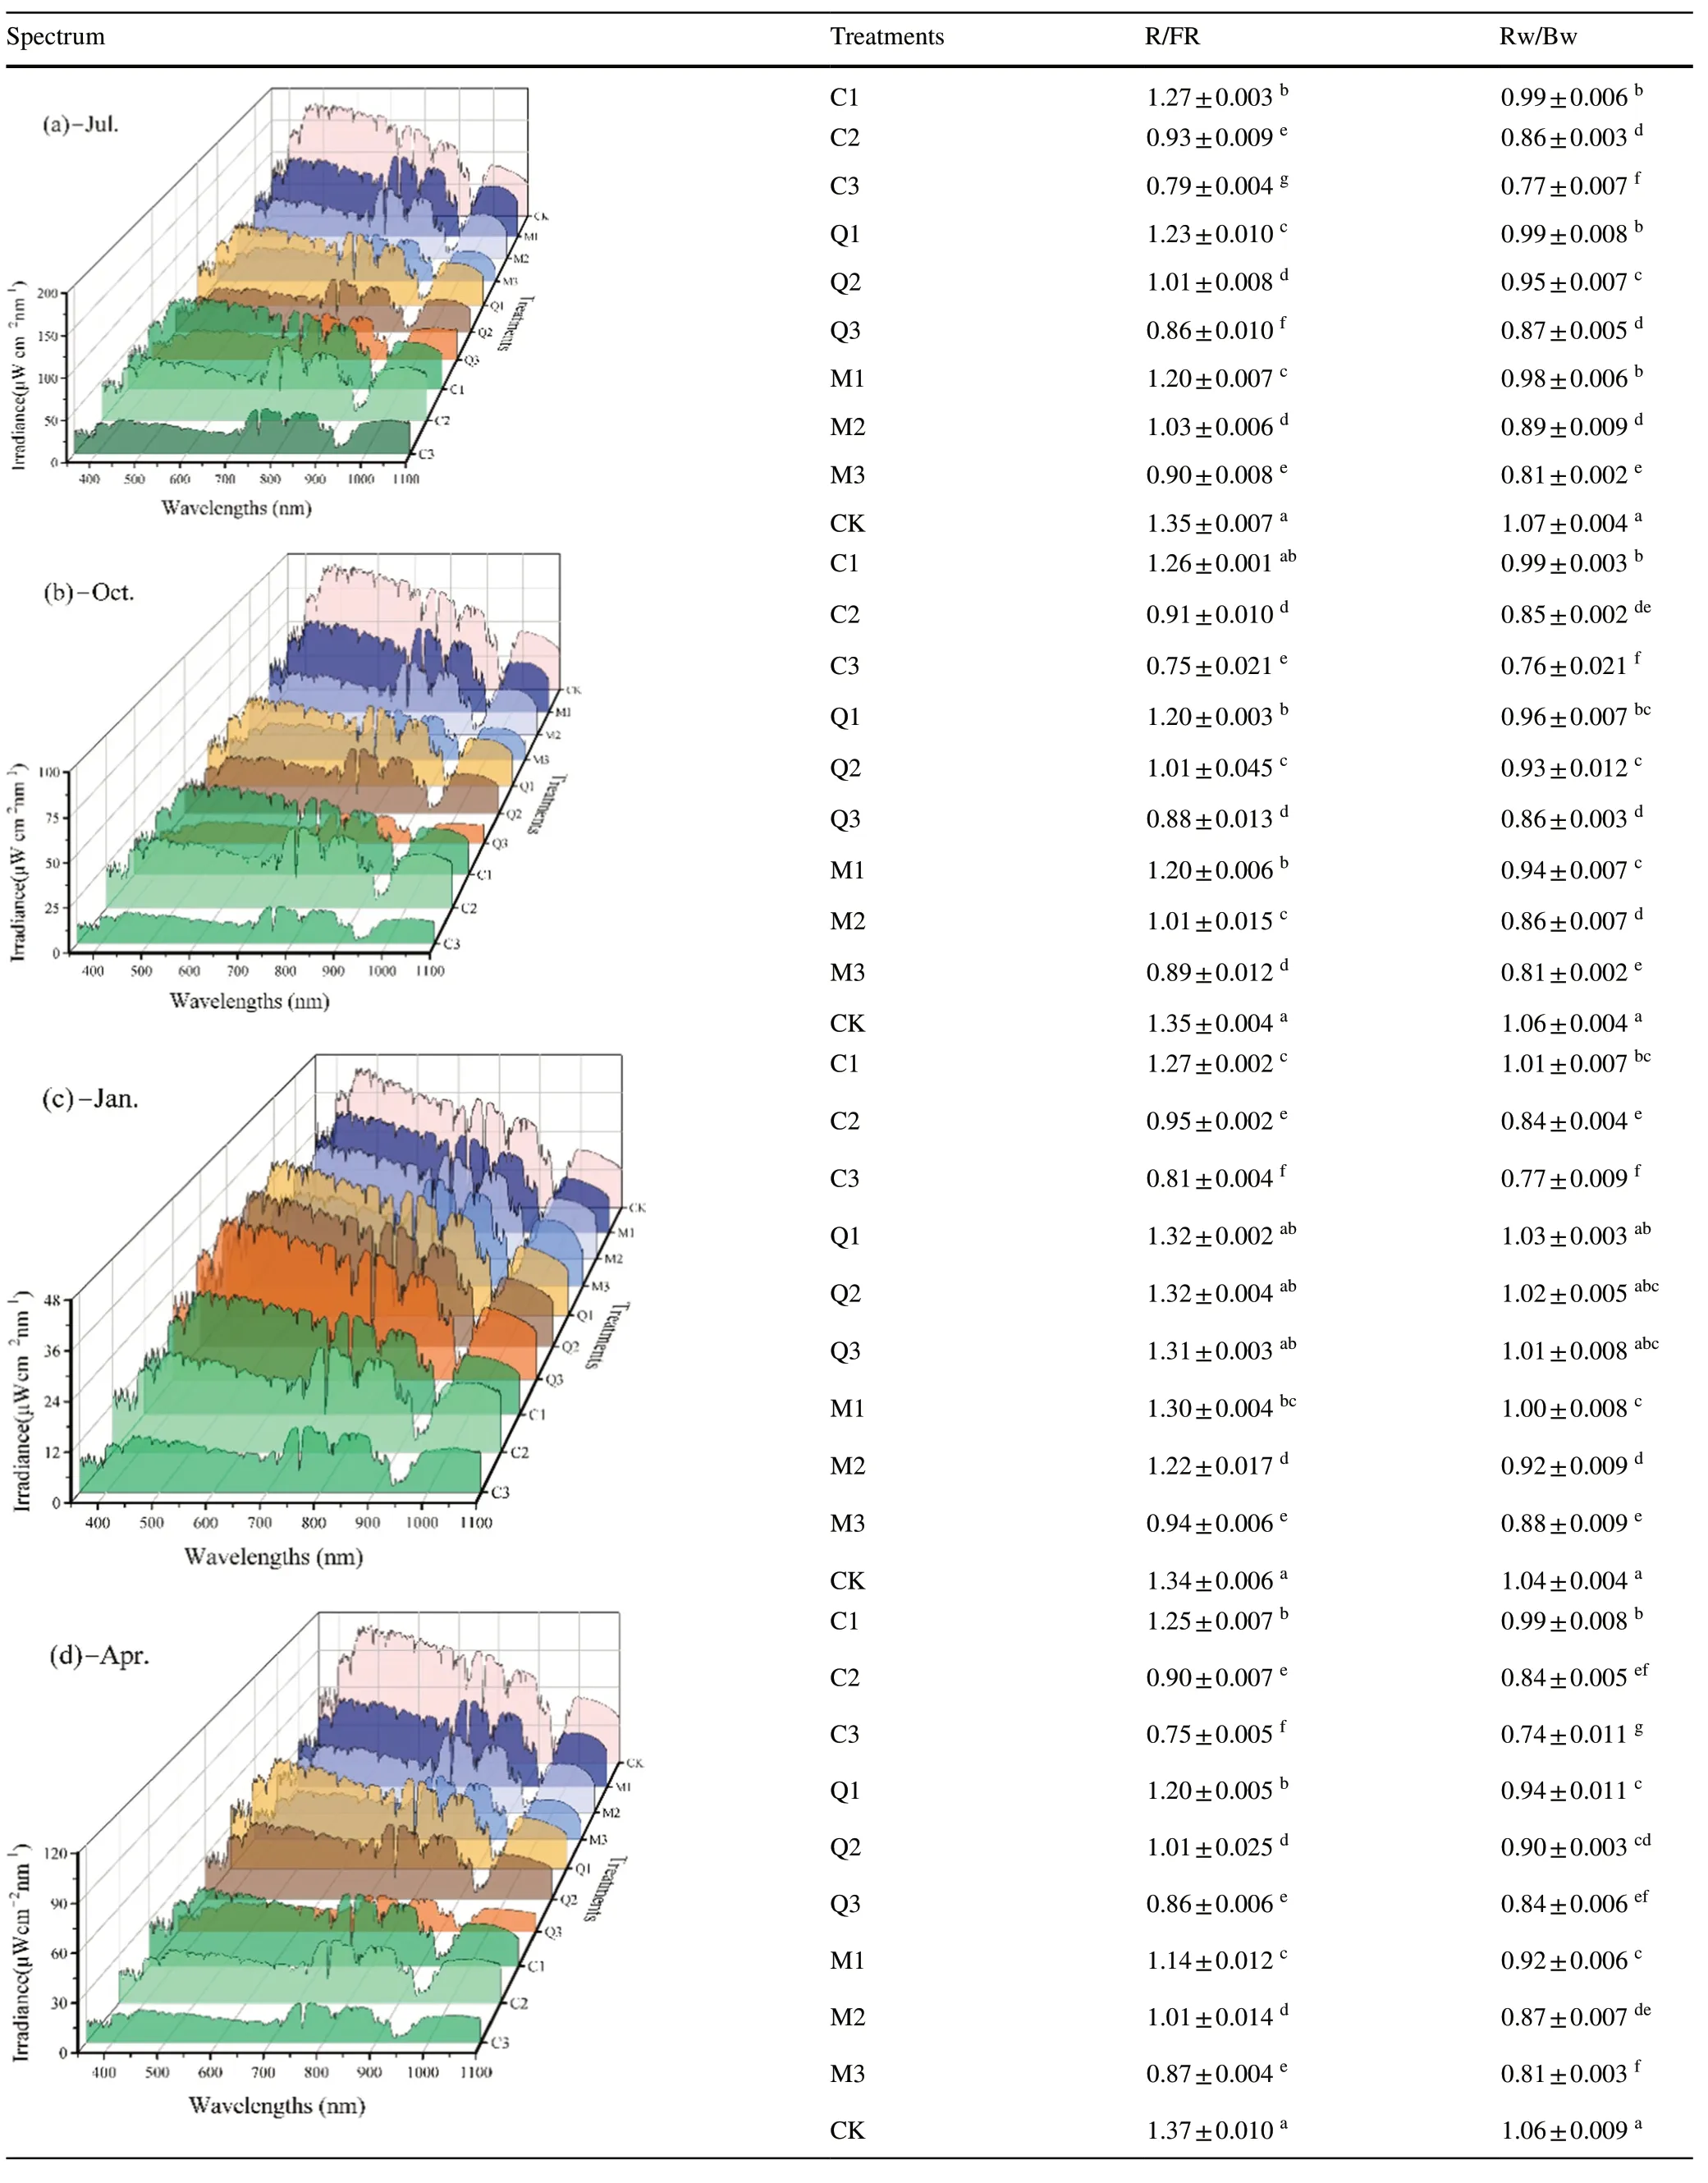
Table 2 Changes in spectral composition above the crown of P. bournei seedlings among thinning treatments over time
Photosynthetic leaf traits
The photosynthetic leaf traits ofP.bourneiseedlings differed significantly in response to different thinning (Fig.4).Over time,SLA,Chltotal,Fv/Fm,and Y(II) decreased trend with increasing CO (Fig.4a,b,d,e),and Chla/bincreased with increasing CO (Fig.4c).However,gs(Fig.4f) andAsat(Fig.4g) both increased and then decreased with greater CO in July,and increased with greater CO in April.Control seedlings had relatively small photosynthetic leaf trait values except for the Chla/b,which was significantly larger than that of seedlings grown under stands.
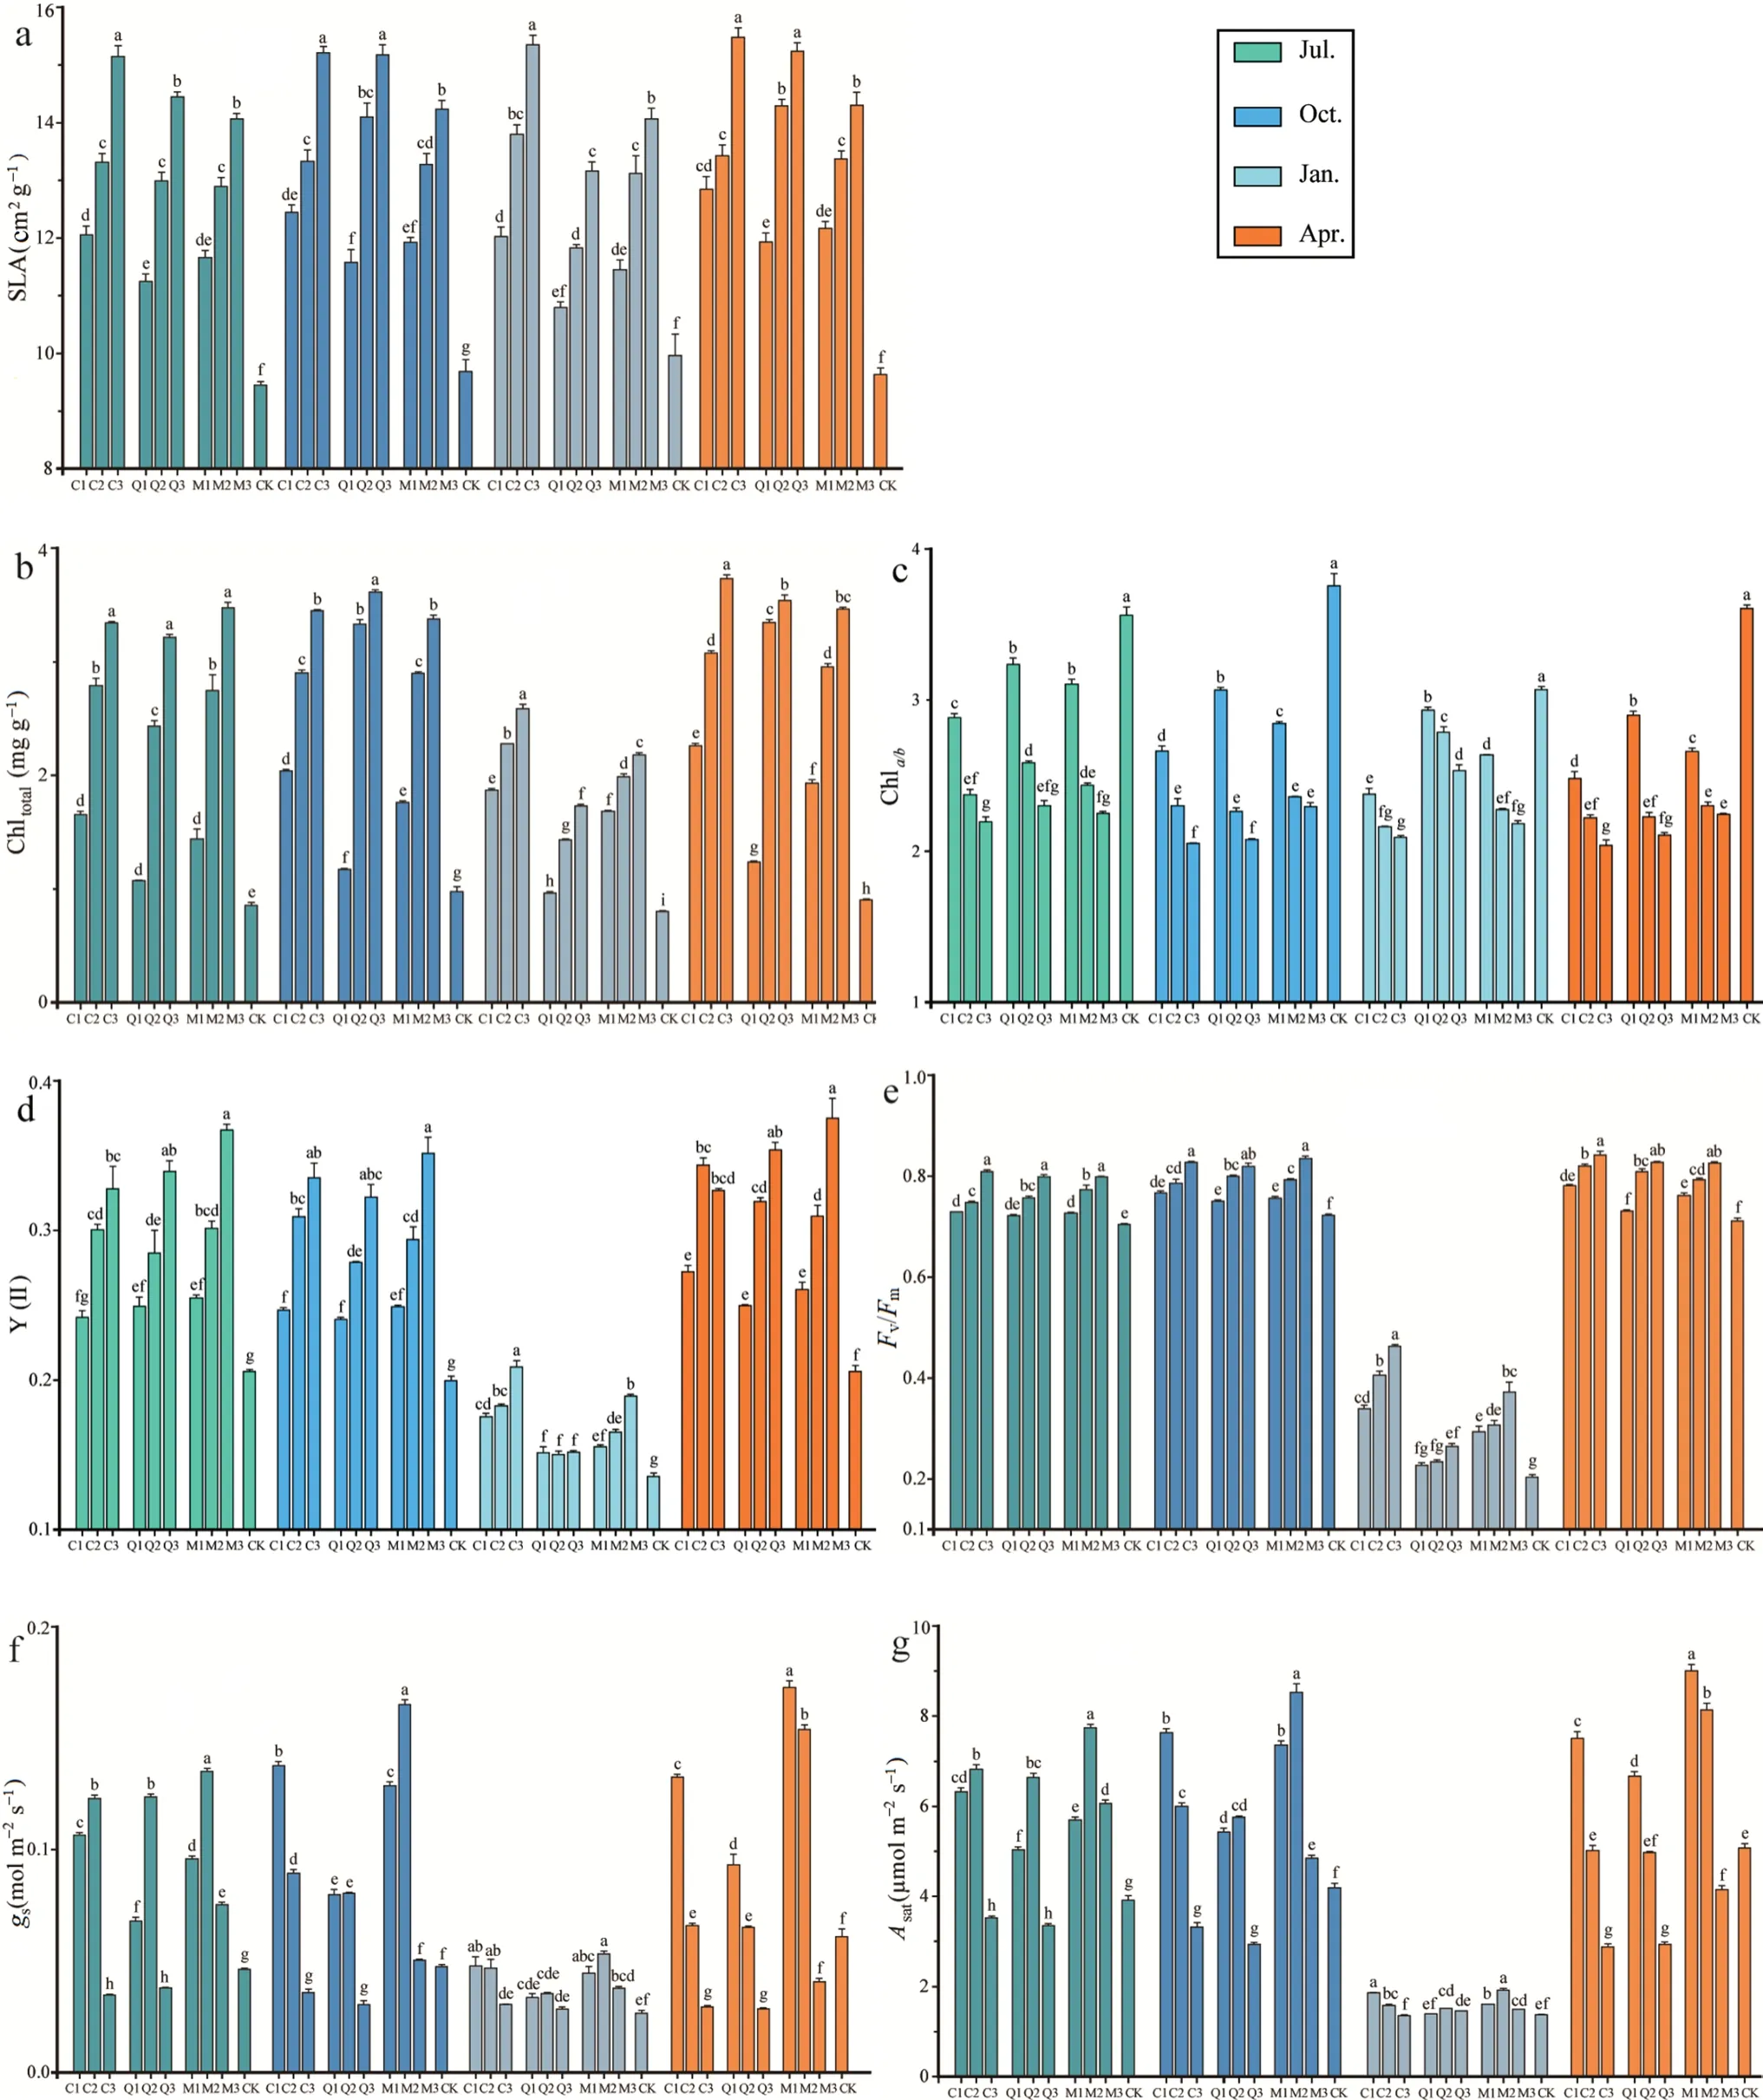
Fig.4 Leaf photosynthetic trait response over time of P. bournei seedlings planted in three stands [Cryptomeria japonica (C),Quercus acutissima (Q),mixed forest of C. japonica and Q. acutissima (M),and bare ground control] subjected to heavy (1),moderate (2),or light (3) thinning prior to planting seedlings in the understory.Bars indicate means and error bars the standard error.Different letters in the same month indicate significant differences between treatments(P <0.05).Abbreviations: SLA,specific leaf area;Chla/b,chlorophyll a and b ratio;Chltotal,total chlorophyll content;Fv/Fm,maximum quantum yield of photosystem II (PSII);Y(II),actual quantum yield of PSII;Asat,light-saturated photosynthesis rate;gs,stomatal conductance
Height,root collar diameter,and crown growth
Increments in height and root collar diameter ofP.bourneiseedlings in stands subjected to different thinning treatments varied significantly (Fig.5) because of changes to the canopy structure and in the understory light environment.With greater thinning intensity,increment of root collar diameter in all three stands showed an increasing trend,however,increment of height only showed an increasing trend in theC.japonicaplantation,and increased then decreasing trend in theQ.acutissimaplantation and mixed stand.Increments in root collar diameter were highest in the mixed stand and lowest in theC.japonicaplantation for all three thinning treatments.Of the stands subjected to heavy thinning,seedlings in theC.japonicaplots showed the largest height increment,and among stands under moderate or light thinning,P.bourneiseedlings in the mixed stand showed the largest height increment.Control seedlings in full sunlight performed poorly,with height and root collar diameter increments that were 46.2% and 74.4% of the best-performing treatments (M2 and M1),respectively.
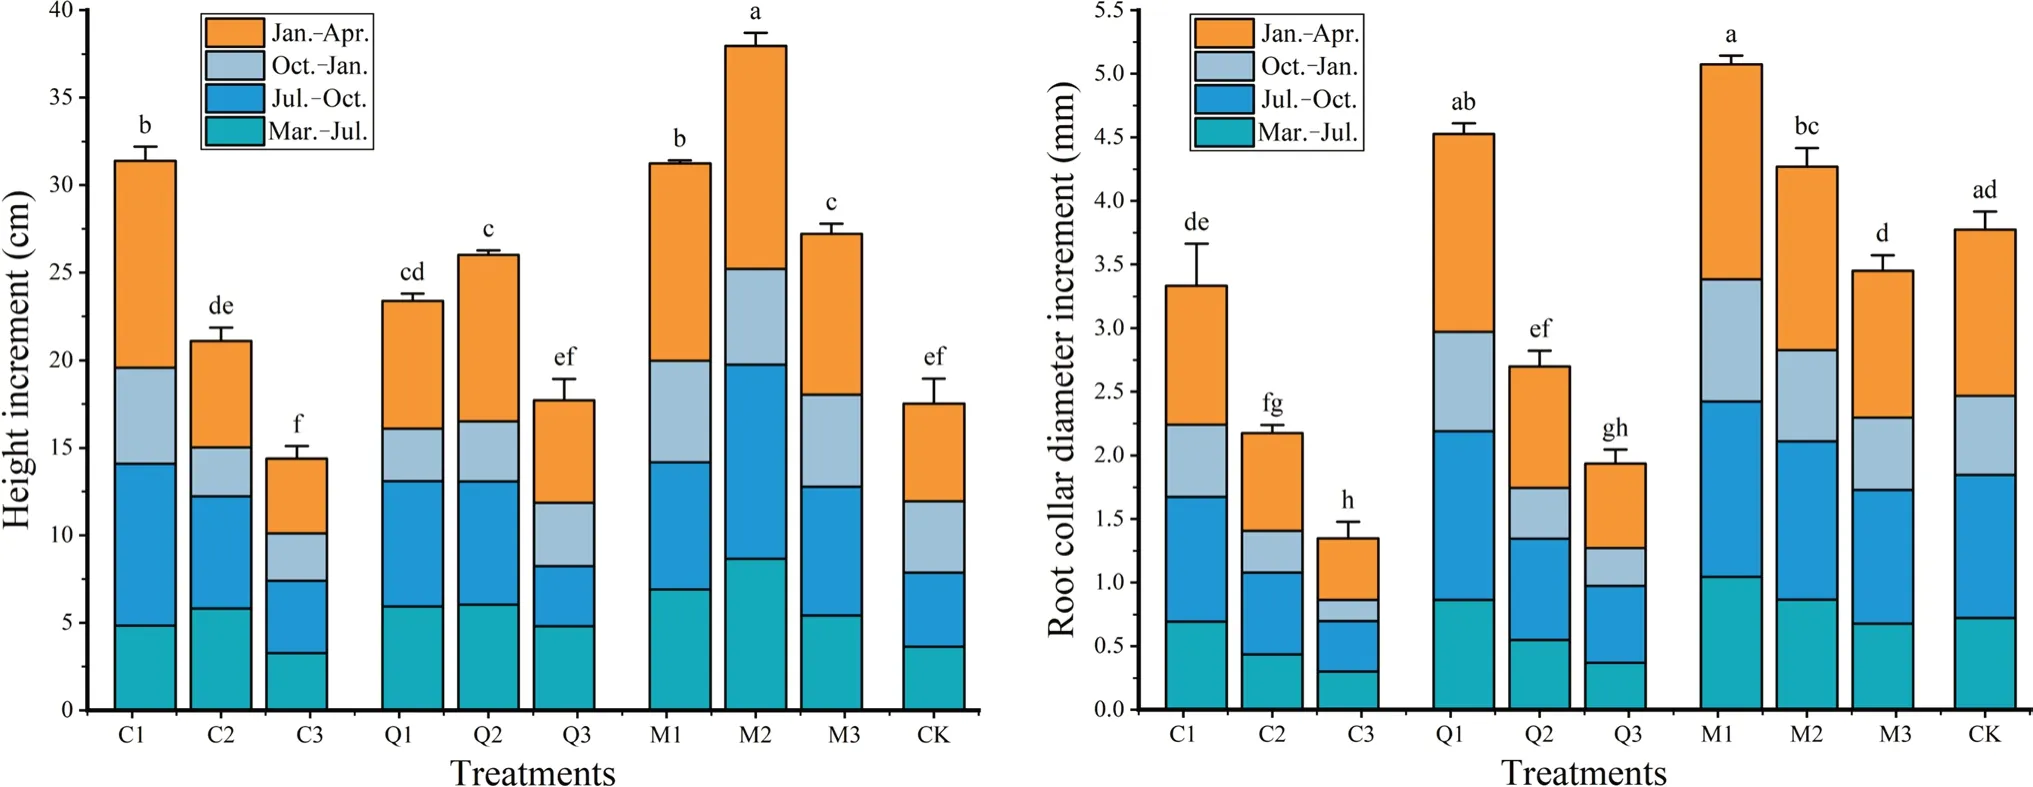
Fig.5 Height and root collar diameter increments (March to July 2020,July to October 2020,October to January 2021,January to April 2021) of P. bournei seedlings in three stand types [Cryptomeria japonica (C),Quercus acutissima (Q),mixed forest of C. japonica and Q. acutissima (M),and bare ground control (CK)] subjected to heavy (1),moderate (2),or light (3) thinning prior to planting;Bars indicate means and error bars the standard error.Different letters in the same month indicate significant differences between treatments(P <0.05)
Crowns ofP.bourneiseedlings in the understory of the different stands gradually diversified over time (Table 3).After 12 months,crowns of seedlings in theC.japonicaplantation had grown larger with increasing thinning intensity.However,seedlings in theQ.acutissimaplantation and mixed stand showed a significantly greater crown area under moderate thinning.The RG (relative growth rate) of seedlings increased with greater thinning intensity,with the maximum for seedlings planted in heavily thinned mixed forest (M1),relatively minor for seedlings in full sunlight(CK),and minimum for seedlings inC.japonicaplots subjected to light thinning (C3).The RG of M1 was 2.5 and 1.3 times more than C3 and the controls,respectively.
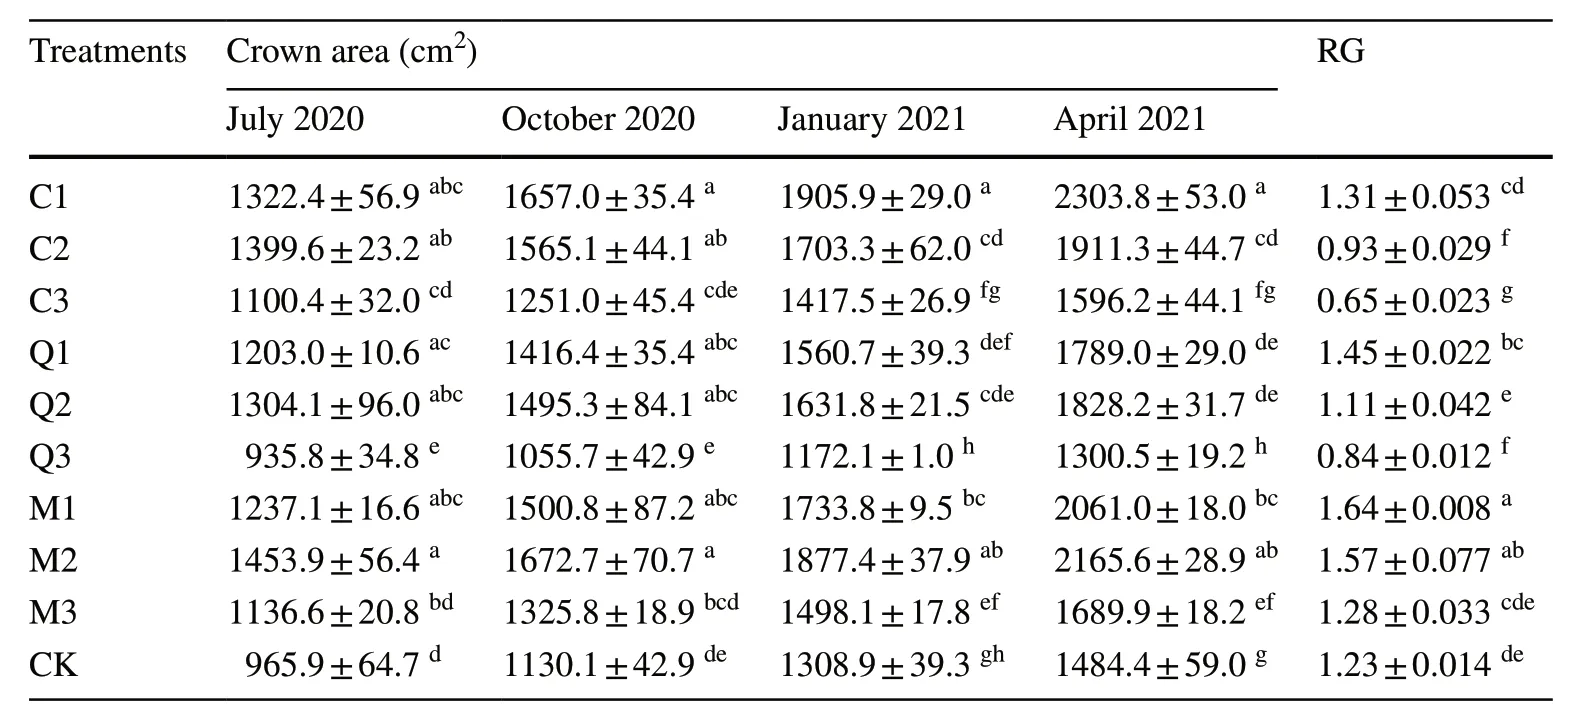
Table 3 Effect of thinning levels on the annual relative growth rate (RG) of aboveground biomass and crowns of P. bournei seedlings
Correlation between stand canopy structure,understory light environment and photosynthetic leaf traits and growth
Correlations between all indicators were studied using the Spearman correlation method (Fig.6).Canopy structure (opening and leaf area index) significantly influenced understory light conditions,and CO was positively correlated with UPPFD,R/FR,and Rw/Bw (P<0.01) and negatively with LAI (P<0.01).Photosynthetic leaf traits of light interception (SLA),absorption (Chla/b,Chltotal),and use (Y(II),Fv/Fm) were correlated with the light environment (P<0.01).gswas positively correlated with UPPFD(P<0.05) and was positively correlated with R/FR and Rw/Bw (P<0.01).RG was significantly correlated with all light environment factors and with seedling photosynthetic and growth indicators (P<0.01),whereas height growth was correlated only with photosynthetic traits and not with the light environment.Root collar growth showed no correlation with light availability;however,crown growth was positively correlated with the understory light environment but not with canopy structure (CO and LAI).However,the correlation coefficient does not fully explain the relationship between the environment and seedling performance.For example,Asatis the most critical indicator representing the rate of carbon assimilation which is directly influenced by light.However,Asatwas not significantly correlated with the light environment in the correlation analysis.This suggests that the correlation coefficient ignores the relative importance between variables,therefore,the relationship between indicators needs to be further analyzed.
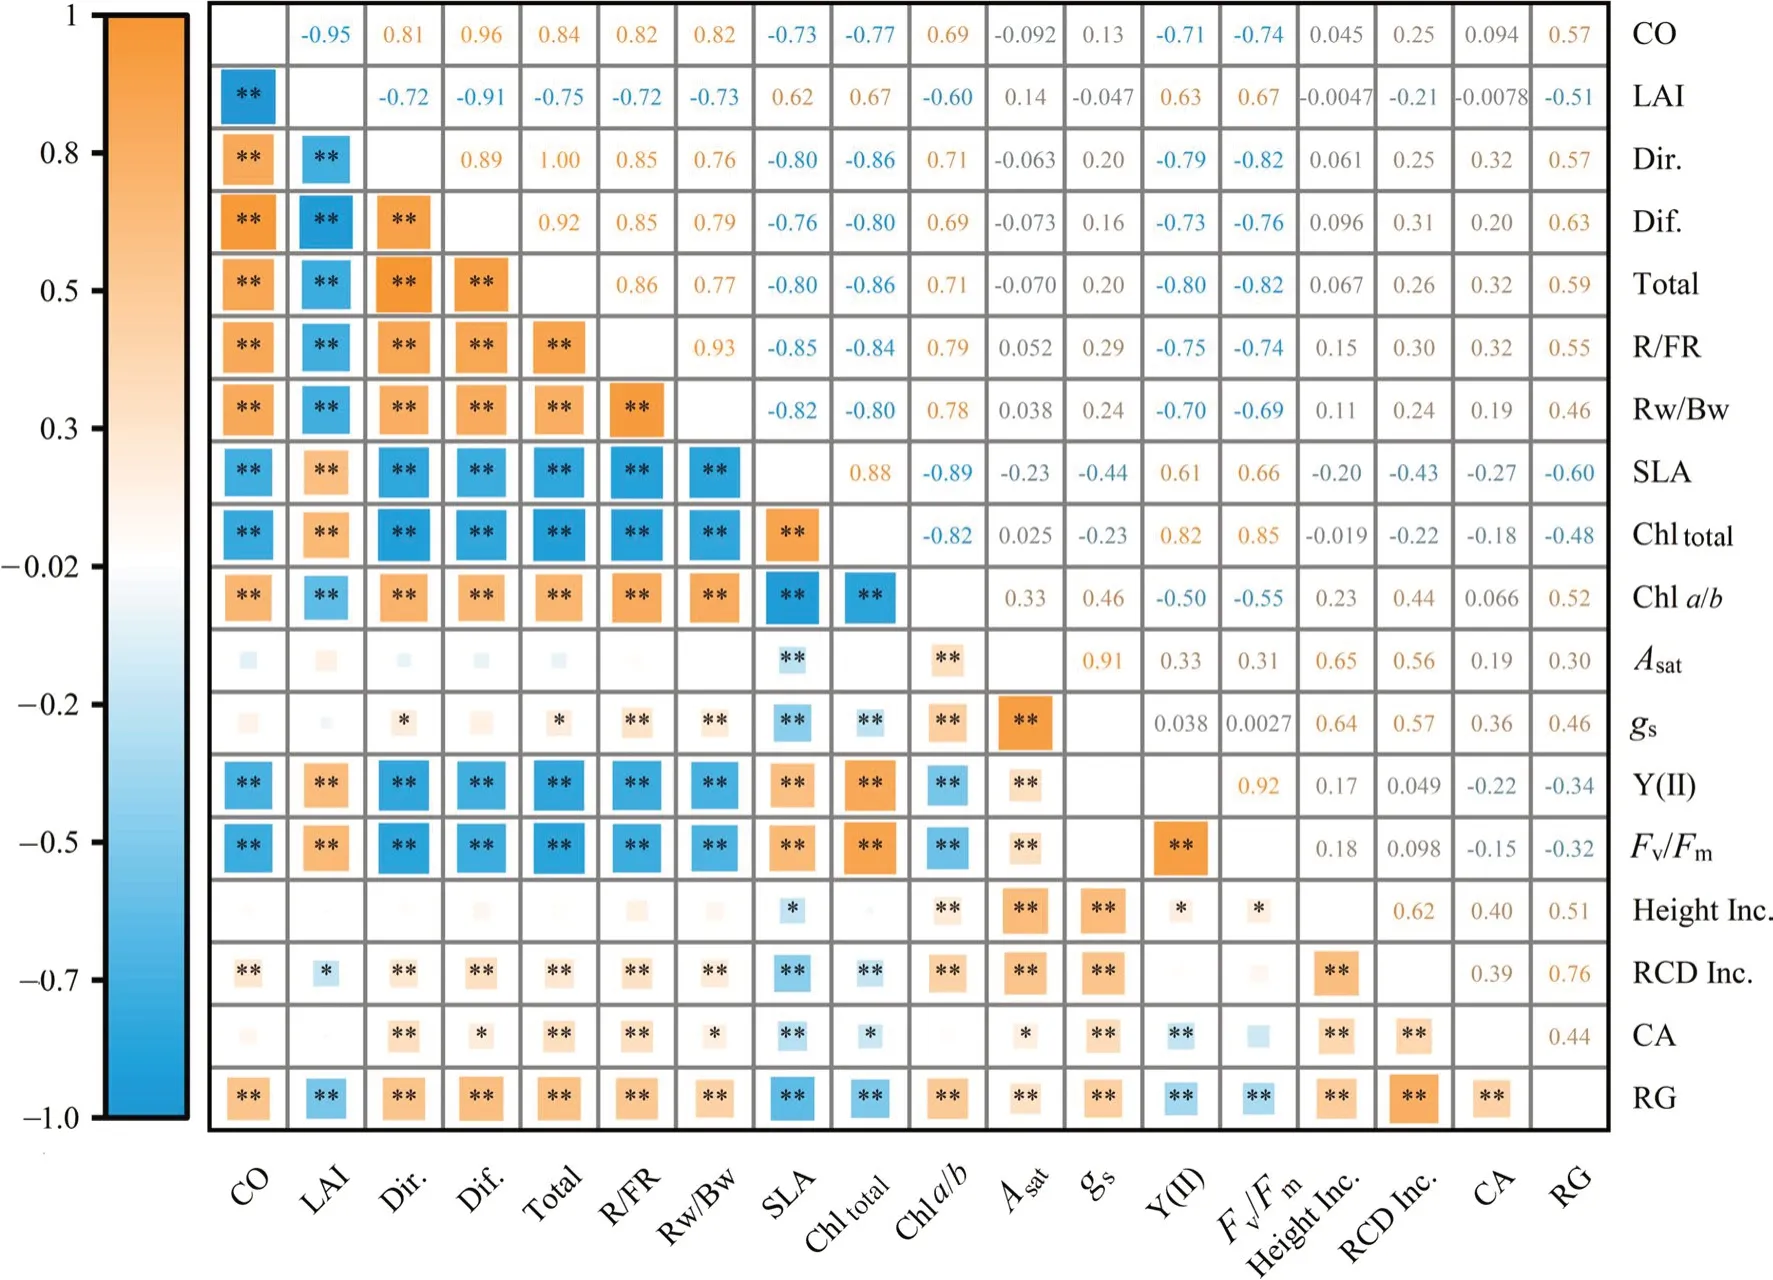
Fig.6 Spearman correlation coefficients among stand canopy structure,the understory light environment,and photosynthetic traits and growth of P. bournei seedlings (*P <0.05;**P <0.01).Abbreviations: CO,canopy openness;LAI,leaf area index;CA,crown area;Dir.,direct radiation;Dif.,diffuse radiation;Total,under-canopy photosynthetic photon flux density including direct and diffuse radiation;R/FR,red radiation/far red radiation ratio;Rw/Bw,wideband red radiation/wideband blue radiation ratio;SLA,specific leaf area;Chl total,total chlorophyll content;Chla/b,chlorophyll a and b ratio;Asat,light-saturated photosynthesis rate;gs,stomatal conductance;Y(II),actual quantum yield of photosystem II (PSII);Fv/Fm,maximum quantum yield of PSII;Height Inc,height increments;RCD Inc.,root collar diameter increments;CA,crown area;RG,annual relative growth rate of aboveground biomass
Path analysis
The direct effects of independent variables on dependent variables and the indirect effects of interactions between these were examined in detail using stepwise regression and path analyses to identify essential links between several independent and dependent variables to provide a reliable basis for statistical decision-making (Wang et al.2021a).Figure 7a and b show that CO,LAI,and R/FR in the light environment have a limiting effect on theAsatofP.bourneiseedlings,and that CO is the main limiting factor with the strongest direct effect according to the order of determination coefficients.All indicators of the leaf photosynthetic pathway play a role in enhancingAsat,among whichgsis the main decision variable and has the strongest direct effect.With regard to variables affecting seedling growth (Fig.7c,d),light environment variables that enhanced RG were LAI,Dif.,and R/FR,while CO and Rw/Bw were limiting factors,CO had the greatest direct effect on growth,followed by Dif.Among the leaf photosynthetic pathways,only SLA andgswere retained after stepwise regression,with both of these enhancing seedling growths.SLA was the main decision variable with the largest direct effect on seedling growth.Our analyses show that if the canopy is too open (strong light) or if the LAI is too high (excessive shade),the carbon assimilation rate ofP.bourneiseedlings can be inhibited.Therefore,P.bourneiseedlings need both a suitable stand canopy structure and an understory light environment for growth and development.Furthermore,bothAsatand RG are influenced by R/FR,with R/FR also playing a major role in determining RG.

Fig.7 Path analysis diagrams showing the direct and indirect effects of relative factors on the light-saturated photosynthesis rate (Asat) and the annual relative growth rate (RG) of the aboveground biomass of P. bournei seedlings.Only effective paths filtered by stepwise regression analysis are shown in the diagrams.The value beside the arrows indicates the standardized determination coefficient;line thickness indicates the size of the path coefficient,and solid and dash lines the positive and negative path coefficients,respectively.The determina-tion coefficients are shown in the upper right corner of the indicators,and decision and limitation variables are in red and blue,respectively.Abbreviations: CO,canopy openness;LAI,leaf area index;Dif.,diffuse radiation;R/FR,red/far red radiation ratio;Rw/Bw,wideband red/wideband blue radiation ratio;SLA,specific leaf area;Chla/b chlorophyll a and b ratio;gs,stomatal conductance;Y(II),actual quantum yield of photosystem II (PSII);Fv/Fm,maximum quantum yield of PSII
Discussion
Effect of thinning on canopy structure and understory light environments
Different stands have different canopy structures and light environments (Gustafsson et al.2016;Orman et al.2021).Thinning creates special microenvironments in the understory by changing the canopy structure.The most direct effect is to increase light availability in the understory (Santos et al.2020).Thinning modified the canopy structure and the understory light environment of the three stands by reducing stand density,making the canopy sparse (Beaudet et al.2011;Zhang et al.2018a).CO and understory radiation significantly increased,and LAI decreased in all stands with increasing thinning (Fig.3 and Table 2).However,the thinning measures had different effects on canopy structure and light conditions of the different stands.For example,the same thinning intensity had a greater effect on canopy structure of stands with a greater proportion of broadleaf trees.After thinning,the canopy opening of theC.japonicaplantation,mixed species stand,and theQ.acutissimaplantation ranged from 11.0 to 29.4%,22.6 to 39.9%,and 25.3 to 43.0%,respectively (Fig.3).Over time,canopies closed.However,the rate of closure varied with species composition and thinning intensity determining the speed of closure(Forrester et al.2018;Santos et al.2020).Although canopies ofQ.acutissimaplots under heavy thinning closed more rapidly after thinning than canopies in other plots,the understory radiation of theseQ.acutissimaplots decreased more slowly.Twelve months after thinning,the UPPFD in theC.japonicaplantation had decreased the most,averaging about 25.1%,whereas in theQ.acutissimaplantation,it had only decreased by 1.5% (Fig.3).When the three stands were subjected to the same thinning intensity,Dir.was highest in theC.japonicaplantation and Dif.highest in theQ.acutissimaplantation,whereas the proportion of Dir.and Dif.in the mixed stand was more balanced and had the highest radiation.This indicates that,when the three stands were subjected to the same thinning intensity,the light environment of the mixed forest improved more effectively,which is consistent with the findings of previous studies that investigated the effect of canopy structure on forest light environment(Ishii et al.2004;Beaudet et al.2011;Forrester et al.2018).
Several studies have investigated how to assess the understory light environment effectively (Cogliastro and Paquette 2012;Lochhead and Comeau 2012;Rosati et al.2013).In this study,factors associated with canopy structure were closely related to the understory light environment,and the combined effects of the canopy opening and leaf area index of the three stands affected radiation intensity and spectral composition (Fig.6).Therefore,light conditions in a stand can be effectively estimated by measuring CO and LAI.These measurements,combined with radiation intensity and the spectral composition of the understory,can then be used to analyze and evaluate the light environment in the stand(Orman et al.2021).Blue,red,and far-red light in the spectrum play key roles in controlling the photomorphogenesis,the development of form and structure affected by light,of plants (Riikonen 2021),with far-red light (long-wave light)also enhancing the photosynthetic efficiency of short-wave light (Emerson et al.1957;Zhen et al.2019;Zhen and Bugbee 2020).Consistent with the findings of Ellsworth and Reich (1993) and Zhen et al.(2022) in their studies of the light environment in stands,the proportion of far-red and blue-violet light in the three stands in this study increased as the canopy opening decreased.As seen by the reductions in R/FR and Rw/Bw relative to full sunlight,the spectral composition in theC.japonicaplantation was affected the most by thinning and the mixed forest was affected the least.After moderate and light thinning,the lower the number of broadleaf trees in the stand,the higher the proportion of far-red and blue-violet light (i.e.,theC.japonicaplantation had the highest proportion of far-red and blue-violet light)(Table 2).Therefore,thinning measures should be targeted according to the species composition of the stand (Wiener 2010) to obtain a stable and healthy canopy structure and a suitable understory environment to help regenerate understory vegetation (particularly key species targeted for regeneration as part of forest management objectives) and to achieve sustainable forest succession (Schwartz et al.2015;Forrester 2017).
Effects of thinning on photosynthesis and growth of P.bournei seedlings in the understory
Light is the most critical factor affecting regeneration and is essential in the survival,growth,and development of seedlings (Dumais et al.2018;Sendall et al.2018;Daryaei et al.2019).P.bournei,which is shade-tolerant at a young age and whose light requirements vary with age (An et al.2022),showed significant different responses to a more heterogeneous light environment relative to those reported in previous studies of pioneer species (shade intolerant species)(Gravel et al.2010;Zhang et al.2012;Santos and Ferreira 2020).Several studies have shown that light-induced leaf plasticity is intrinsically linked to the light requirements of plants and therefore,photosynthetic leaf traits are used to predict seedling growth (Poorter and Bongers 2006;Li et al.2017,2022).The leaf photosynthetic pathways (light interception,absorption,and use) ofP.bourneiresponded quickly and were highly correlated with the understory light environment.In particular,there was a strong intrinsic connection between R/FR and the photosynthetic capacity and growth performance of seedlings (Figs.4,6,7).Studies of plant response to red and far-red light have also found that a slight variation in R/FR can lead to large changes in the phytochrome balance,thus affecting the overall photomorphogenesis of the plant (e.g.,photosynthetic leaf traits)(Chelle et al.2007;Demotes-Mainard et al.2016).
Photosynthetic leaf traits represent the basic response of plants to changes in the light environment and can be used to predict growth (Santos and Ferreira 2020).Among them,the specific leaf area (SLA) reflects the ability of plant leaves to intercept light and to self-protect under strong light,which is closely related to the growth–survival trade-off of plants (Dahlgren et al.2006;Kennedy et al.2007).In this study,the SLA ofP.bourneiseedlings under low light was elevated and the light interception per unit of leaf biomass was increased (Fig.4a).In addition,because of the increased proportion of far-red and blue light above seedlings under the canopy (Table 2),the Chltotaland the percentage of chlorophyllbincreased (Fig.4b,c),and their absorption of red and blue-violet light was enhanced.Finazzi and Johnson(2016) and Zhen et al.(2022) proposed that far-red photons maintain the energy balance between PSII and PSI by enhancing the linear electron transport efficiency and stimulating the cyclic electron flow around PSI,resulting in less photooxidative damage,which may explain how low R/FR enhances the light use ofP.bournei.Light utilization ability can be effectively reflected by the chlorophyll fluorescence parameters Y(II) andFv/Fm(Peterson et al.2001).Immediately after thinning,the Y(II) andFv/FmofP.bourneiseedlings in the shade of a stand showed increased over time with greater shade.However,in theC.japonicaplantation in which canopies had closed over one year after thinning,the Y(II) of seedlings increased and then decreased as the canopy opening decreased (C3 in Fig.4d).This suggests that the light resources were severely limited and may have led to stress and reduced light utilization efficiency byP.bournei.A direct limiting factor for plant photosynthesis is stomatal conductance (gs) (Santos and Ferreira 2020).In this study,the light environment significantly affected thegsofP.bourneiseedlings (Fig.6) and showed a close internal relationship withAsatand RG (Fig.7).Similarly,Schima superbaGardn.&Champ.,which is shade-tolerant as a seedling,responds to rapid changes in the light environment by opening and closing its stomata rapidly (Zhang et al.2012).Therefore,we hypothesize that a rapid response depending on stomatal opening/closing may also be one of the main mechanisms by whichP.bourneiseedlings adapt to changes in the understory light environment to ensure efficient use of the light resource.The light-saturated photosynthesis rate (Asat) characterizes the carbon assimilation rate of plants (De Kauwe et al.2016).Based on our path analysis of the relationships between the factors (Fig.7),we hypothesize that the light environment (especially R/FR)indirectly acts on the carbon assimilation rate of plants by directly acting on each step in the photosynthetic pathway ofP.bourneiseedlings,thus affecting their overall growth and development.In addition,the photosynthetic performance ofP.bourneiseedlings grown in full sunlight was inhibited because their leaves had less ability to intercept,absorb,and use light,and lower stomatal conductance and carbon assimilation rates than seedlings grown in shade (Fig.4).Previous experiments on shade-tolerant tree species such asCryptocarya concinnaHance andSyzygium acuminatissimum(Blume) DC cultivated under intense light demonstrated that excess light energy produces toxic products such as superoxide,singlet oxygen,and peroxide which damage the photosynthetic system of plants and limit their growth and development if they are not safely dispersed in a timely manner (Zhang et al.2012;Roeber et al.2021).
Plant morphological adjustments to improve the use efficiency of light resources is one of the important strategies that plants use to adapt to environmental changes(Rosati et al.2013).Crown size is most directly related to light resource acquisition and growth.P.bourneiseedlings developed smaller crowns under both intense light (controls)and weak light (C3),which reflects their adaptation strategies to both intense and weak light stress.When light is too intense,seedlings reduce their crown area (Zhang et al.2018c);when light is too weak,access to the resource is insufficient and seedlings reduce crown investment,tolerate the weak light stress,and wait for conditions to improve(Zhang et al.2012).The light requirements ofP.bourneiare exacting: low light does not meet resource demands and needs to be enhanced to meet light conditions it requires;however,the species is inhibited by high light intensity if it is intentionally increased.Furthermore,its carbon accumulation potential is limited as a shade-tolerant plant;its carbon stocks are small and it faces special risks if it suffers serious light damage (Gravel et al.2010).Figure 5 shows that the height-to-diameter growth strategy ofP.bourneiseedlings also changed with CO (i.e.,the intensity of understory radiation).As light intensity decreased (CK to C3),height-to-diameter ratios increased (4.7–10.7),and seedlings transformed from a diameter growth advantage to a height growth advantage,changing their growth strategy from tolerance to pursuit of light.The findings of the path analysis of factor interactions (Fig.7) are consistent with the conclusions of Zhang et al.(2018b): the high proportion of far-red light in the understory may act as a ‘shade avoidance signal’to makeP.bourneiseedlings sensitive and responsive to shade,and the lower R/FR reduces the proportion of Pfr(far-red light-absorbing form) in the total phytochrome of the plant,inducing a higher level of gibberellin and auxin to promote high growth and the pursuit of light resources.In contrast,intense light may induce an increase in cytokinin and lead to an increased diameters (Demotes-Mainard et al.2016;Fraser et al.2016).Therefore,providing a suitable light environment forP.bourneiduring early growth is key to improving its photosynthetic performance and promoting growth and development.
How to optimize P. bournei juvenile planting by regulating light environment
Thinning is an important way to adjust and optimize the light environment of forests (Zhang et al.2018a).Over the year following the thinning treatments,the best performance ofP.bourneiin terms of growth and development was achieved by gradually transitioning from moderate to heavy thinning in all three stands.Under the same thinning intensity,P.bourneiin mixed stands performed best possibly because the light availability was greater than in pure coniferous or broadleaf stands.Pretzsch (2014),Forrester (2017)and Forrester et al.(2018) reported similar findings when they studied the canopy structure,light environment and physiological ecology of mixed and single species stands.The greatest reduction in radiation intensity over time was in theC.japonicaplantation after thinning.However,the proportion of far-red light in the understory was higher than that in the other stands and induced greater upward growth by the seedlings and thus enabled them to obtain light resources(Zhen et al.2022).The better early performance ofP.bourneiin theC.japonicaplantation was also achieved after one year of heavy thinning.However,after heavy thinning of theQ.acutissimaplantation,P.bourneishowed intense light suppression;height growth was limited,therefore we suggest that the optimal thinning intensity for aQ.acutissimaplantation would be between heavy and moderate.Studies by Midgley et al.(2002) and Aiba et al.(2007) indicated that there may be competition for light resource utilization in forests with a mixture of broadleaf species,but the productivity of mixed coniferous and broadleaf forests was higher than that of broadleaf mixed forests.
Based on the best treatment for the growth and development ofP.bourneisaplings in this study,a suitable understory light environment has a photosynthetic photon flux density of 19.1–22.6 mol m–2d–1and a red/far red radiation ratio of 1.0–1.2.Forest managers should not only consider the canopy structure,light conditions,and species composition of stands but also the biological characteristics of species to achieve afforestation targets (Daryaei et al.2019).A suitable light environment should be created for the understory vegetation and a healthy,stable canopy and stand environment should be established to promote the growth and development of the residual stand (Beaudet et al.2011;Santos et al.2020).
Conclusion
Improvement of the stand light environment by thinning varies,depending on thinning intensity and species composition.Among the three typical stands investigated,the understory light environment of the mixed stand after heavy thinning was the most favorable for the growth ofP.bourneiseedlings,resulting in the largest relative growth.The R/FR ratio is a key light environment factor,regulating the growth and development ofP.bournei.Photosynthetic leaf traits can predict the early silvicultural benefits ofP.bournei.Increasing the canopy opening enhances light availability in the understory and improve the light resource use capacity to promote photosynthesis and growth of the seedlings.However,growth is inhibited under intense light.Therefore,afforestation should be combined with sustainable management,avoiding the establishment ofP.bourneiseedlings in full sun,and usingP.bourneifor species restructuring or forest quality improvement.Awareness of forest management goals and of the species that comprise the stand should be undertaken to develop targeted afforestation programs.
AcknowledgementsWe acknowledge the State-owned Zhazuo Forest Farm that supported all fieldwork.We would also like to thank the editor,associate editor,and anonymous reviewers for their helpful feedback and valuable suggestions.
Open AccessThis article is licensed under a Creative Commons Attribution 4.0 International License,which permits use,sharing,adaptation,distribution and reproduction in any medium or format,as long as you give appropriate credit to the original author(s) and the source,provide a link to the Creative Commons licence,and indicate if changes were made.The images or other third party material in this article are included in the article’s Creative Commons licence,unless indicated otherwise in a credit line to the material.If material is not included in the article’s Creative Commons licence and your intended use is not permitted by statutory regulation or exceeds the permitted use,you will need to obtain permission directly from the copyright holder.To view a copy of this licence,visit http://creativecommons.org/licenses/by/4.0/.
杂志排行
Journal of Forestry Research的其它文章
- Physiological and psychological responses to tended plant communities with varying color characteristics
- Climate‑change habitat shifts for the vulnerable endemic oak species (Quercus arkansana Sarg.)
- Plant growth and metabolism of exotic and native Crotalaria species for mine land rehabilitation in the Amazon
- Peat properties of a tropical forest reserve adjacent to a fire-break canal
- Impact of cattle density on the structure and natural regeneration of a turkey oak stand on an agrosilvopastoral farm in central Italy
- Climate-growth relationships of Pinus tabuliformis along an altitudinal gradient on Baiyunshan Mountain,Central China
