2D/3D S-Scheme Heterojunction Interface of CeO2-Cu2O Promotes Ordered Charge Transfer for Efficient Photocatalytic Hydrogen Evolution
2024-01-22LijunZhangYoulinWuNoritatsuTsubakiZhiliangJin
Lijun Zhang ,Youlin Wu ,Noritatsu Tsubaki ,Zhiliang Jin ,*
1 School of Chemistry and Chemical Engineering,North Minzu University,Yinchuan 750021,China.
2 Department of Applied Chemistry,Graduate School of Engineering,University of Toyama,Gofuku 3190,Toyama 930-8555,Japan.
Abstract: Rapid intrinsic carrier recombination severely restricts the photocatalytic activity of CeO2-based catalytic materials.In this study,a heterogeneous interfacial engineering strategy is proposed to rationally perform interface modulation.A 2D/3D Sscheme heterojunction with strong electronic interactions was constructed.A composite photocatalyst was synthesized for the 3D Cu2O particles anchored at the edge of 2D CeO2.Firstprinciples calculations (based on density functional theory) and the experimental results show that a strongly coupled S-scheme heterojunction electron transport interface is formed between CeO2 and Cu2O,resulting in efficient carrier separation and transfer.The photocatalytic hydrogen evolution activity of the composite catalyst is significantly improved in the system with triethanolamine as the sacrificial agent and is 48 times as that of CeO2.In addition,the resulting CeO2-Cu2O photocatalyst affords highly stable photocatalytic hydrogen activity.This provides a general technique for constructing unique interfaces in novel nanocomposite structures.
Key Words: CeO2; Cu2O; DFT; S-scheme heterostructure; Photocatalytic hydrogen evolution Received: February 28,2023; Revised: April 7,2023; Accepted: April 10,2023; Published online: April 17,2023.*Corresponding authors.Emails: zl-jin@nun.edu.cn (Z.J.); tsubaki@eng.u-toyama.ac.jp (N.T.)The project was supported by the National Natural Science Foundation of China (22062001),the Innovative Team for Transforming Waste Cooking Oil into Clean Energy and High Value-Added Chemicals,Ningxia Low-Grade Resource High Value Utilization and Environmental Chemical Integration Technology Innovation Team Project.
1 Introduction
The current global energysituation is becoming increasingly severe,and energy supply crises occur occasionally1,2.To cope with the continuous depletion of fossil fuel reserves,clean and renewable energy development must be relentlessly pursued1,2.Hydrogen has the advantages of high calorific value,clean,green,storable and renewable3,4.Solar-driven photocatalytic water splitting hydrogen production is considered one of the most promising approaches to overcoming severe global energy and environmental challenges5,6.To this end,researchers have long been committed to developing semiconductor catalysts with high conversion efficiency and have made some progress6–9.So far,the rational construction of photocatalysts is still the focus of photocatalytic technology development.Due to the low carrier mobility and disorder,the construction of interfacial heterojunctions and the development of composite materials with special morphology are the current challenges in the development of new materials10–12.
Ceria is an n-type semiconductor with a suitable band gap in the visible light13,14.CeO2material has attracted much attention due to its abundant oxygen defects and high redox capacity as well as low-cost of preparation15.The disadvantages of fast electron-hole recombination and low quantum efficiency seriously restrict the application of CeO2in the field of photocatalysis16,17.Previous research results have shown that the nonideal photocatalytic performance of CeO2was mainly due to its intrinsic carrier recombined at great speed.It is expected to improve the utilization of ceria for solar energy by constructing a heterojunction strategy18,19.Combining CeO2with narrow bandgap materials,which can overcome the band edge position and light absorption limitation of CeO2.Facilitates carrier separation is an interesting research area15,20–22.Cuprous oxide (Cu2O),as a typical direct narrow-bandgap p-type semiconductor material,has interesting optical and remarkable magnetic properties19,23–25.Cu2O has a high light absorption coefficient and narrow bandgap thus often served as a cocatalyst in photocatalytic reactions26,27.Affordable prices,ease of use and low toxicity make it recognized as an outstanding candidate for low-priced photovoltaic applications12,25,28.
In this work,2D CeO2nanosheets were synthesized by simple calcination,and a p-type Cu2O semiconductor was used to advance the photocatalytic capability of n-type CeO2.Different numbers of Cu2O nano-octahedral particles are anchored to the 2D CeO2edge,and the nanosheets are combined with the octahedron (2D/3D) to construct a heterojunction interface.The loading energy of Cu2O greatly broadens the light absorption range of the photocatalyst.The construction of CeO2-Cu2O Sscheme heterojunction can effectively improve the migration of photogenerated carriers and inhibit the recombination of e--h+.DFT first-principles analysis confirmed the promotion of CeO2charge carriersviaintroducing cuprous oxide.In addition,the electron and hole effective mass calculations provide a more indepth analysis of the charge separation mechanism at the CeO2-Cu2O interface and the role of the interface S-scheme heterojunction.The CeO2-Cu2O S-scheme heterojunction composite photocatalyst significantly improves the charge transfer efficiency due to the presence of the built-in electric field,which makes the hydrogen evolution activity a qualitative leap compared with CeO2.This work has imperative reference significance for the rational construction of the interface of novel nanocomposite structures.
2 Experimental section
Cerium nitrate (CeN3O9∙6H2O,Macklin,China,CAS: 10294-41-4,99.95% metals basis),copper acetate (C4H6CuO4∙H2O,Macklin,China,CAS: 6046-93-1,99.95% metals basis),ammonium bicarbonate (NH4HCO3,Sinopharm Group,China,CAS: 1066-33-7,AR),sodium hydroxide (NaOH,Sinopharm Group,China,CAS: 1310-73-2,AR),D(+)-glucose(C6H12O6∙H2O,Sinopharm Group,China,CAS:14431-43-7,Lot#20180129,AR),sodium sulfate (Na2SO4,Aladdin,China,CAS: 7757-82-6,AR),Eosin-Y (C20H6Br4Na2O5,Aladdin,China,CAS: 17372-87-1,Lot# F2226550,AR).All these reagents were used as received without any further purification.
2.1 Synthesis of CeO2 nanosheets
Dissolve 0.01 mol Ce(NO3)3∙6H2O and 0.03 mol ammonium bicarbonate (NH4HCO3) in water,respectively.The two solutions were then quickly mixed,stirred for 0.5 h,and aged at 30 °C for 20 h.After filtration and washing,it was dried overnight in an oven.Finally,calcined at 500 °C in the air to obtain light yellow CeO2nanosheets.
2.2 Cu2O octahedron synthesis
First,0.015 mol Copper acetate was dissolved in a 60 mL mixed solution of deionized water and ethanol (45 mL deionized water and 15 mL ethanol) and stirred for 60 min.Then Sodium hydroxide solution (0.09 mol,20 mL H2O) was added dropwise.After continuous stirring for 10 min,0.015 mol D(+)-glucose(C6H12O6∙H2O) monohydrate was added and stirred for a further 10 min in a water bath at 70 °C.Centrifuge and wash samples,then dry them in a vacuum oven.
2.3 Synthesis of CeO2-Cu2O composite photocatalyst
Disperse 0.35 g CeO2in 100 mL mixed solution of deionized water and ethanol (75 mL deionized water and 25 mL ethanol).Then 0.1 mol∙L-1copper acetate and 0.6 mol∙L-1sodium hydroxide were added sequentially.After continuous stirring for 10 min,C6H12O6∙H2O was added and stirred for an additional 10 min in a 70 °C water bath.The CeO2-Cu2O composite catalysts were designated as CCO-1,CCO-2,CCO-3 and CCO-4.The construction process of the composite photocatalyst can be referred to in Fig.1.The amount and the actual composition of the synthetic precursors of the composite catalysts are shown in Table 1.

Table 1 Composite catalyst synthesis precursor dosage and the actual composition.
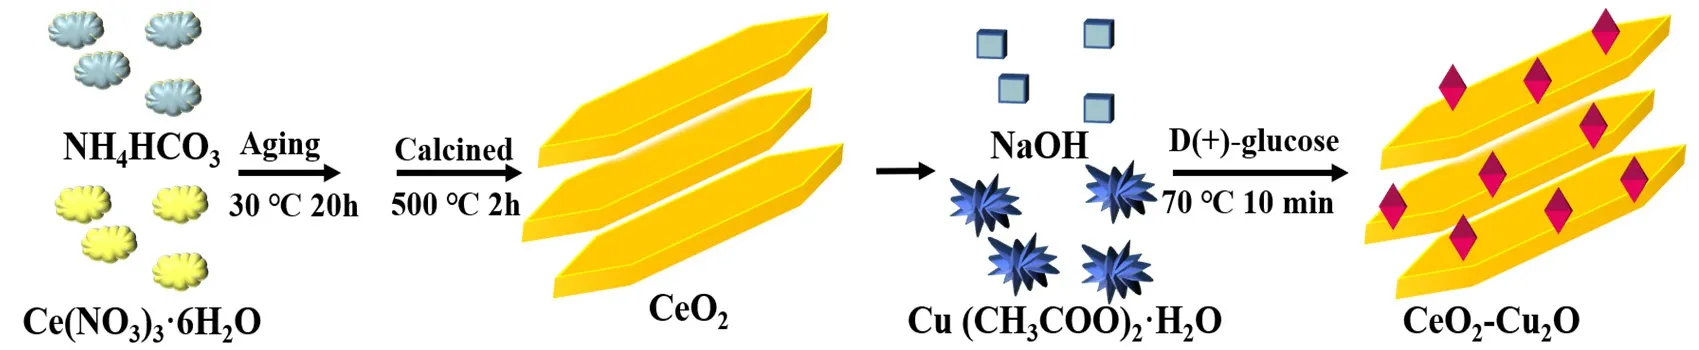
Fig.1 Schematic diagram of the synthesis of photocatalysts.
2.4 Characterization methods
The morphological test of the catalyst was carried out by Zeiss'’ evo10 SEM (Carl Zeiss AG,Germany) and JEM-2100 TEM (FEI,USA).The structure of the photocatalyst was studied using a HORIBA Scientific XRD (France).The photocatalyst surface’s element composition and valence state were determined by ESCALAB Xi+ XPS (Thermo-fisher,USA).UVVis DRS (UV-Vis diffuse reflectance spectrum) was carried out with BaSO4as the background using a Shimadzu UV-2550 spectrometer (Shimadzu,Japan).The fluorescent adsorptiondesorption isotherms of photocatalysts were obtained using ASAP2460M (USA) at 77 K with liquid nitrogen temperature control.Use the FLUOROMAX-4 spectrophotometer (HORIBA Scientific,France) for the photoluminescence spectrum test.DFT (density functional theory) calculations were performed based on first-principles density functional theoryviaVASP coding.When optimizing the structure,the upper limit of the Herman-Feynman force of atoms was 0.005 eV∙Å-1(1 Å = 0.1 nm).The truncation kinetic energy was set to 400 eV.
2.5 Electrochemical measurements
A mixture of 100 μL absolute ethanol and 5% Nafion solution was added to 5 mg of photocatalyst,and a suspension was formed after ultrasonic dispersion.Evenly drop the suspension onto the surface of the FTO conductive glass,control the dropping area to 1 cm × 1 cm,and dry it naturally to obtain the photoelectrode.Using a three-electrode system,the photoelectrochemical test was carried in Na2SO4solution by Versastat4-400 electrochemical workstation (Advanced measurement Technology,Inc,USA).Transient photocurrent measurement experiments were performed at open circuit potential.A 300 W Xenon-lamp was used as a simulated visible light source.The linear voltammetry curve,electrochemical impedance spectrum and Mott-Schottky curve were tested at room temperature without an external light source.The scan rate of the LSV (linear sweep voltammetry) curve was 5 mV∙s-1.EIS were obtained at open circuit potential from 0.1 Hz to 10000 Hz in the frequency range.The test frequency for the Mott-Schottky test was 1000 Hz.
2.6 Hydrogen production experiments
The performance evaluation of photocatalysts was carried out on PCX-50B multi-channel photochemical reaction.The light source of the reactor was a 5 W (λ≥ 420 nm) white light LED.The reaction vessel was a quartz bottle (62 mL) with a flat window with a diameter of about 3.4 cm at the bottom.20 mg photosensitizer and 10 mg photocatalyst were ultrasonically dispersed in 30 mL TEOA solution.The air in the reaction system was replaced by nitrogen.Extract 0.5 mL of gas from the reactor per hour and perform gas detection on a GC7900 gas chromatography (equipped with a TCD detector,the chromatographic column is 13X,the carrier gas was N2.).
3 Results and discussion
3.1 XRD analysis and DFT calculation
The crystal structures of the synthesized CeO2,Cu2O and a series of CeO2-Cu2O (CCO-x(x= 1,2,3,4)) composite photocatalysts were analyzed by XRD (X-ray diffraction).In Fig.2a,the cubic CeO2exhibits strong diffraction signals at 28.71°,33.12°,47.58° and 56.23°,which correspond to (111),(200),(220) and (311) planes of CeO2,respectively19,29.Similar pure Cu2O also corresponds well to the standard card of cubic phase Cu2O.The diffraction peaks of the (111),(200),and (220)planes of Cu2O are at 36.44°,42.42° and 61.48°30,31.No impurity peaks were found in the XRD patterns of CeO2and Cu2O,indicating that the samples have good crystallinity and high purity29,32.In Fig.2b,the CCO-x(x= 1,2,3,4) composite photocatalyst has both CeO2and Cu2O diffraction signals.In addition,with the increase of Cu2O content,the corresponding diffraction peak intensity of Cu2O gradually increases.This indicates that Cu2O was successfully introduced into the composite system without affecting the crystal structure of CeO2.
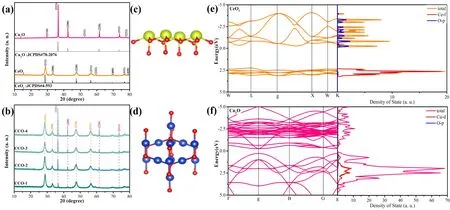
Fig.2 Structural model of CeO2 (a) andCu2O (b); structural model of CeO2 (c) and Cu2O (d);band structure and DOS of (e) CeO2 and (f) Cu2O.Color online.
Based on the XRD data of the combined materials,the unit cell structures of CeO2and Cu2O were constructed with theFm-3mspace group of CeO2and the Cu2OFn-3mspace group,respectively,as displayed in Fig.2c,d.The yellow,red and blue colored balls represent Ce,O and Cu atoms,respectively.The DOS and band structures of CeO2and Cu2O were calculated using density functional theory to understand the properties of the materials30.The calculation results show that CeO2is a direct bandgap semiconductor.Fig.2e reveals that the CeO2band gap value calculated by DFT is 2.635 eV,which is close to the subsequent experimental results12,33.Moreover,the density of states of CeO2indicates that the conduction band (CB) and valence bands (VB) of the semiconductor are determined by the valence electron cloud density of O and Ce,respectively34.
The images of the band structure and DOS function of Cu2O are displayed in Fig.2e,f,and Cu2O exhibits typical semiconducting properties.Density functional theory can theoretically calculate the effective mass of electrons and holes to understand the charge separation at the interface13.Because the effective mass of electrons and holes in semiconductors is inversely proportional to the mobility34–37.The effective electron mass (me) at the bottom of the CB and the effective hole mass (mh) at the top of the VB of CeO2and Cu2O can be calculated by the formulaE=ħ2k2/2me/hm0,wherem0represents the rest mass of the electron13,38.Calculations show that the electron effective mass in Cu2O was smaller,and the electron mobility is higher.The effective mass of holes in CeO2is smaller than that of electrons,so the mobility of holes is higher.The introduction of Cu2O on the CeO2surface is expected to improve the mobility of charge carriers13,thereby enhancing the separation of photogenerated charge carriers in the CeO2-Cu2O S-scheme heterojunction13,39,40.
3.2 Surface structure and composition analysis
The evolution of the photocatalyst microstructure is understood by electron microscopy.As shown in Fig.3a,the synthesized CeO2was in the form of flakes,and the surface was flat and smooth.Glucose reduces the freshly prepared copper hydroxide,and the obtained cuprous oxide brick-red powder is a small and uniform octahedron,as shown in Fig.3b.When preparing the CCO-3 composite photocatalyst,the flake CeO2was dispersed first,and then the cuprous oxide octahedron was grown on the surface.In Fig.3c,the cuprous oxide is not simply compounded on the CeO2surface but grows directly on edge and anchors on the CeO2surface to build a stable 2D/3D interface.The TEM images of Fig.3d further confirmed the growth of Cu2O on CeO2nanosheets.The 2D nanosheets are uniform in texture and have Cu2O particles anchored at the edges.

Fig.3 SEM images of (a) CeO2,(b) Cu2O,(c) CeO2-Cu2O samples;(d) TEM,(e,f) HRTEM images and mapping (g) test of CCO-3.
The HRTEM image of CeO2-Cu2O (Fig.3e) can find CeO2(111) crystal planes with a lattice spacing of 0.31 nm29,32.The HRTEM image of CCO-3 in Fig.3f can observe the interface between CeO2and Cu2O,and also find the lattice fringes of the Cu2O (200) crystal plane,and thedvalue is about 0.21 nm30.Fig.3g was the sample element map,Ce,O and Cu elements exist in the sample.In addition,as displayed in Fig.4a,the Zeta potential of pure CeO2surface is negative.The positively charged copper ions and pure Cu2O are more easily attached to the surface of CeO2nanosheets under electrostatic attraction.

Fig.4 (a) Zeta potential comparison of CeO2 and Cu2O samples.(b) The survey XPS spectra of CeO2-Cu2O.(c) Ce 3d,(d) O 1s;(e) Cu 2p; (f) Cu LMM high-resolution XPS spectra.
The surface element states of the as-prepared CeO2-Cu2O(CCO-3) photocatalysts were tested by XPS (X-ray photoelectron spectroscopy).The XPS full-spectrum and XPS high-resolution Ce 3d,O 1s,Cu 2pand CuLMMspectra are interpreted in Fig.4b–f.The XPS full spectrum was shown in Fig.4b shows that CCO-3 photocatalyst mainly contains elements such as Ce,Cu and O.The fine spectrum of cerium shows that the Ce 3d3/2partial curve shows four peaks at 916.62,907.59,903.17 and 900.82 eV (Fig.4c).The four peaks of the similar Ce 3d5/2curve are at 898.18,888.83,883.93 and 882.22 eV,respectively16.The signals at 903.17 and 883.93 eV are characteristic of Ce3+,indicating the presence of oxygen vacancies in CCO-3 nanomaterials41,42.In Fig.4d,the two peaks located at 529.28 and 531.35 eV can correspond to lattice oxygen and oxygen in the presence of hydroxyl groups on the surface or adsorbed water molecules18,29,43,respectively.In Fig.4e,Cu1+has two characteristic peaks at 932.19 and 952.07 eV in the Cu 2pspectrum.The small uplift oscillation in the middle region of Cu 2pmay be related to the oxidation of the sample surface and the increase of the valence of copper.The presence of the CuLMMpeak at 569.74 eV is characteristic of the Cu1+species (Fig.4f)18,43.These XPS results clearly show the elemental composition and binding information of CCO-3.
3.3 Photocatalytic hydrogen evolution performance
During dark reaction experiments,H2was not detected in all samples.As displayed in Fig.5a,b the rapidly recombined charge carriers in CeO2nanosheets restrict their photocatalytic activity.The CeO2hydrogen evolution curve is flat.The Cu2O nano-octahedral catalyst has a certain activity.The hydrogen production from CeO2to CeO2-Cu2O increased significantly(Fig.5b).The different contents of Cu2O introduced have different promoting effects,and the catalytic activity from CCO-1 to CCO-4 has a process of first increasing and then decreasing.The CCO-3 composite photocatalyst can achieve 48 times the hydrogen production of pure CeO2(Fig.5c).The introduction of Cu2O molecules on the CeO2surface constructs an ordered electron flow pathway,thereby enhancing the separation of generated carriers in the CeO2-Cu2O.The superiority of the CCO-3 was also reflected in its stability.As shown in Fig.5d,the CCO-3 composite photocatalyst undergoes a stability cycling test for 20 h (4 cycles).After each operation for 5 h,all hydrogen in the system was directly removed,and the reaction solution remained unchanged.The photocatalyst showed a certain photocatalytic hydrogen production performance in each cycle,and the activity was basically stable within 20 h.The photocatalyst’s XPS and XRD test results before and after hydrogen production are shown in Fig.5e,f.Fig.5e interpreted the XPS fine spectrum of Cu 2p.The valence state of Cu element hardly changes before and after the reaction,and the catalyst composition is stable.It is found from Fig.5f that the CeO2-Cu2O (CCO-3) has a stable crystal structure.
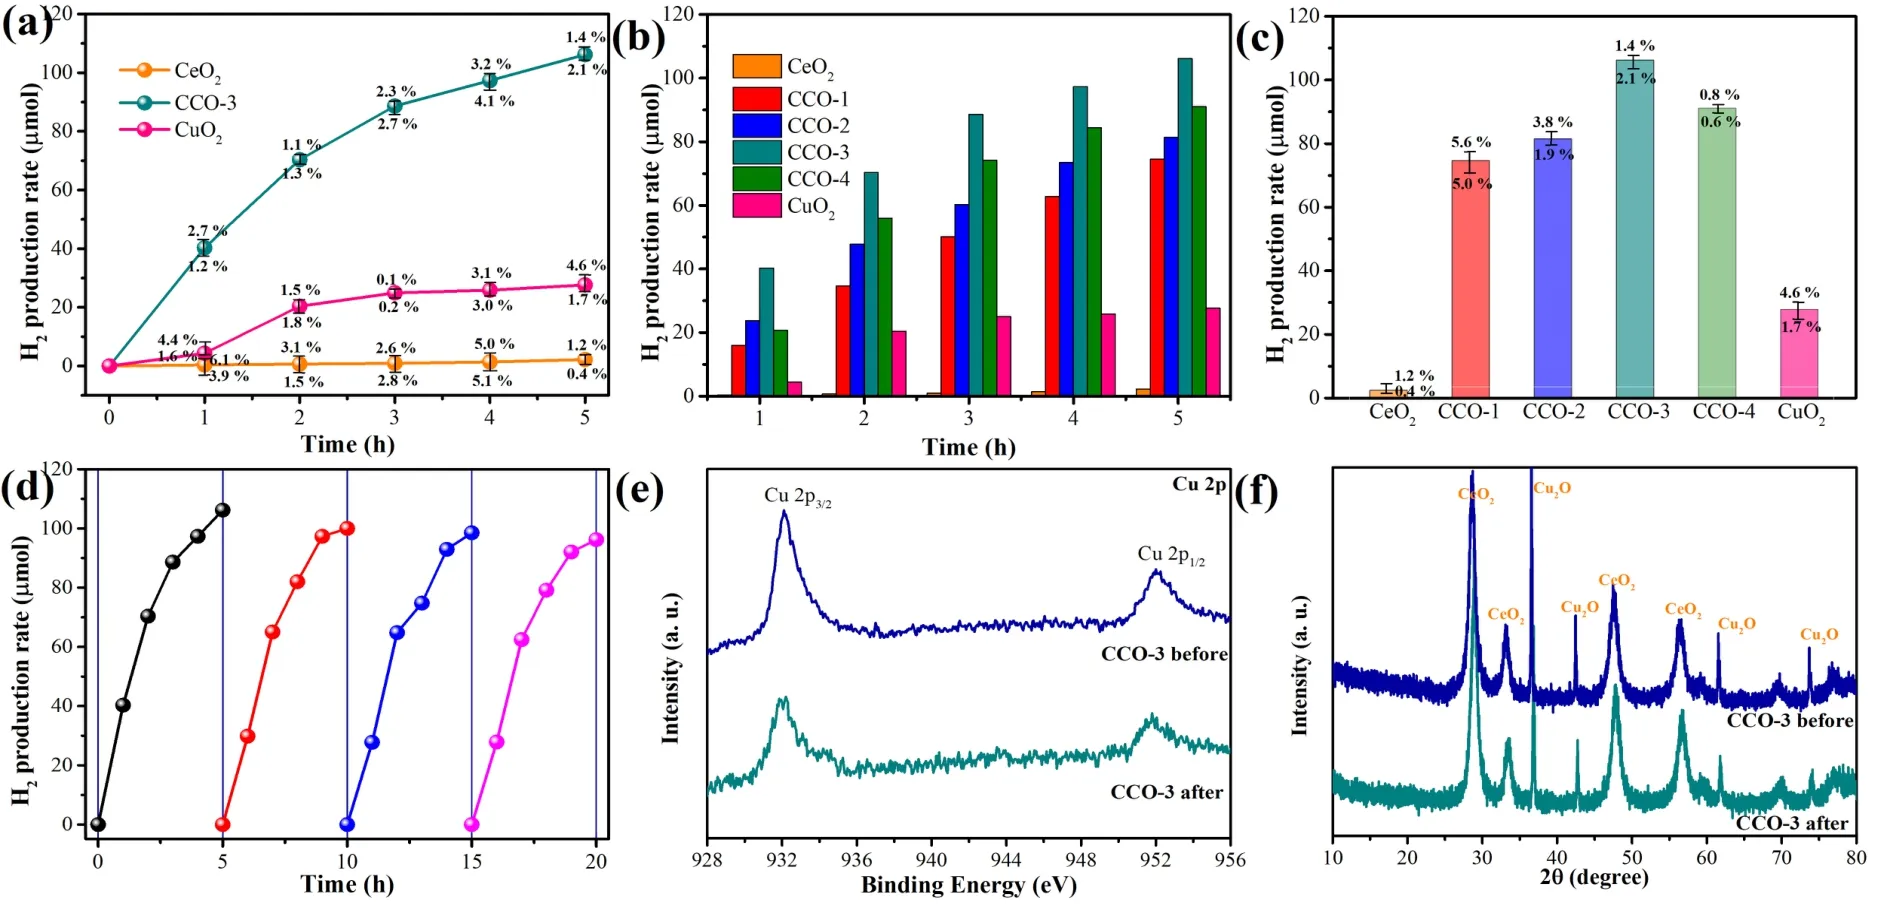
Fig.5 (a) Activity comparison of CeO2,Cu2O and CCO-3; (b,c) Activity comparison of CeO2,CCO-x (x = 1,2,3,4) and Cu2O;(d) Hydrogen production stability test of CCO-3.(e) Comparison of Cu 2p high-resolution XPS before and after the reaction of CCO-3.(f) XRD comparison of CCO-3 before and after reaction.
3.4 Photoelectrochemical performance analysis
As revealed in Fig.6a,all models exhibit some light absorption capability.The absorption band edge of CeO2was around 460 nm,while that of brick red Cu2O was around 682 nm.Using the Kubelka-Munk method,the calculated band gaps of CeO2and Cu2O are 2.69 and 1.82 eV,respectively30,44.The absorption of CCO-3 samples in the visible light range was between that of pure CeO2and Cu2O.For the Cu2O and CCO-3 composite photocatalysts,the broad and weak band in the 600–800 nm region can be attributed to the 2Eg→ 2T2gspins caused by thed-dtransition of the divalent copper Cu2+ions generated by a small amount of oxidation15,45,46.Therefore,loading Cu2O on CeO2can improve the adsorption of visible light,resulting in more charges and holes generated under light irradiation.

Fig.6 (a) CeO2,Cu2O and CCO-3 UV-Vis diffuse reflectance curves,photoinduced Luminescence spectra of CeO2,(b,c) Cu2O and CCO-x (x = 1,2,3,4) photocatalysts and (d) photoluminescence decay spectra of CeO2,Cu2O and CCO-3 photocatalysts.
Steady-state fluorescence tests investigated the photoluminescence and quenching of EY30,47.In Fig.6b,it can be seen that the intrinsic emission peak of eosin is about 543 nm.If the recombination rate of photogenerated e--h+was higher,the emission peak was the stronger intensity48.After the introduction of the semiconductor photocatalyst,the EY molecule was quenched and the intensity of the fluorescence emission peak decreases29,30,49.The CCO-3 composite photocatalyst has the best fluorescence quenching performance.This indicates that the interaction between the CeO2-Cu2O and the photosensitizer is stronger after the introduction of Cu2O on the CeO2surface29,30.Fig.6c was a comparison of steady-state fluorescence spectra of composite samples with different Cu2O contents.With the increase of Cu2O content,the peaks of CCO-1 to CCO-4 samples first decreased and then increased.Therefore,too much Cu2O may hurt the migration of carriers on the CeO2surface,which was not conducive to the improvement of photocatalytic activity47,50.Quenching mechanism of the EY molecule and its interaction with catalysts can be further studied by time-resolved photoluminescence spectroscopy30,50.In Fig.6d,the average lifetime ratios for pure CeO2and pure Cu2O samples are 0.267 and 0.254 ns,respectively,which are both smaller than those of pure eosin (0.289 ns).The mobility of internal charge carriers is enhanced after the introduction of Cu2O on the CeO2surface,and the average lifetime of CCO-3 is further reduced to 0.233 ns.The shorter fluorescence lifetime means faster photo-generated carrier transfer,which is more favorable for photocatalytic hydrogen evolution48,50–52.
The separation and migration of photogenerated electrons in composite catalysts can be studied by photocurrent response.Fig.7a displays the photocurrent responses of CeO2,Cu2O and CCO-3.Photocatalysts flow photogenerated electrons under discontinuous intermittent light irradiation to generate a corresponding photocurrent53,54.Pure CeO2and pure Cu2O exhibit lower photocurrent densities,indicating lower photoelectron transfer rates and higher electron-hole recombination rates.The carrier mobility is enhanced after the introduction of Cu2O on the CeO2surface,thereby enhancing the separation of photogenerated carriers in the CeO2-Cu2O heterojunction50,54.
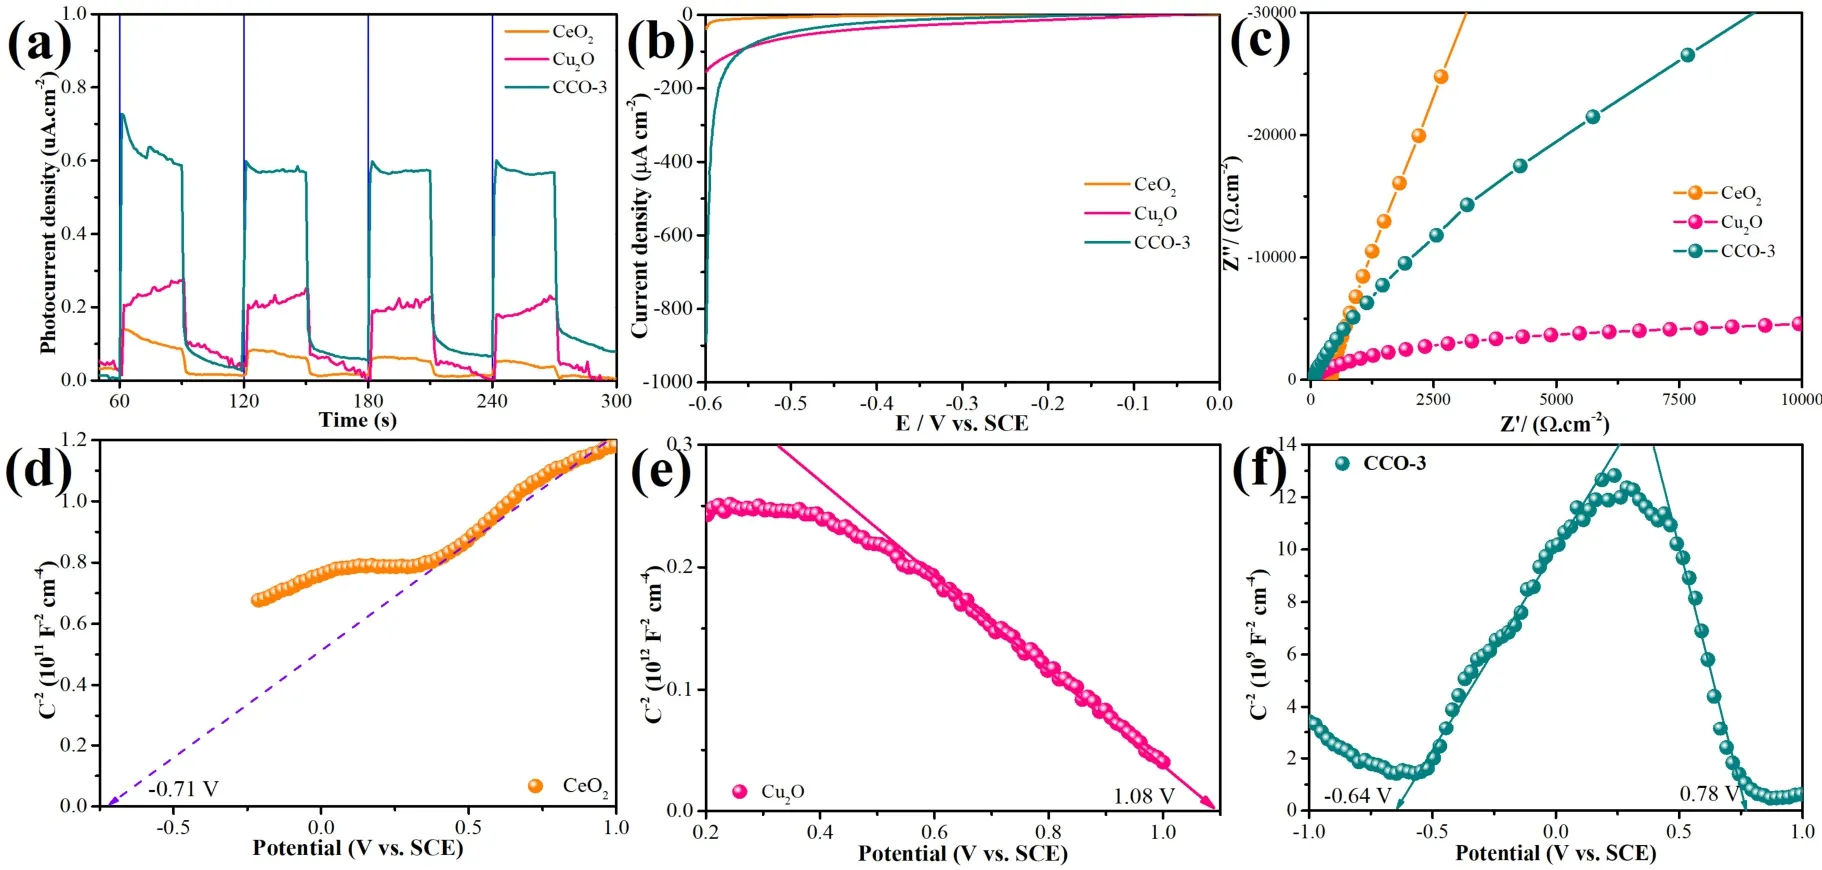
Fig.7 (a) I–T curves,(b) LSV curves and (c) EIS curves of CeO2,Cu2O and CCO-3; Mott-Schottky curve of (d) CeO2,(e) Cu2O and (f) CCO-3.
The LSV curve as a function of voltage and current density can be used to understand the hydrogen evolution overpotential of the photocatalyst49,50.The CCO-3 photocatalysis exhibits the largest cathodic current (Fig.7b),which indicates that the composite sample of Cu2O in conjunction with CeO2significantly overcomes the reaction overpotential and thus strongly promotes HER49,55.Fig.7c shows the electrochemical impedance spectroscopy results.Pure CeO2exhibits considerable opposition to the mass transfer process of electrons49,56,57.The CCO-3 photocatalyst exhibits better electrochemical performance than CeO2,indicating that introduction Cu2O plays a decisive role in promoting electron transfer30,49,50.
Mott-Schottky plot tests of CeO2,Cu2O and CCO-3 composite catalysts are interpreted as shown in Fig.7d–f.In Fig.7d,the slope of the CeO2curve is positive,showing n-type semiconductor characteristics.The difference is that Cu2O exhibits a negative slope of theE–C2curve,revealing the p-type semiconductor properties of Cu2O (Fig.7e).The results show that if Cu2O is combined with CeO2,a CeO2-Cu2O S-scheme heterojunction will be formed.TheEfb(flat band potential) of CeO2is about -0.71 V.Since theECBof an n-type semiconductor was 0.1 or 0.2 V more negative compared to its flat-band potential30,49,50.TheECBof CeO2is -0.67 V compared to a standard hydrogen electrode (ENHE=ESCE+ 0.241 V)49,50,54,55.TheEfbof Cu2O is about 1.08 V,theEVBof p-type semiconductors was about 0.1 or 0.2 V more correct thanEfb,so the Cu2OEVBis about 1.28 VvsSCE32,50.The Mott-Schottky curve of the CCO-3 composite catalyst consists of two linear regions,which can be attributed to theEfbcontributed by Cu2O and CeO2in the sample (Fig.7f).This is due to the formation of after CeO2couples Cu2O S-scheme heterojunction,resulting in a shift of the Fermi level,inward contraction of the curve7,58–60.
3.5 Possible photocatalytic mechanism
The energy band positions of Cu2O and CeO2before and after contact are shown in Fig.8,based on the above calculation results.Since the Cu2O Fermi level was close to the VB,the CeO2Fermi level was closer to the conduction band50,61,62.When Cu2O and CeO2are in contact,the Fermi level at the interface between the two tends to balance60,63.The electron flow between the semiconductors is triggered,generating a built IEF (In electric field) at the CeO2-Cu2O 2D/3D contact interface9,12,50,64.CeO2has a high Fermi energy level,loses electrons at the interface,and the energy band bends upward.On the contrary,Cu2O has a low Fermi energy level,gains electrons at the interface,and the energy band bends downward63,64.The direction of the built IEF was from CeO2to Cu2O60,65.Photogenerated e-and h+are produced when CeO2and Cu2O are excited by visible light.Driven by the interface IEF,the photogenerated electrons in Cu2O CB will spontaneously flow into the CeO2VB to neutralize the holes12.Following this,H2O molecules are activated on the conduction band of CeO2with a high reduction potential to generate H212,57.The S-scheme heterojunction between CeO2-Cu2O drives the carrier transport to follow the flow path57,66.When illuminated,the EY (Eosin Y) adsorbed on the CeO2-Cu2O surface are excited,and the EY1*singlet excited state was first formed when it is exposed to light.EY1*further transfers to the more EY3*stable triplet excited state by Intersystem Crossing21,30.TEOA has an electron-donating effect that makesEY3*quenched by reduction to form EY-48,50.The EY-electrons are transferred to the CeO2-Cu2O active surface,and the H2precipitation occurs in the conduction band through the reduction reaction50.The EY molecules return to the ground state50.The Cu2O introduction significantly improves the carrier mobility of CeO2-Cu2O.The electrons transfer to the CeO2CBand quickly consume in the hydrogen evolution reaction of reduced water.The holes that are left in the VB of photocatalytic are finally effectively removed by triethanolamine3,9,12,47,61.Triethanolamine,as a sacrificial reagent,opportunely consumes the photogenerated holes in the photocatalytic VB,contributing to the system’s stability.Triethanolamine,as a sacrificial reagent,consumes the photogenerated holes in the VB of photocatalytic in a timely and efficient manner,which contributes to the system’s stability30,48,67,68.The construction of the S-scheme heterojunction effectively promotes electron transfer and improves the mobility of carriers.Which in turn significantly improves photocatalytic performance and hydrogen evolution activity.

Fig.8 Photocatalytic mechanism of CeO2-Cu2O S-scheme heterojunction.
4 Conclusions
In summary,an S-scheme heterojunction composite photocatalyst was successfully synthesized with 3D Cu2O particles anchored at the edge of the 2D CeO2nanosheets.DFT first-principles calculations and experimental results show that a strongly coupled electron transport interface can be formed between CeO2and Cu2O.The introduction of Cu2O on the CeO2surface can effectively improve the carrier’s migration.The special 2D/3D interfacial contacts synergize with the S-scheme heterojunction and enabling efficient carrier separation and transfer.The CeO2-Cu2O composite photocatalyst thus has durable and excellent photocatalytic activity.This work effectively improves the photocatalytic activity of CeO2based catalytic materials and provides a general interfacial heterojunction strategy for CeO2-based photocatalysts with activity strong and stability high.
Conflicts of interest:The authors declare no competing interests.
Author contributions: Lijun Zhang,Zhiliang Jin and Noritatsu Tsubaki conceived and designed the experiments;Zhiliang Jin contributed reagents/materials and analysis tools;Lijun Zhang wrote the paper.Youlin Wu assisted in the testing of some experiments.
杂志排行
物理化学学报的其它文章
- Recent Advances in Self-Supported Transition-Metal-Based Electrocatalysts for Seawater Oxidation
- 用于高灵敏快速核酸检测的荧光碳点
- Introducing Novel,Multiple Cd Coordination Modes into Gold Nanoclusters by Combined Doping for Enhancing Electrocatalytic Performance
- 电催化二氧化碳还原催化剂、电解液、反应器和隔膜研究进展
- 利用多氟丙烯酸酯添加剂提升准二维钙钛矿发光二极管性能
- 电子自旋效应在电催化剂中的作用