Subsoil tillage enhances wheat productivity,soil organic carbon and available nutrient status in dryland fields
2024-01-17QiuyanYanLinjiaWuFeiDongShuangduiYanFengLiYaqinJiaJianchengZhangRuifuZhangXiaoHuang
Qiuyan Yan ,Linjia Wu ,Fei Dong ,Shuangdui Yan ,Feng Li ,Yaqin JiaJiancheng Zhang#,Ruifu Zhang,Xiao Huang
1 Institute of Wheat Research,Shanxi Agricultural University,Linfen 041000,China
2 State Key Laboratory of Sustainable Dryland Agriculture (in preparation),Shanxi Agricultural University,Taiyuan 030031,China
3 College of Resources and Environment,Shanxi Agricultural University,Taigu 030801,China
4 Jiangsu Key Lab and Engineering Center for Solid Organic Waste Utilization,National Engineering Research Center for Organicbased Fertilizers,Nanjing Agricultural University,Nanjing 210095,China
Abstract Tillage practices during the fallow period benefit water storage and yield in dryland wheat crops.However,there is currently no clarity on the responses of soil organic carbon (SOC),total nitrogen (TN),and available nutrients to tillage practices within the growing season.This study evaluated the effects of three tillage practices (NT,no tillage;SS,subsoil tillage;DT,deep tillage) over five years on soil physicochemical properties.Soil samples at harvest stage from the fifth year were analyzed to determine the soil aggregate and aggregate-associated C and N fractions.The results indicated that SS and DT improved grain yield,straw biomass and straw carbon return of wheat compared with NT.In contrast to DT and NT,SS favored SOC and TN concentrations and stocks by increasing the soil organic carbon sequestration rate (SOCSR) and soil nitrogen sequestration rate (TNSR) in the 0-40 cm layer.Higher SOC levels under SS and NT were associated with greater aggregate-associated C fractions,while TN was positively associated with soluble organic nitrogen (SON).Compared with DT,the NT and SS treatments improved soil available nutrients in the 0-20 cm layer.These findings suggest that SS is an excellent practice for increasing soil carbon,nitrogen and nutrient availability in dryland wheat fields in North China.
Keywords: tillage,dryland wheat fields,soil aggregate size,soil nutrients,soil carbon and nitrogen fractions
1.Introduction
Tillage practices such as subsoil or deep tillage during the fallow period are effective methods to improve soil water holding capacity in deep soil layers,thus having positive effects on dryland wheat production in the Loess Plateau of China (Lietal.2018;Sunetal.2018;Xueetal.2018a;Kanetal.2020;Heetal.2021;Yanetal.2023).In addition to soil water conditions,various characteristics,such as soil physical quality (Kasperetal.2009;Topaetal.2021),soil temperature (Heetal.2021),soil carbon(Huetal.2021) and nutrient concentrations (Li and Huangetal.2011;Houetal.2012),may also be affected by tillage practices.The study of how such soil properties respond to tillage contributes to a better understanding of how soil quality responds to tillage.
Soil organic carbon (SOC),as one of the main indicators of soil quality,is associated with nutrient availability.Various studies have focused on soil C sequestration.It has been found that soil disturbance under tillage practices (especially deep tillage) can lead to SOC depletion,aggregate destruction,and soil degradation (Sixetal.2000;Heetal.2021).Other studies in North China have indicated that deep tillage has a positive effect on breaking up compacted subsoil layers,decreasing soil bulk density,reducing soil C sequestration in deep soil layers and increasing crop yield (Tianetal.2016;Zhangetal.2018;Wangetal.2019;Liuetal.2020;Huetal.2021).More information on deep tillage effects in different crop production systems is needed in order to understand the response of SOC to tillage.No tillage and subsoil practices have been found to be beneficial to C retention in the surface soil layer (Zhangetal.2013,2017).
Total nitrogen (TN) and its available fractions are the main limiting factors affecting crop yield and quality,and are influenced by tillage practices.In general,compared with intensive tillage,no tillage can result in increased TN concentrations in topsoil layers and reduced TN concentrations in subsoil layers,similar to SOC(Mazzoncinietal.2016).In southern China,no tillage enhanced the SOC and TN stocks in the 0-10 cm soil layer,while deep tillage increased SOC and TN stocks in the 0-50 cm soil layer in a double paddy cropping system(Xueetal.2015).The TN pool is slow to respond to the impact of management practices due to its large size(Zhangetal.2016).
Soil mineral N (NO3--N and NH4+-N) is an available N pool absorbed by crops.No tillage can improve the availability of N to crops by increasing soil N retention and the labile N pool in the upper soil layers (Sunetal.2015) and increasing nutrient stratification due to less soil disturbance (Tshumaetal.2021).Although many studies have reported that no tillage can increase SOC and TN stocks,the observations are not always consistent due to differences in soil depth,cropping system,intensity of tillage,and climate (Jhaetal.2020).Soil available P and K are also affected by tillage.Soil available P and K levels under subsoil tillage and no tillage are significantly higher than under conventional tillage in winter wheat fields (Guzmanetal.2006;Li and Huangetal.2011).Deep tillage is not conducive to the stratification of soil chemical indices such as extractable P,which leads to a decrease in extractable P stock (Tshumaetal.2021).
Despite some observations from previous studies,there is still a lack of scientific information regarding the effects of different tillage practices on SOC,TN,and available nutrient status.Previous studies have mainly focused on soil chemical properties at the harvest stage of crop growth (Houetal.2012;Xueetal.2018b).Understanding changes in chemical properties within growth period is important for elucidating the effects of the properties on crop production.Heetal.(2021) reported a decrease in SOC under deep tillage during the growth period of winter wheat in the 0-10 cm soil layer,but a slight increase in SOC under subsoil tillage.Currently,however,there is little other information on the response of soil chemical characteristics to tillage practices during the growth stage.Further,studies of soil chemical properties are mostly performed after several years of tillage,but few studies have examined changes in chemical properties soon after tillage is undertaken.Therefore,a five-year study was conducted to assess the effect of tillage practices during the summer fallow season on: (i) changes in soil C,N and other nutrient levels during the growing year before sowing and after harvest;(ii) soil C and N stocks and sequestration rates;and (iii) soil aggregate size distribution and aggregate-associated C and N fractions.
2.Materials and methods
2.1.Experimental site
A five-year tillage experiment was initiated in 2016 at the national experimental station in Yaodu District,Shanxi Province,China (36°19´N,111°49´E,and 481 m a.s.l.).The experimental site had a calcareous cinnamon soil and had a typical arid and semiarid,warm temperate continental climate.During the experiment,the mean monthly air temperature was 12.6°C,with mean daily maximum and minimum temperatures of 32.1 and-0.5°C,respectively.The annual cropping system was winter wheat (October-June) and summer fallow (July-September).The mean annual precipitation over the five experimental years was 522 mm (Table 1),and 65-70%of the precipitation occurred during the fallow period.The soil properties before the experiment in 2016 were: pH 8.67 (1:5 H2O),organic C 11.67 g kg-1,total N 1.19 g kg-1,available N (alkaline hydrolysis method) 65.7 mg kg-1,available P (Olsen-P method) 10.6 mg kg-1,available K(flame photometer method) 117.0 mg kg-1,and soil bulk density 1.28 g cm-3in the 0-20 cm layer,and pH 8.86 (1:5 H2O),organic C 7.23 g kg-1,total N 0.55 g kg-1,available N 48.4 mg kg-1,available P 7.67 mg kg-1,available K88.2 mg kg-1,and soil bulk density 1.61 g cm-3in the 20-40 cm layer.

Table 1 Precipitation (mm) during the five experimental years
2.2.Experimental design and management
Three tillage methods (NT,no tillage;SS,subsoil tillage;DT,deep tillage) were compared in a randomized complete block design with three replications.Each plot was 50 m long and 10 m wide.A 1-m wide strip between plots was used to minimize interference between the plots.A 10-15 cm wheat stubble height was left after the winter wheat was harvested.For the NT treatment,no tillage was performed after harvest until subsequent crop planting.The SS treatment consisted of tillage to a depth of 35-40 cm with a subsoiler,and the DT treatment consisted of tillage to a depth of 30-35 cm using a plowing machine;both treatments were applied in mid-July before the rainy season.Field operations conducted over the five experimental years are shown in Table 2.
Winter wheat (Triticumaestivumcv.Jinmai 92) was sown at a seedling rate of 150 kg ha-1at a row spacing of 20 cm.Across all experimental years,150 kg N ha-1,90 kg P2O5ha-1and 90 kg K2O ha-1were applied as the basal fertilizer for all treatments.No top-dressing of fertilizer or irrigation was applied during the growing seasons.
2.3.Sampling and analysis
Grain yield,straw biomass and straw carbon contentAt maturity,1 m2of plants at three randompoints for each treatment were harvested to determine the grain yield and straw biomass.Straw samples were oven-dried for 30 min at 100°C and then dried for 72 h at 75°C to reach a constant weight.The carbon content of wheat straw (0.5 g) was determined using a potassium dichromate heating method (Nelson and Sommers 1982).The amount of carbon in straw returned to the soil was calculated by multiplying straw biomass by straw carbon content.

Table 2 Field operations performed during the experimental years
SOC,TN and soil nutrient analysisSoils were collected before sowing and after harvest using an auger (Ø=50 mm) from two depths (0-20 and 20-40 cm)with three replicates for each treatment to measure soil chemical properties.Soil samples were air-dried and passed through a 2 mm sieve.SOC was determined using a potassium dichromate heating method (Nelson and Sommers 1982).Soil total nitrogen (TN) was determined using the Kjeldahl digestion method (Lu 2000).
The SOC and TN stocks were computed using the following formulas (Xueetal.2015;Liuetal.2020):
where SOCSand TNSare the SOC and TN stocks of the upper 40 cm of soil (t ha-1);Ciis the SOC concentration(g kg-1);ρiis the soil bulk density (g cm-3);Tiis the soil thickness (cm) in theith soil depth,andNiis the TN concentration (g kg-1).
Soil C and N sequestration rates were determined using the formulae:
where SOCSRand TNSRare the SOC and TN sequestration rates,respectively (t ha-1yr-1);SOCnand TNnare the SOC and TN stocks (t ha-1),respectively,at wheat maturity in thenth year,in whichnis the number of experimental years;SOC0and TN0are the SOC and TN stocks (t ha-1),respectively,at the beginning of the experiment in 2016.
Available N was extracted with 2 mol L-1KCl and then analyzed by the cadmium reduction method (Luetal.2000).Available P was extracted with a 0.5 mol L-1NaHCO3solution,in which pH was adjusted to 8.5(Olsen and Sommers 1982).Available K was extracted with a 1.0 mol L-1CH3COONH4solution,in which pH was adjusted to 7.0 (Luetal.2000).All the measurements were replicated three times.
Soil aggregate and aggregate-associated C and N analysisSamples for soil aggregate fractions were taken after harvest in 2021 and measured according to the method of Elliott (1986).Four soil samples for each plot and depth were collected.Stacked sieves of 0.053,0.25 and 2 mm were used.Soil (150 g) was immersed on top of a 2 mm sieve and shaken on a mechanized shaker.After shaking for 5 min,the sieve was manually moved 60 times up and down,through a distance of 3 cm,over a 2-min period.Water plus soil<2 mm was poured through a 0.25 mm sieve and then a 0.053 mm sieve.The fractions remaining on the 2,0.25,and 0.053 mm sieves were collected.Soil with particles smaller than 0.053 mm(silt+clay fraction) was allowed to settle and centrifuged.Thus,four aggregate size classes were obtained: macroaggregate (>2 mm),small aggregate (0.25-2 mm),micro-aggregate (0.053-0.25 mm),and silt+clay fraction(<0.053 mm).After separation,the aggregate fractions after drying at 40°C were weighed.The percentage of the soil fraction composed of each aggregate size was then calculated as a fraction of the initial soil.The soil aggregate fractions were used to analyze the soil carbon and nitrogen fractions.
The SOC and TN concentrations were determined according to the measurement method given in Section 2.3.The dissolved organic carbon (DOC) concentration was measured using the K2SO4solution extraction method.The particulate organic carbon (POC) concentration was measured using the sodium hexameta phosphate dispersion method (Zhaoetal.2019).The easily oxidized organic carbon (EOC) concentration was measured using the 333 mmol L-1KMnO4oxidation method.Heavy fraction organic carbon (HFOC) concentration was analyzed by the dry combustion method (900°C) using a total organic carbon analyzer (Multi N/C 3100,Analytik Jena,Germany).Light fraction organic carbon (LFOC)concentration was calculated as the difference between SOC and HFOC (Tanetal.2007).Nitrate nitrogen(NO3--N) and ammonium nitrogen (NH4+-N) concentrations were measured using a continuous flow analyzer (Skalar San++,SKALAR,Holland).Soluble organic nitrogen (SON)concentration was measured using K2SO4extraction and analyzed with a total organic carbon analyzer (Multi N/C 3100,Analytik Jena,Germany).
2.4.Statistical analysis
SPSS (v.13.0,SPSS Inc.,Chicago,USA) was used for statistical analysis.The data on soil chemical properties for each year were statistically analyzed by one-way ANOVA with a randomized block design.The differences between treatments were evaluated for their significance using the least significant difference test (LSD) at the 95% confidence level (P<0.05).Non-metric multidimensional scaling (NMDS) coordination with Bray-Curtis distance (permutations=999) was generated to visualize the differences in grain yield,straw biomass,and nutrient concentration in grain among tillage practices across three years.Sigma Plot (v.14.0,Systat Software,Inc.,San Jose,Canada) was used for figure illustrations.
3.Results
3.1.Grain yield,straw biomass and carbon return
The annual grain yield of the SS and DT treatments was 14.3 and 32.2% higher than that of the NT treatment respectively,and straw biomass was 33.3 and 35.5%higher,respectively,than under the NT treatment (Table 3).There was no significant difference between treatments in straw C concentrations.Straw carbon return of the SS and DT treatments was 34.8 and 30.2% higher,respectively,than that of the NT treatment (P<0.05,Table 3).
3.2.SOC,TN and C/N ratio
The SOC concentration showed little change in topsoil under the NT and SS treatments and increased only slightly under the DT treatment over the four years (Fig.1-A).The lowest SOC concentration was mostly found in the DT treatment,although a generally increasing trend was observed by year.Great variations in SOC concentration before sowing and after harvest were present under the SS and DT treatments,compared with the NT treatment.In the 20-40 cm layer,the SOC concentration was mostly lower in the SS and DT treatments in the first and second years,and higher in the fourth and fifth experimental years,than in the NT treatment (Fig.1-B).The SOC content showed greater variance among tillage practices at the harvest stage (Fig.1).
Soil TN concentration at sowing stage under DT treatment was lower than those under SS and NT treatments in the 0-20 cm layer (Fig.1-C).Conversely,the DT treatment promoted a higher soil TN concentration,while the TN concentration always decreased in the NT treatment after harvest (Fig.1-C).In the 20-40 cm layer,a relatively persistent lower TN concentration wasobserved in the NT treatment (Fig.1-D).DT resulted in a high soil TN concentration in the first two experimental years,while SS resulted in a high concentration in later years (Fig.1-D).
In most cases,the NT treatment maintained higher soil C/N ratios in both soil layers than the SS and DT treatments (Fig.1-E and F).The C/N ratio in the 0-20 cm layer was lower in the DT treatment than in the other two treatments,while in the 20-40 cm layer the DT treatment was lower in the first and second years,but not in the fourth and fifth experimental years (Fig.1-F).
3.3.Soil C and N sequestration
During the five experimental years,the SOCSof the NT and SS treatments in the 0-20 cm soil layer showed no significant difference,but both treatments had significantly higher C stocks than that of the DT treatment (Fig.2-A).In the 20-40 cm layer,the SOCSdeclined in the order NT>SS>DT during the first two years,while no significant difference was found among tillage practices during the last three years (Fig.2-A).In general,NT and SS treatments improved SOCSin the 0-40 cm layer (Fig.2-A).The SOCSRunder NT and SS tillage practices was higher in the first and second years and began to decline in later years.The SOCSRunder DT was mostly negative(Fig.2-B).
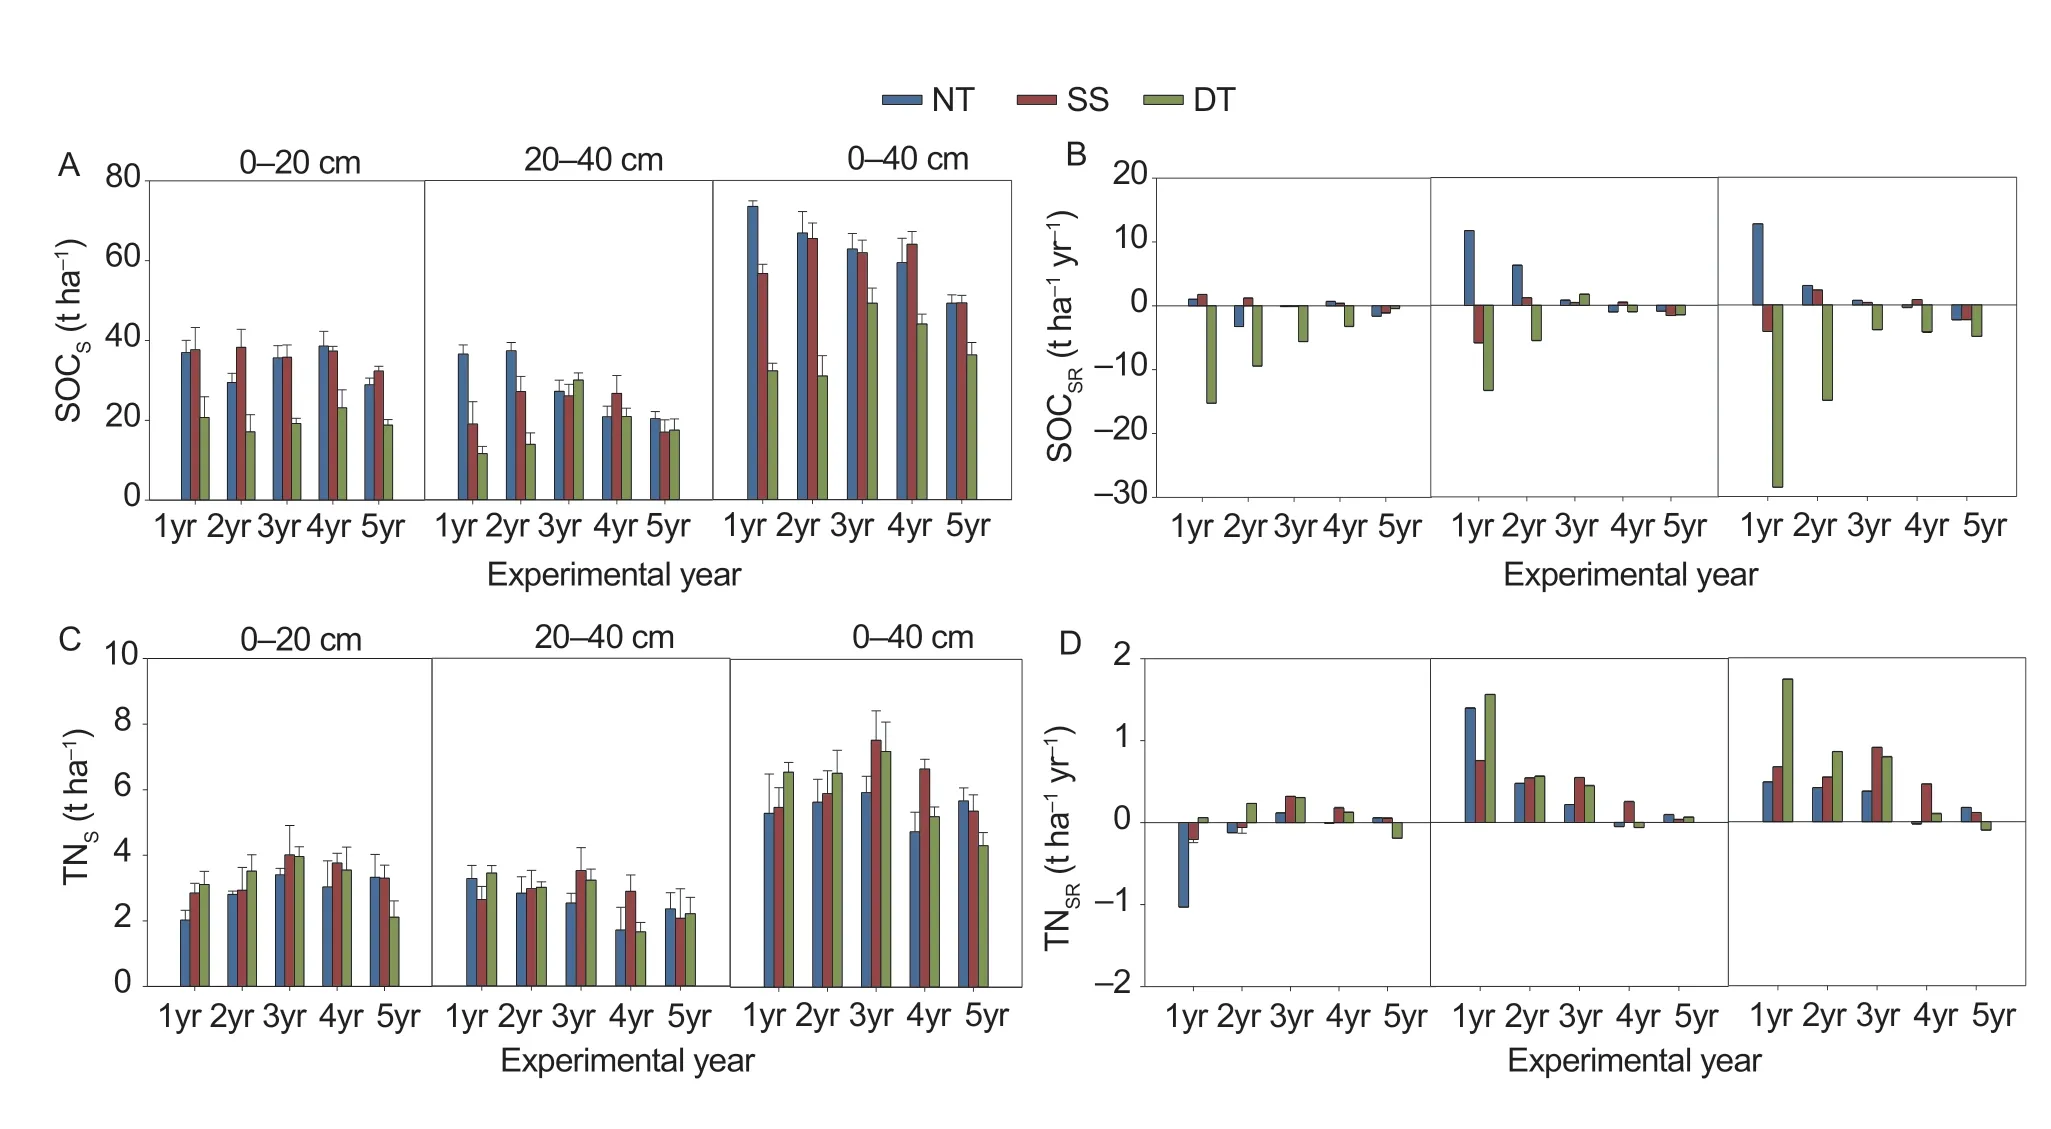
Fig.2 Soil organic carbon stock (SOCS),soil organic carbon sequestration rate (SOCSR),soil total nitrogen stock (TNS) and nitrogen sequestration rate (TNSR) under different tillage practices.1yr,2yr,3yr,4yr and 5yr stand for the first,second,third,fourth and fifth experimental years,respectively;NT,no tillage;SS,subsoil tillage;DT,deep tillage.The initial SOC stock was 35.9 and 24.8 t ha-1 in the 0-20 and 20-40 cm soil depths.The initial TN stock was 3.05 and 1.77 t ha-1 in the 0-20 and 20-40 cm soil depths.Data are mean±SD (n=3).
At the 0-20 cm depth,the soil TNSunder the SS and DT treatments was higher than under the NT treatment during the first four years,while the DT treatment had lower TNSin the fifth year (Fig.2-C).SS and DT improved the TNSin the 20-40 cm layer in the third year compared with the NT treatment.In the 0-40 cm layer,the TNSof the SS and DT treatments was generally higher than under the NT treatment except for the fifth year (Fig.2-C).The TNSRin the 20-40 cm soil layer was higher than that in the 0-20 cm layer (Fig.2-D).
3.4.Soil available N,P and K concentrations
Available N,P and K concentrations in the 0-20 cm layer were mostly higher in the NT treatment than in the SS and DT treatments and frequently lower in the DT treatment(Fig.3-A-C and E).The mean values of available N in the NT,SS and DT treatments were 68.9,64.2 and 47.8 mg kg-1,respectively,while mean values of available P were 12.0,7.6 and 5.8 mg kg-1,respectively,and mean values of available K were 167.3,141.7 and 120.8 mg kg-1,respectively.Available N,P and K concentrations in the 20-40 cm layer showed differences during sowing and harvest stages and were relatively lower in the NT treatment before sowing,while relatively higher in the NT treatment after harvest compared with the SS and DT treatments (Fig.3-B-D and F).The mean values of available N in the NT,SS and DT treatments were 30.7,25.6 and 29.5 mg kg-1,respectively,while mean values of available P were 6.5,4.9 and 5.2 mg kg-1,respectively,and mean values of available K were 107.4,107.8 and 114.5 mg kg-1,respectively.Available P levels exhibited a decreasing trend over the experimental years under all tillage systems (Fig.3-C and D).

Fig.3 Soil available N,P and K concentrations in 0-20 and 20-40 cm soil layers before sowing and after harvest of winter wheat under different tillage treatments.1yr,2yr,3yr,4yr and 5yr stand for the first,second,third,fourth and fifth experimental years,respectively;S,sowing;H,harvest;NT,no tillage;SS,subsoil tillage;DT,deep tillage.Data are mean±SD (n=3).
3.5.Soil aggregate size distribution by depth
Tillage practices affected dry aggregate distribution of large (>2 mm),small (2-0.25 mm),micro (0.25-0.053 mm),and silt+clay (<0.053 mm) aggregate sizes(Fig.4).Soil aggregates after harvest showed that the percentage of aggregates of the 2-0.25 mm size and the <0.053 mm size composed the higher and lower fractions,respectively across all tillage practices.The DT treatment increased the percentage of aggregates sized 0.25-0.053 mm compared with the NT and SS treatments,especially in deep soil layers.A similar percentage of aggregates of 0.25-0.053 size was found in the SS and NT treatments.A higher percentage of aggregates sized 2-0.25 mm was found in the NT and SS treatments compared with the DT treatment in the 20-40 and 40-60 cm layers.Aggregate size responses to tillage practices showed great variance in the >2 mm and <0.053 mm size classes.A higher percentage of>2 mm aggregates was observed in the NT and SS treatments in the 0-20 and 20-40 cm soil layers than in the DT treatment,while the percentage of >2 mm aggregates was reduced in the SS and DT treatments in the 40-60 cm layer compared with the NT treatment.The percent of <0.053 mm aggregates was reduced in the SS and DT treatments in the 0-20 cm layer,and the highest percentage of <0.053 mm aggregates was observed in the SS treatment in the 40-60 cm layer.These results indicated that SS and DT decreased large aggregates and increased micros and silt+clay aggregates by depth.
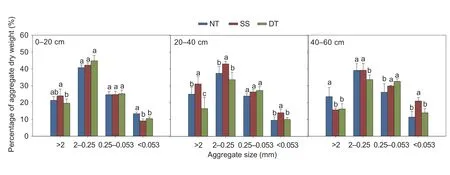
Fig.4 Tillage effects on dry aggregate size fractions (%) by large (>2 mm),small (2-0.25 mm),micro (0.25-0.053 mm),and silt+clay(<0.053 mm) aggregate sizes after tillage application for five years.NT,no tillage;SS,subsoil tillage;DT,deep tillage.The soil was sampled to 0-20,20-40,and 40-60 cm depths in the fifth experimental year.Different letters indicate significant differences(P<0.05) among the treatments by Duncan's multiple range test.Data are mean±SD (n=3).
3.6.Aggregate-associated SOC,TN and C/N by depth
The SOC concentration across all aggregate sizes in the 0-20 cm soil layer generally followed the order of SS>NT>DT (Fig.5).The SOC concentration in the 20-40 cm layer of the DT treatment was higher than that of the NT treatment in the >2 mm aggregate size and lower than that of the NT treatment in the 2-0.25,0.25-0.053 and <0.053 mm aggregate sizes.The SOC concentration in the 20-40 cm layer in the SS treatment was higher than that in the NT treatment in the 0.25-0.053 mm aggregate size and lower than that in the NT treatment in the >2,2-0.25 and <0.053 mm aggregate sizes.The SOC concentration in the 40-60 cm layer in the NT treatment was higher than that in the SS and DT treatments in the 2-0.25,0.25-0.053 and<0.053 mm aggregate sizes.SOC concentration decreased with depth under all tillage practices across all aggregate sizes.
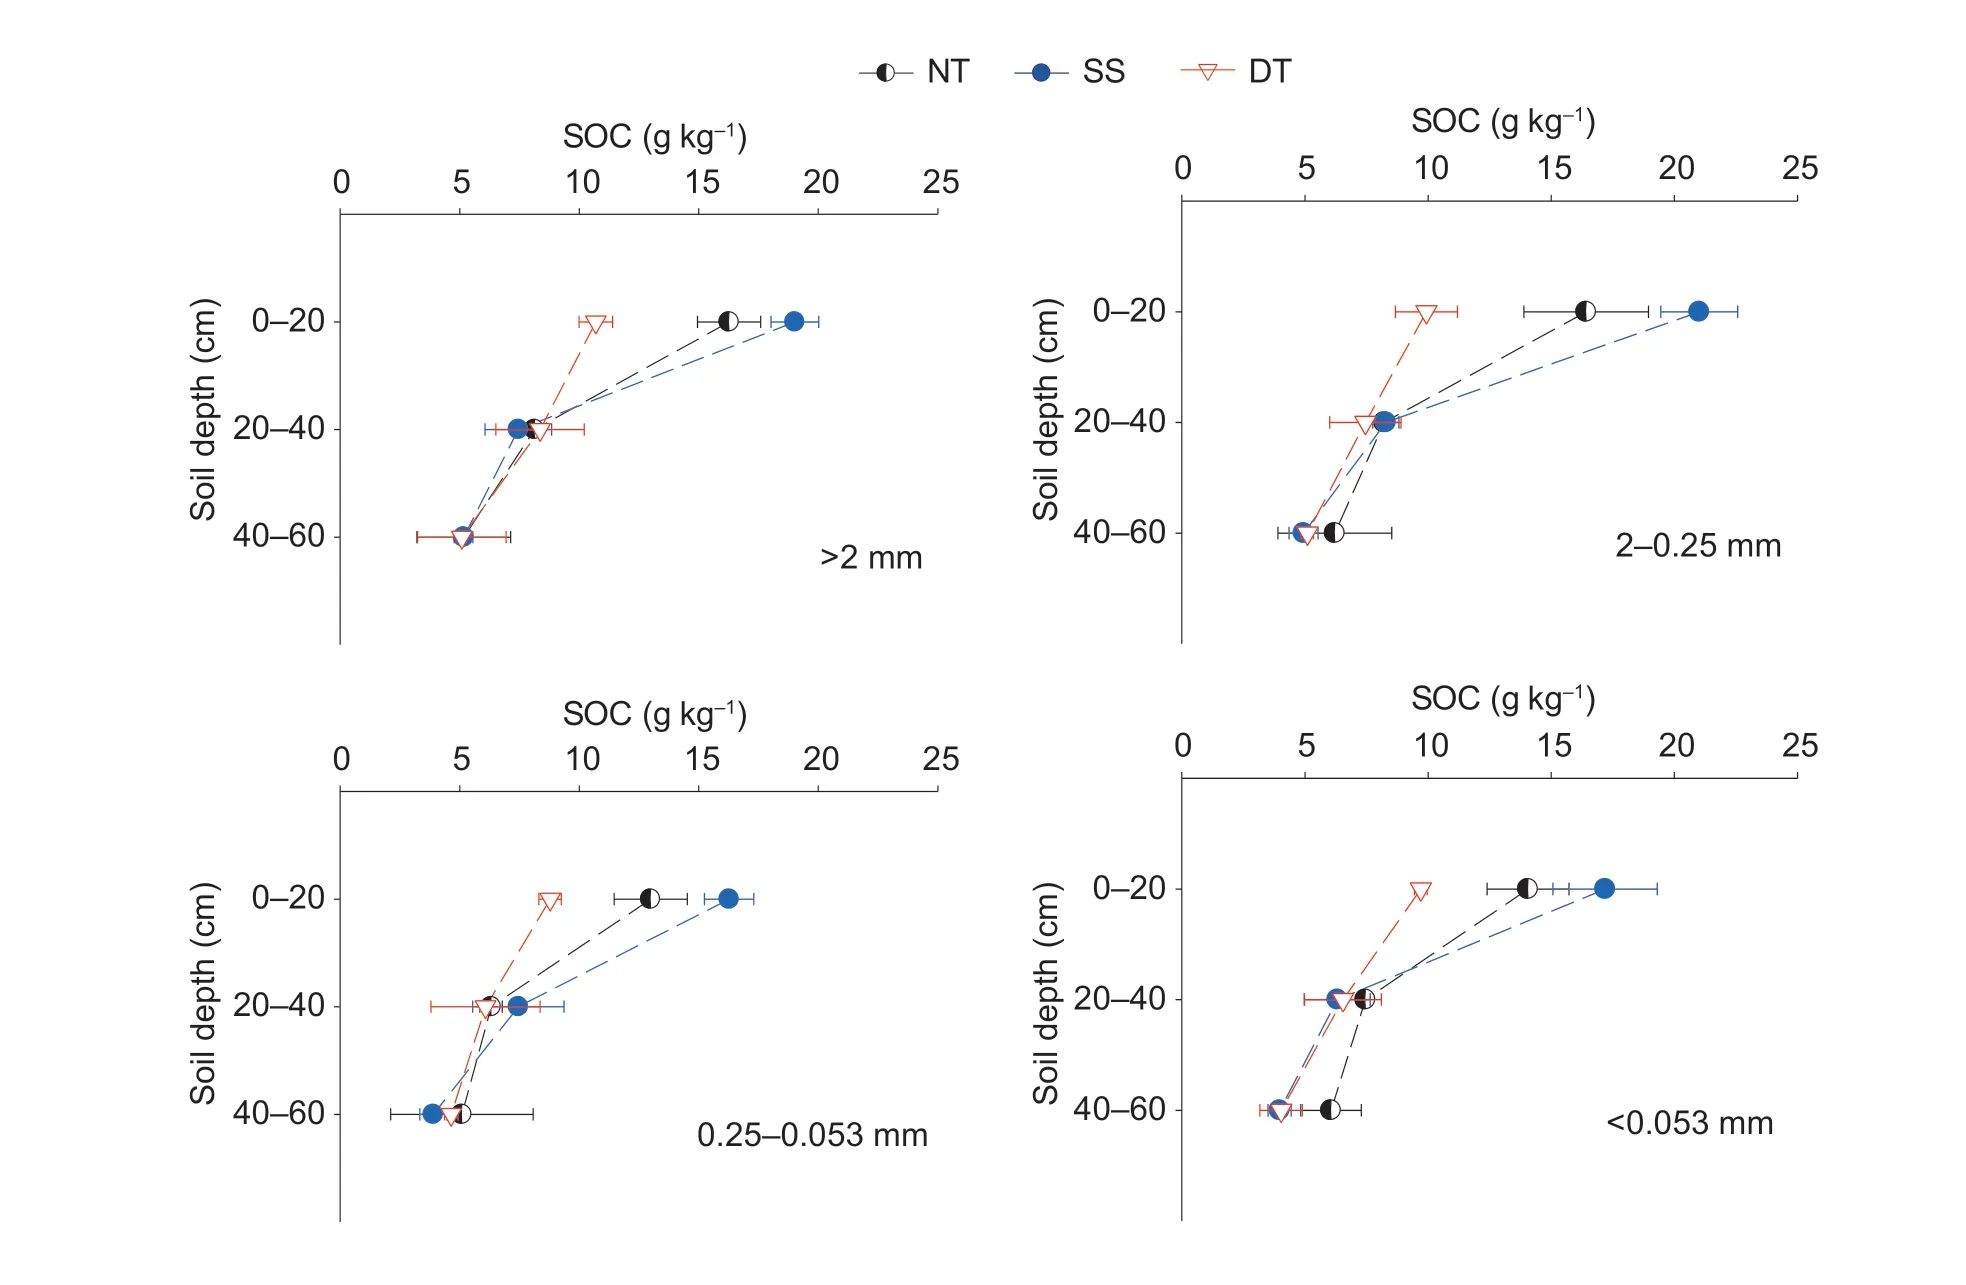
Fig.5 Tillage effects on dry aggregate-associated soil organic carbon (SOC) by large (>2 mm),small (2-0.25 mm),micro (0.25-0.053 mm),and silt+clay (<0.053 mm) aggregate sizes after tillage application for five years.NT,no tillage;SS,subsoil tillage;DT,deep tillage.The soil was sampled to 0-20,20-40,and 40-60 cm depths in the fifth experimental year.Data are mean±SD (n=3).
TN concentration in the 0-20 cm layer was higher in the SS than the NT treatment across all aggregate sizes,while lower soil N concentration was obtained in the DT treatment in the >2 and 2-0.25 mm aggregate sizes,and higher soil N was obtained in the DT treatment in the <0.053 mm aggregate size (Fig.6).The soil N in the 20-40 cm layer under the SS and DT treatments was lower than that under the NT treatment,mostly across all aggregate sizes.The DT treatment improved the soil N level in the 40-60 cm layer in the >2,2-0.25 and 0.25-0.053 mm aggregate sizes.Soil N decreased by depth in the NT treatment across all aggregate sizes.Soil TN concentration was reduced in the 0-20 and 20-40 cm layers in the SS and DT treatments,while soil TN in the 40-60 cm layer was either close to or higher than in the 20-40 cm layer.

Fig.6 Tillage effect on dry aggregate-associated total nitrogen (TN) by large (>2 mm),small (2-0.25 mm),micro (0.25-0.053 mm),and silt+clay (<0.053 mm) aggregate sizes after tillage application for five years.NT,no tillage;SS,subsoil tillage;DT,deep tillage.The soil was sampled to 0-20,20-40,and 40-60 cm depths in the fifth experimental year.Data are mean±SD (n=3).
Soil C/N ratio in the 0-20 cm layer across all aggregate sizes generally followed the order of SS>NT>DT (Fig.7).The NT treatment had a lower C/N ratio in the 20-40 cm layer,across all aggregate sizes,than the SS and DT treatments.Contrary to the 0-20 and 20-40 cm depths,the NT treatment had the highest C/N ratio in aggregate sizes of 2-0.25,0.25-0.053 and <0.053 mm in the 40-60 cm layer.Specifically,the highest C/N ratio in the SS and DT treatments across all aggregate sizes was found in the 20-40 cm soil layer.The highest C/N ratio in the NT treatment across all aggregate sizes was found in the 40-60 cm soil layer.
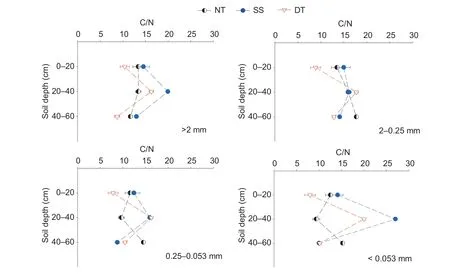
Fig.7 Tillage effect on dry aggregate-associated C/N by large (>2 mm),small (2-0.25 mm),micro (0.25-0.053 mm),and silt+clay(<0.053 mm) aggregate sizes after tillage application for five years.NT,no tillage;SS,subsoil tillage;DT,deep tillage.The soil was sampled to 0-20,20-40,and 40-60 cm depths in the fifth experimental year.Data are mean±SD (n=3).
3.7.Aggregate-associated DOC,EOC,POC,LFOC and HFOC by depth
Among the aggregate-associated soil carbon fractions,there was greater variability in the 0-20 cm layer than in the deep layers (Table 4).The aggregate-associated DOC concentration in the 0-20 cm layer across all aggregate sizes generally followed the order for treatments of NT>SS>DT.The NT treatment had higher DOC in the 20-40 cm layer than the SS and DT treatments in the<0.053 mm aggregate size.The DT treatment had the highest DOC in the <2 mm size in the 20-40 and 40-60 cm layers.The lowest EOC concentration was obtained in the DT treatment in the 0-20 cm layer across all aggregate sizes,but tillage showed no significant effect on EOC in the 20-40 and 40-60 cm layers across all aggregate sizes.The NT treatment had the highest POC concentration in the 40-60 cm layer,while the SS treatment had the highest POC concentration in the 0-20 cm layer and the DT treatment had the highest concentration in the 20-40 cm layer across all aggregate sizes.The lowest LFOC concentration was observed in the DT treatment across all depths and aggregate sizes.Greater HFOC concentrations were obtained in the SS treatment than in the other treatments in the 0-20 cm layer and in the DT treatment in the 20-40 and 40-60 cm layers.These results suggest that NT and SS treatments promoted DOC and EOC in the 0-20 cm layer,while the DT treatment promoted labile SOC fractions (focused on an aggregate size of >2 mm) and HFOC in the 20-40 cm layer.
3.8.Aggregate-associated NO3--N,NH4+-N and SON by depth
Table 5 showed the aggregate-associated NO3--N,NH4+-N and SON by depth.The NT treatment had greater NO3--N concentrations in the 0-20 and 20-40 cm layers than the other treatments,while the DT treatment had greater concentrations in the 40-60 cm layer in aggregates>2,2-0.25,and 0.25-0.053 mm.The lowest NO3--N concentrations were obtained in the SS treatment in the 20-40 cm layer across all aggregate sizes.The DT treatment had greater NH4+-N concentrations than the other treatments in aggregates >2 mm in size at all soil depths.Occasionally,the NH4+-N concentration was similar among the NT and DT treatments,and the lowest NH4+-N concentration was obtained in the SS treatment.The NT and SS tillage practices promoted SON concentrations in the 0-20 cm layer across all aggregate sizes compared with the DT treatment.Furthermore,a greater SON concentration accumulated in the 0-20 cm layer across all aggregate sizes.A great decrease in SON with depth was observed in both SS and DT treatments.
3.9.Relationships among aggregate-associated soil carbon and nitrogen fractions
The relationships between the soil carbon and nitrogen fractions were shown in Table 6.SOC concentration was significantly positively correlated with TN,SON and carbon fractions.TN concentration was significantly positively correlated with SON and carbon fractions.Both SOC and TN had a significant negative correlation with NO3--N and NH4+-N.Soil C/N ratio was negatively associated with TN concentration.Soil carbon fractions were significantly positively correlated with NO3--N concentration,and negatively correlated with NH4+-N concentration.
3.10.Relationships among grain yield,straw biomass and soil properties
NMDS showed that there were significant differences in grain yield and straw biomass associated with different tillage practices over five years (Fig.8).Grain yield was positively associated with straw biomass,straw carbon and TN,while negatively associated with SOC,C/N,AN,AP,and AK.

Fig.8 Grain yield,straw biomass and soil properties among tillage practices over five years as indicated by non-metric multidimensional scaling (NMDS) ordination based on Bray-Curtis distance.SOC,soil organic carbon;TN,soil total nitrogen;C/N,soil organic carbon/soil total nitrogen;AN,soil available N;AP,soil available P;AK,soil available K.NT,no tillage;SS,subsoil tillage;DT,deep tillage.
4.Discussion
4.1.Tillage favors both wheat productivity and straw carbon return
Long-term no tillage reduced germination and emergence of seeds,delayed development of plants and decreasedgrain potential of winter wheat in North China (Tianetal.2016;Liuetal.2020).Compared with consistent no tillage,subsoil tillage and deep tillage stored more water in deeper soil,resulting in improved wheat productivity and straw biomass (Sunetal.2018).The distribution of crop straw in soil and tillage practices spatially determined carbon stock (Liuetal.2023).Affected by soil temperature and moisture content,straw residues showed different degradation rates,and the degradation was accelerated under subsoil tillage and other destructive methods (Heetal.2021).

Table 4 Soil aggregate-associated carbon fractions by large (>2 mm),small (2-0.25 mm),micro (0.25-0.053 mm),and silt+clay (<0.053 mm) aggregate sizes under different tillage practices for three soil depths
4.2.Subsoil tillage favors soil carbon and nitrogen stocks
Analysis of soil samples collected during the five experimental years indicated that conservation tillage practices such as NT and SS showed advantages in terms of SOC concentrations and stocks in the 0-20 cm layer compared with DT,which is consistent with the conclusions from previous studies (Liuetal.2020;Wangetal.2020;Tshumaetal.2021).Variance in SOC concentrations and stocks in the 20-40 cm layer was shown among tillage practices.In the present study,SOCSunder DT was consistently lower than the other tillage treatments,which may be due to the lower SOCSRunder DT.The SOCSRunder DT showed an increasing trend year by year,which may benefit SOCSin future years.In the 0-20 cm layer,the SOC concentration showed an increasing trend by year under DT,and a decreasing trend under SS and NT.Other studies have shown variance effects of tillage on SOC,which may be attributed to varying degrees of soil disturbance and crop residue-derived C input (Shiwakotietal.2019;Heetal.2021;Begumetal.2022).Specifically,SS was found to leave straw on the topsoil,thereby loosening the subsoil,and thus a higher SOC concentration in the 0-10 cm layer (Xueetal.2018a;Heetal.2021).Deep tillage during the fallow period can help bury the straw in the subsoil,increasing carbon input to the deep soil layer,which is conducive to carbon sequestration (Dikgwatlheetal.2014;Wangetal.2015).In other studies,tillage was found to mix subsoil with poor SOC into the topsoil,which reduced the fertility of the topsoil by diluting the SOC (Chenetal.2023;Lvetal.2023).In the present study,although the SOC concentration decreased immediately under deep tillage in the first year,this situation may recover with the increase of straw biomass and yield under deep tillage(Xueetal.2018b;Yanetal.2023).

Table 5 Soil aggregate-associated nitrogen fractions by large(>2 mm),small (2-0.25 mm),micro (0.25-0.053 mm),and silt+clay (<0.053 mm) aggregate sizes under different tillage practices and soil depths
In the present study,the SOC in the topsoil showed different dynamics in response to tillage practices during the growth stages of winter wheat.Compared with the NT treatment,the SOC concentration of the SS treatment decreased at sowing and increased at harvest.Under deep tillage,the SOC concentration was lower than the NT treatment at sowing and performed a continuous decreasing trend until harvest (Fig.1).Under deep tillage in our study,SOC mineralization accelerated.In contrast,Liuetal.(2021) found that SOC mineralization under conservation tillage (SS and NT) was lower than under conventional tillage and rotary tillage.Deep tillage was found to increase the soil oxygen level,and accelerate the decomposition of straw by microorganisms.Therefore,CO2emission was one of the pathways of soil carbon loss(Lietal.2018).
In the present study,the TN concentration under the NT treatment showed a declining trend in both soil layers,and was mostly lower than under the SS and DT treatments.Except for the fifth year,TNSin the 0-20 and 0-40 cm layers under the SS and DT treatments were mostly higher than those under the NT treatment.Obviously,soil TNSwere related to the status of the TNSR.In the fifth year,higher precipitation may have accelerated the migration of N to the deeper soil layer,especially under DT and SS treatments.In general,no tillage favors TNSbuild-up in the 0-20 cm layer,and promotes TNSin deep soil layers (Jhaetal.2020;Liuetal.2020).Less crop residue input under no tillage may result in the lowest TN concentrations in deeper soil layers (Xueetal.2015).
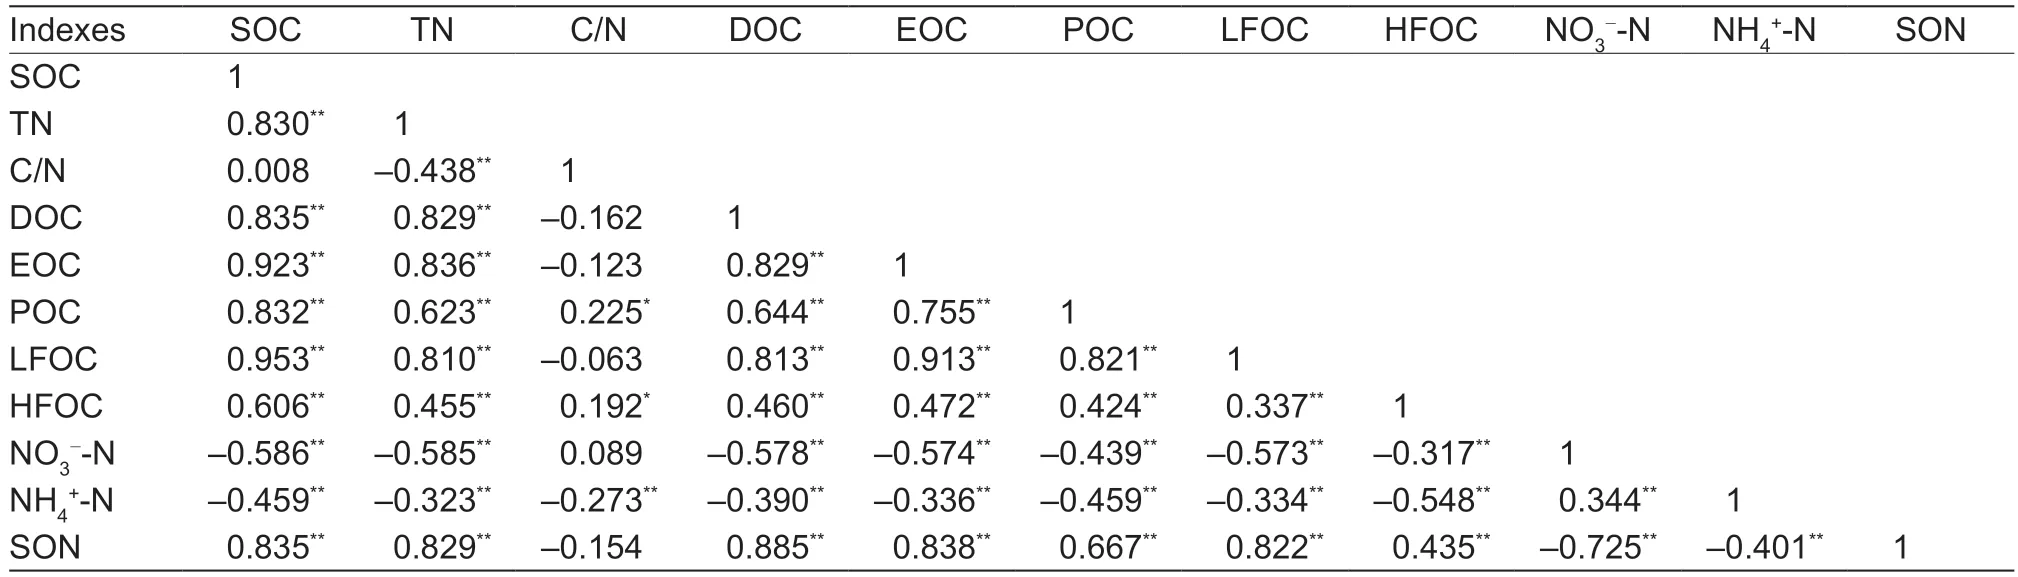
Table 6 Correlations between soil aggregate-associated carbon and nitrogen fractions1)
1)SOC,soil organic carbon;TN,soil total nitrogen;C/N,soil organic carbon/soil total nitrogen;DOC,dissolved organic carbon;EOC,easily oxidized organic carbon;POC,particulate organic carbon;LFOC,light fraction organic carbon;HFOC,heavy fraction organic carbon;NO3--N,nitrate nitrogen;NH4+-N,ammonium nitrogen;SON,soluble organic nitrogen.
The C/N ratio reflects SOC quality and its expected decomposability.In general,a higher C/N ratio limits microbial decomposition,resulting in relatively low SOC quality (Wangetal.2019).A higher C/N ratio indicates a higher degree of organic nitrogen immobilization,resulting in lower nitrogen uptake by crops (Liuetal.2020).Additionally,low C/N ratios under deep tillage and subsoil tillage soil were due to the leaching of nitrogen from surface soil,which was supported by the study of Xueetal.(2015).
4.3.Subsoil tillage favors soil aggregate-associated carbon and nitrogen
Tillage practices can affect soil aggregation and the distribution of C and N in aggregate fractions (Kasperetal.2009).When aggregate structure was disrupted by tillage,Oorts (2006) found that the mineralization rates of carbon and nitrogen increased greatly.Soil organic carbon can promote soil aggregation and aggregate stability in micro-aggregates and macro-aggregates,thereby improving soil physical stability (Mikhaetal.2015;Zhengetal.2021).According to the study of Xueetal.(2018b),NT and SS resulted in the formation of artificial macro-aggregates.Less soil disturbance protected C accumulation due to the formation of microaggregates and macro-aggregates (Weidhuneretal.2021).Larger aggregates and higher SOC reduced the strength of aggregates exposed to water (Topaetal.2021).Additionally,the present study found that soil carbon fractions in aggregates were significantly positively correlated with SOC,suggesting that NT is a more stable soil management practice than other tillage practices that can maintain or increase aggregate-associated C,N and its fractions (Weidhuneretal.2021).In subsoil tillage,residues are incorporated to manage the labile SOC pool in the 0-50 cm layer (Xueetal.2018a).Similar to C,aggregate-associated N in the upper soil layer was improved under NT and SS treatments in the present study.However,aggregate-associated N in the 40-60 cm soil layer in the DT treatment was evident,and it is possible that more N was protected at deeper depths.
4.4.NT and SS treatments resulted in accumulation of soil available nutrients
Soil available nutrient status was strongly influenced by tillage practices across years,soil depth and growth period (Fig.3).Our study found that soil available nutrients increased with the decrease of tillage in topsoil,which may be due to the reduced disturbance of the surface soil.Other studies have found that reducing soil disturbance can improve nutrient availability.For example,reducing disturbance was found to reduce the leaching of nutrients from the surface soil layer to deeper soil layers (Zhangetal.2018).Further,use of tillage practices was found to incorporate crop residue into the soil and redistribute nutrients to deeper soil layers(Obouretal.2017),and to promote the mineralization of organic nitrogen in the deeper soil layer in wheat fields(Li and Huangetal.2011).Lvetal.(2023) found that DT induced soil inversion and nutrient re-distribution and prevented stratification of most soil chemical parameters.Earlier,Wangetal.(2015) had found that tillage increased the diffusion path of moisture,and promoted the leaching and redistribution of soil nitrate nitrogen in dryland wheat fields in northern China.
In addition to available N,available P and K also accumulate in topsoil under no tillage,as reported in other studies (Dick 1983;Sarkeretal.2018;Pengetal.2020).Especially in dry soils,immobile nutrients such as P may accumulate in topsoil layers and might be absorbed by soil particles (Guzmanetal.2006).According to the study of Tshumaetal.(2021),soil inversion could significantly reduce extractable P stocks by disrupting soil aggregates.Other factors,such as low soil organic matter content,may also negatively affect the availability and distribution of extractable phosphorus (Vogeleretal.2009).Soils under the NT system remain largely intact and therefore provide greater physical protection to the entrapped C and improve the availability of nutrients (Sixetal.2000).
4.5.Tillage influences availability of soil P
Nutrients accumulate most in the upper soil layer,and transfer less to deeper layers,and tend to stratify more under no tillage than where tillage is practiced.It should be noted that the uptake of nutrients by crops may be limited when nutrients are stratified (Tshumaetal.2021).In situations where the topsoil dries out,nutrient stratification can become a problem.Additionally,immobile nutrients such as phosphorus may be absorbed by soil particles reducing their availability to crops under no tillage (Shenetal.2011).Consistent with this,in our study higher available phosphorus under NT treatment showed a close negative relationship with the growth indexes (Fig.8).Therefore,crop growth and productivity may be severely reduced under NT.Otherwise,subsoil and deep tillage will increase the available nitrogen and phosphorus content in deeper layers and root absorption of these nutrients,as found in wheat by Wangetal.(2015).
5.Conclusion
A five-year experiment was undertaken to study the effects of three tillage practices during the fallow period on soil properties in dryland wheat fields in northern China.We concluded that NT and SS practices could be beneficial to SOC concentrations and stocks in the 0-40 cm soil layer when compared to DT,due to the high SOCSRin the NT and SS treatments.The soil TN concentrations and stocks under SS improved greatly when compared to the NT treatment due to greater SON increment in the SS treatment.In general,soil available nutrient levels were higher under the NT and SS treatments than with the DT treatment.In conclusion,subsoil tillage may be a viable long-term tillage practice to improve SOC,TN and available nutrients in the 0-40 cm soil layer,as well as dryland wheat productivity (Fig.9).The influence of tillage practices on SOC and soil nutrients during the growth period requires further research.
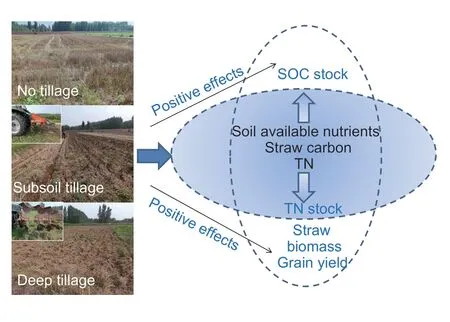
Fig.9 Conceptual graph of tillage practices (no tillage,subsoil tillage and deep tillage) effect on interaction process of plant growth and soil chemical properties.SOC,soil organic carbon;TN,total nitrogen.
Acknowledgements
This work was financially supported by the Joint Funds of the National Natural Science Foundation of China (U22A20609),the National Key Research and Development Program of China (2021YFD1901102-4),the State Key Laboratory of Integrative Sustainable Dryland Agriculture (in preparation),the Shanxi Agricultural University,China (202003-3) and the Open Fund from the State Key Laboratory of Soil Environment and Nutrient Resources of Shanxi Province,China (2020002).
Declaration of competing interest
The authors declare that they have no conflict of interest.
杂志排行
Journal of Integrative Agriculture的其它文章
- Advances in DNA methylation and its role in cytoplasmic male sterility in higher plants
- Assessment of molecular markers and marker-assisted selection for drought tolerance in barley (Hordeum vulgare L.)
- 3D genome organization and its study in livestock breeding
- SUPER WOMAN 2 (SPW2) maintains organ identity in spikelets by inhibiting the expression of floral homeotic genes OsMADS3,OsMADS58,OsMADS13,and DROOPING LEAF
- Genetic dissection and validation of a major QTL for grain weight on chromosome 3B in bread wheat (Triticum aestivum L.)
- Coupling of reduced inorganic fertilizer with plant-based organic fertilizer as a promising fertilizer management strategy for colored rice in tropical regions