Genetic dissection and validation of a major QTL for grain weight on chromosome 3B in bread wheat (Triticum aestivum L.)
2024-01-17SiminLiaoZhibinXuXiaoliFanQiangZhouXiaofengLiuChengJiangLiangenChenDianLinBoFengTaoWang
Simin Liao ,Zhibin Xu ,Xiaoli Fan ,Qiang Zhou ,Xiaofeng Liu ,Cheng Jiang,Liangen Chen,Dian Lin,Bo Feng#,Tao Wang
1 Chengdu Institute of Biology,Chinese Academy of Sciences,Chengdu 610041,China
2 University of Chinese Academy of Sciences,Beijing 100049,China
3 The Innovative Academy of Seed Design,Chinese Academy of Sciences,Beijing 100101,China
Abstract Grain weight is one of the key components of wheat (Triticum aestivum L.) yield.Genetic manipulation of grain weight is an efficient approach for improving yield potential in breeding programs.A recombinant inbred line (RIL) population derived from a cross between W7268 and Chuanyu 12 (CY12) was employed to detect quantitative trait loci (QTLs)for thousand-grain weight (TGW),grain length (GL),grain width (GW),and the ratio of grain length to width (GLW) in six environments.Seven major QTLs,QGl.cib-2D,QGw.cib-2D,QGw.cib-3B,QGw.cib-4B.1,QGlw.cib-2D.1,QTgw.cib-2D.1 and QTgw.cib-3B.1,were consistently identified in at least four environments and the best linear unbiased estimation (BLUE) datasets,and they explained 2.61 to 34.85% of the phenotypic variance.Significant interactions were detected between the two major TGW QTLs and three major GW loci.In addition,QTgw.cib-3B.1 and QGw.cib-3B were co-located,and the improved TGW at this locus was contributed by GW.Unlike other loci,QTgw.cib-3B.1/QGw.cib-3B had no effect on grain number per spike (GNS).They were further validated in advanced lines using Kompetitive Allele Specific PCR (KASP) markers,and a comparison analysis indicated that QTgw.cib-3B.1/QGw.cib-3B is likely a novel locus.Six haplotypes were identified in the region of this QTL and their distribution frequencies varied between the landraces and cultivars.According to gene annotation,spatial expression patterns,ortholog analysis and sequence variation,the candidate gene of QTgw.cib-3B.1/QGw.cib-3B was predicted.Collectively,the major QTLs and KASP markers reported here provide valuable information for elucidating the genetic architecture of grain weight and for molecular marker-assisted breeding in grain yield improvement.
Keywords: thousand-grain weight,QTL mapping,haplotype analysis,candidate gene
1.Introduction
Wheat (TriticumaestivumL.) is a global crop of major economic value and nutritional importance,as it provides 20% of the calories and protein consumed by the world’s population (FAO 2015).Although the wheat grain yield has continued to increase during the last 50 years,the current rate of increase cannot meet the food demands of the growing population (Rayetal.2013).Therefore,the genetic basis underlying gain yield should be accelerated.Grain yield is a multifaced trait that can be partitioned into three major components: thousand-grain weight (TGW),grain number per spike (GNS) and spike number per unit area.TGW is a relatively stable quantitative trait that is determined mainly by grain size,which is estimated by grain length (GL),grain width (GW),the ratio of grain length to grain width (GLW),and other parameters(Dholakiaetal.2003;Simmondsetal.2014).Thus,the identification and validation of genetic loci controlling grain weight plays a significant role in elucidating the genetic basis of grain yield.
Many genes involved in determining grain weight in rice have been reported,and they are associated with several signaling pathways (Lietal.2019),including the ubiquitinproteasome pathway,signaling mediated by G protein/protein kinase,plant phytohormone signal transduction and some transcription regulators (Ashikarietal.1999,2005;Fujisawaetal.1999;Tanabeetal.2005;Songetal.2007;Zhangetal.2012).For example,GS3encodes a putative G protein γ subunit that negatively regulates grain size by GL (Maoetal.2010).GS5is a serine carboxypeptidase that positively improves GW by increasing cell proliferation and cell expansion (Lietal.2011).GW5is a calmodulin binding protein that negatively controls GW and TGW by regulating cell proliferation (Liu Jetal.2017).TGW6encodes an indole-3-acetic acid (IAA)-glucose hydrolase that increases GL and TGW by regulating endosperm development (Ishimaruetal.2013).
Thus far,several genes controlling grain weight in wheat have been cloned through homologous gene cloning and map-based cloning (Caoetal.2020),such asTaGS5(Maetal.2016),Tasg-D1/S1(Guptaetal.2021),GNI(Sakumaetal.2019),TaGW2(Zhangetal.2018),GW7(Wang Wetal.2019),KAT(Chenetal.2020),TaPIN1(Yaoetal.2021),andTaERF3(Jiaetal.2021).For instance,TaGW2is a RING-type E3 ubiquitin ligase that improves TGW by regulating the expression of cytokinins (Gengetal.2017).TaCYP78A5encodes a cytochrome P450 monooxygenase that has been cloned,and regulating its expression level using auxin can increase grain weight in wheat (Guoetal.2022).In addition to plant height and flowering dates,specificRht-B1andTaFT-D1alleles also affect grain weight (Xuetal.2017;Lietal.2018;Yangetal.2021).
Quantitative trait loci (QTLs) mapping,the first step in map-based gene cloning,provides an effective approach for depicting the genetic basis of complex quantitative traits like grain weight.With the development of highdensity SNP genotyping assays,such as the wheat 90 K(Wangetal.2014),660 K (Sunetal.2020) and 55 K SNP arrays (Winfieldetal.2016),numerous QTLs associated with grain weight have been identified by two parents derived genetic populations and natural populations(Börneretal.2002;Huangetal.2006;Cuietal.2013,2014;Liuetal.2014,2020,2022;Simmondsetal.2014;Wangetal.2014;Gaoetal.2015;Kumaretal.2016;Bhusaletal.2017;Liu Yetal.2017;Xuetal.2017;Guanetal.2018;Lietal.2018,2022;Sukumaranetal.2018;Wang Xetal.2019;Huetal.2020;Xinetal.2020;Ishametal.2021;Quetal.2021,2022;Jietal.2022).Although numerous studies have identified QTLs affecting grain weight,few have been validated in different genetic backgrounds,thereby limiting their utilization in wheat breeding programs.
In this study,we developed a recombinant inbred line(RIL) population derived from the cross of W7268 (a highyield line) and Chuanyu 12 (CY12,an elite cultivar),and constructed a high-density genetic map using the wheat 55K SNP array.The aims of this study were to: (i) assess the phenotypic variations of grain weight across multiple environments;(ii) identify QTLs controlling grain weight,and evaluate their effects and interactions;(iii) validate the major QTLs in a different population;and (iv) conduct haplotype analysis and candidate gene(s) prediction for the major QTLs.
2.Materials and methods
2.1.Plant materials and field experiments
Two genetic populations generated by the single-seed descent method between W7268 and two cultivars were employed in this study.The two populations were: (i)W7268/CY12 or WC12,a RIL population containing 180 F9lines;and (ii) W7268/Chuanmai 107 (CM107) or WC107,comprised of 51 stable advanced lines.A natural population composed of 142 wheat accessions collected by our lab was used for haplotype analysis.
W7268 is an elite line generated by the cross of durum wheat line 779/Chuanyu 8124 with desirable agronomic traits,including high TGW and multiple florets.It has been widely used in the wheat breeding program in Sichuan Province,China.CY12 (Chuanyu 8/83-4516)and CM107 are two commercial cultivars with lower grain weight.They have different genetic backgrounds,and were used for QTLs mapping and validation,respectively.
The parents and RILs were evaluated at two sites in Sichuan Province across three growing seasons:2018-2019 in Shuangliu (30°34´N,103°52´E) (E1);2018-2019 in Shifang (31°6´N,104°11´E) (E2);2019-2020 in Shuangliu (E3);2019-2020 in Shifang (E4);2020-2021 in Shuangliu (E5);and 2020-2021 in Shifang (E6).The advanced lines were assessed in Shuangliu 2020-2021(E7) and Shifang 2020-2021 (E8).The natural population was planted in Shuangliu 2017-2018 and Shifang 2017-2018.Field trials were organized in a complete randomized design with plants as experimental units.Each line was planted in a one-row plot with a row length of 1.2 m,a row spacing of 0.2 m,and 12 seeds per row.Two replications were employed in this study.Fertilizer application and field management regimes for each site followed local standard practices.
2.2.Phenotypic evaluation and statistical analysis
At harvest time,eight plants were randomly collected to analyze the yield-related traits.Plant height (PHT) was calculated as the distance from the edge of the separation of the stem from the root to the tip of the spike.The fertile tiller number (FTN) was the number of fertile branches.Spike length (SL),spike compactness (SC),spikelet number per spike (SNS),grain number per spikelet(GNSL) and GNS were assessed as the mean of the main spikes of the independent plants collected for each line.GNS was counted after the main spikes were manually threshed.SC was calculated as SNS/SL.TGW,GL,GW,and GLW were evaluated using the software SC-G(WSeen,Hangzhou,China).
Basic statistical analyses,frequency distributions and correlation coefficients were performed using the software SPSS 25 (IBM SPSS,Chicago,USA).The best linear unbiased estimation (BLUE),combined QTL detection and effect analyses were performed using QTL IciMapping v4.2 (https://www.isbreeding.net),and treated as additional environments.According to the method described by Smithetal.(1998),the broad heritability(H2) was estimated for each trait across environments.Lines carrying different alleles at the major QTLs from the WC12 population were screened based on the genotypes of their flanking markers using Student’st-test (P<0.05).
2.3.QTL analysis
We previously constructed a whole genome genetic map of the WC12 population using the Wheat 55K SNP array (Liaoetal.2022).The high-density genetic map consisted of 1,598 bin markers,with an average marker density of 1.48 cM/marker,which covered all 21 chromosomes of the wheat genome.Map lengths and locus numbers were unequally distributed among the three sub-genomes,with lengths of 741.89,678.17,and 943.48 cM and 428,703,and 467 loci for the A,B,and D genomes,respectively.JoinMap v4.1 (https://www.kyazma.nl/index.php/JoinMap/) was used to add the newly developed markers into the genetic map.In JoinMap 4.1,the Kosambi mapping function was used to put the markers in order with the parameters being set as LOD≥5 and round=3.As a result,the molecular markers ofPpd-D1(Bealesetal.2007) andRht-B1(Ellisetal.2002) were integrated into the genetic map.
Based on the individual and BLUE datasets of grain weight,the QTL analysis was conducted in the biparental population (BIP) by the inclusive composite interval mapping (ICIM) method in IciMapping v4.2.To investigate the QTL×environment (QE) interaction effects,data from the multi-environment trials were analyzed using IciMapping v4.2 with pre-adjusted parameters of times=1,000 and type error=0.05.The QTLs with more than 10% of the explained phenotypic variation in at least one environment and consistently identified in four or more environments were considered as major QTLs.The QTLs with overlapping confidence intervals were considered to be identical.They were named according to the International Rules of Genetic Nomenclature (http://wheat.pw.usda.gov/ggpages/wgc/98/Intro.htm),and ‘Cib’represents Chengdu Institute of Biology.
2.4.Conditional QTL analysis
Conditional QTL analysis is an efficient method for revealing the genetic relationships among different traits at the level of a single QTL (Zhangetal.2016).As GL,GW,and GLW are the crucial components of TGW,conditional QTL analysis was performed to reveal the contributions of GL,GW and GLW to TGW.The conditional phenotypic valuesy(TGW|GL),y(TGW|GW) andy(TGW|GLW) were evaluated using QGAStation 1.0 software (http://ibi.zju.edu.cn/software/qga/) according to Zhu’s description (Zhu 1995).
2.5.Development of markers and genotyping
To develop new molecular markers within the mapped interval performed by the Wheat 55K SNP array,SNPs between W7268 and CY12 in the target region were collected based on the whole genome re-sequencing data conducted by Bioacme Biotechnology Co.,Ltd.(Wuhan,China,http://www.whbioacme.com).These SNPs were converted into Kompetitive Allele Specific PCR (KASP)markers,and then integrated into the former genetic map to construct a density genetic map for linkage analysis.KASP primers were designed using the online websites Galaxy (https://galaxy.triticeaetoolbox.org/) and Triticeae Multi-omics Center (http://202.194.139.32/).The KASP assay and data analysis were performed following the method described by Jietal.(2022).The primers used in this study are listed in Appendix A.
2.6.Major QTLs validation in a different background
The effect of a major QTL on its corresponding trait was validated using tightly linked KASP markers in a wheat panel of 51 advanced lines derived from W7268/Chuanmai 107.Based on the marker profiles,these lines were grouped into two classes: lines with homozygous alleles from W7268 and lines with homozygous alleles from the other parent.Differences in TGW and GW between these two groups were analyzed with Student’st-test (P<0.05) in SPSS 25.
2.7.Haplotype analysis and prediction of candidate gene(s)
To further explore the alleles preserved in the key region of the major QTLs during the artificial selection,haplotypes of 142 wheat accessions (75 landraces and 67 modern cultivars) were analyzed in the interval ofQTgw.cib-3B.1/QGw.cib-3B.1using the 145 landmark cultivar re-sequencing data (Haoetal.2020) (http://wheat.cau.edu.cn/Wheat_SnpHub_Portal/).
The physical positions of major QTLs were obtained by aligning the sequences of flanking markers with the wheat reference genome assembly constructed in thecv.Chinese Spring sequence (IWGSC RefSeq v1.0) (IWGSCetal.2018) with a BLAST search (https://urgi.versailles.inra.fr/blast_iwgsc/?dbgroup=wheat_iwgsc_refseq_v1_chromosomes&program=blastn).Then,the genes within the physical regions were extracted using Interval Tools of the Wheat Omics and their annotated functional descriptions were retrieved from UniProt (https://www.uniprot.org/).The expression data for each gene in different tissues (roots,leaves/shoots,spikes,and grain)were retrieved from Wheat Expression Browser (http://www.wheat-expression.com/),and the expression pattern analysis of these genes was performed and presented in the HeatMap drawn by Origin 2022b (https://www.originlab.com).Orthologs of the putative genes in rice(Oryzasativa) andArabidopsisthalianawere retrieved from Wheat Omics (http://202.194.139.32/homologtools/index.html).Moreover,based on the whole genome resequencing data,SNPs and indels of these genes in the target region were obtained and analyzed.
3.Results
3.1.Phenotypic analysis
The phenotypic means and ranges of the four investigated traits are shown in Table 1.Significant differences in GL (P<0.01) and GLW (P<0.01) were detected between W7268 and CY12.W7268 had longer grain length and higher ratio of GLW values than CY12.In the WC12 population,wide and significant variations were observed in all measured traits (Fig.1;Table 1),with GL ranging from 4.73 to 6.62 mm,GW from 2.11 to 3.26 mm,GLW from 1.69 to 2.62,and TGW from 18.01 to 58.46 g.From the perspective of skewness,kurtosis,and the pattern of continuous distribution for these traits,they all (except for GLW) showed normal distributions and bidirectional transgressive segregation appearances in the different environments,suggesting they were typical quantitative traits determined by multiple genes (Fig.2).The GL,GW,GLW,and TGW traits showed highH2at 0.98,0.91,0.93 and 0.92,respectively,indicating that they were mainly controlled by genetic factors in the WC12 population(Table 1).
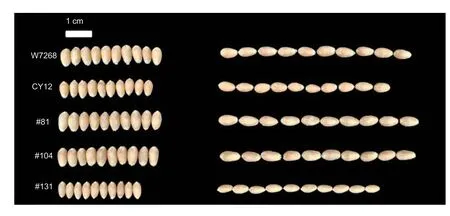
Fig.1 Grain phenotypes of W7268,CY12,and three representative lines from the WC12 lines.
Pearson’s correlation coefficients among the four traits were analyzed in six environments and the BLUE datasets (Appendix B).The results showed significant and positive correlations (P<0.001) of TGW with GL(r=0.61) and TGW with GW (r=0.95),and a significant and negative correlation (P<0.001) between TGW and GLW(r=-0.38) based on the BLUE datasets.In addition,we found a significant and positive correlation (P<0.001) of GL with GW (r=0.41).Phenotypic correlations between TGW and other yield-related traits are listed in Appendix C.TGW was positively correlated with PHT,but negatively correlated with SNS,SC,GNSL,and GNS.In addition,no significant correlations were observed among TGW,FTN and SL.
3.2.QTL identification
A total of 80 QTLs were detected for GL,GW,GLW,and TGW in the WC12 population (Appendices D and E).Twenty-five QTLs,located on chromosomes 1B,2A,2D,3B,4B,5A,5B and 7D,were stably detected in two or more environments and explained 1.85-34.85%of the phenotypic variance (Appendix E).Seven major QTLs were stably detected in four or more environments(including the BLUE dataset) (Appendices F and G;Table 2).
For GL,eight stable QTLs were detected.Among them,the major QTLQGl.cib-2Dwas identified in all environments and explained 16.51-26.04% of the phenotypic variance with LOD values ranging from 12.43 to 20.7% (Fig.3-C;Table 2).The positive allele of this locus was contributed by W7268 (Table 2).QGl.cib-1B.1,a minor QTL,was identified in three environments(including the BLUE dataset) and explained 5.81-6.36%of the phenotypic variance.Its positive allele was fromW7268.The other six QTLs were all detected in two environments (Appendix E).

Fig.3 Genetic map of the major QTLs,QTgw.cib-3B.1 (A),QGw.cib-3B (A),QGw.cib-4B.1(B),QTgw.cib-2D.1 (C),QGlw.cib-2D.1 (C),QGw.cib-2D (C) and QGl.cib-2D (C),and their effects on the corresponding traits in the WC12 lines.Rht-B1 (B),Ppd-D1 (C) and the developed 22 KASP markers for QTgw.cib-3B.1 and QGw.cib-3B (A) were integrated into the genetic map.W7268 and CY12 indicate the lines with the alleles from W7268 and CY12,respectively.E1,E3,and E5,2018-2019,2019-2020,and 2020-2021 in Shuangliu,Sichuan Province,China,respectively;E2,E4,and E6,2018-2019,2019-2020,and 2020-2021 in Shifang,Sichuan Province,China,respectively;BLUE,best linear unbiased estimation.*,** and *** represent significances at P<0.05,P<0.01 and P<0.001,respectively.

Table 1 Phenotypic variation and heritability (H2) of grain length (GL),grain width (GW),the ratio of grain length to grain width(GLW) and thousand-grain weight (TGW) for the parents and the WC12 lines in different environments1)

Table 2 Major quantitative trait loci (QTL) for grain length (GL),grain width (GW),the ratio of grain length to grain width (GLW)and thousand-grain weight (TGW) detected in the WC12 lines1)
Five stable QTLs for GW were identified on chromosomes 2A,3B,4B,and 2D.Three major QTLs,QGw.cib-3B,QGw.cib-4B.1,andQGw.cib-2D,were detected in five or more environments.QGw.cib-3Bwas detected in five environments (E2,E3,E4,E5,and the BLUE dataset) and explained 3.45-21.74% of the phenotypic variance.QGw.cib-4B.1was detected in five environments (E1,E2,E3,E5,and the BLUE dataset)with LOD values ranging from 4.62 to 24.70%,and it explained 2.61-22.98% of the phenotypic variance.QGw.cib-2Dwas identified in six environments (E1,E2,E3,E4,E6,and the BLUE dataset),and explained 6.07-34.85% of the phenotypic variance (Fig.3;Table 2).Positive alleles for GW were contributed by CY12 forQGw.cib-2DandQGw.cib-4B.1,and by W7268 forQGw.cib-3B.The other two stable loci were detected in three environments and showed minor effects (Appendix E).
For GLW,four stable QTLs were identified.Among them,the major QTLQGlw.cib-2D.1was detected in four environments (E1,E4,E6 and the BLUE dataset) and explained 6.06-20.22% of the phenotypic variance (Fig.3-C;Table 2).The positive allele ofQGlw.cib-2D.1was contributed by CY12.Three minor QTLs,QGlw.cib-5A,QGlw.cib-4B,andQGlw.cib-2D.2,were detected in three or more environments,and they explained 5.35-6.27%,5.37-9.63% and 4.72-8.97% of the phenotypic variance,respectively.Except forQGlw.cib-5A,positive alleles for all remaining GLW QTLs were contributed by W7268(Appendix E).
Eight stable QTLs for TGW,two major and six minor,were detected on chromosomes 2A,5A,3B,4B,and 2D.QTgw.cib-3B.1was detected in five environments (E2,E3,E4,E5,and the BLUE dataset),and explained 4.26-25.27% of the phenotypic variance.QTgw.cib-2D.1was detected in six environments (E1,E2,E3,E4,E6,and the BLUE dataset),and explained 2.68-28.89% of the phenotypic variance (Fig.3;Table 2).The positive alleles ofQTgw.cib-3B.1andQTgw.cib-2D.1were contributed by W7268 and CY12,respectively.Three minor QTLs,QTgw.cib-2A.1,QTgw.cib-2A.2,andQTgw.cib-2D.2,were identified in three environments,and explained 4.05-8.50%,1.85-6.07%,and 3.92-7.25% of the phenotypic variance,respectively.Another three minor QTLs,QTgw.cib-3B.2,QTgw.cib-4B,andQTgw.cib-5A,were detected in two environments.Except forQTgw.cib-5AandQTgw.cib-2D.2,the positive alleles of all the minor QTLs were contributed by CY12(Appendix E).
As a major QTL,QTgw.cib-3B.1was detected on chromosome arm 3BL in five environments,and it explained 4.26-25.67% of the phenotypic variance.The genetic interval of this QTL was mapped toAX-111498247(51.5 cM) andAX-109474707(53.5 cM),which spanned 23.8 Mb in physical distance.To obtain a higher density genetic map,a total of 22 KASP markers designed using the re-sequencing data were integrated in this region.As a result,QTgw.cib-3B.1was physically narrowed to a 1.85 Mb interval (between flanking markersKasp63andKasp64) (Fig.3-A).
Additionally,we searched for QTLs for other agronomic traits at the presently identified major QTLs using the constructed linkage map.A total of 10 QTLs were identified in the WC12 population (Appendix H).No QTL associated with other agronomic traits were identified atQTgw.cib-3B.1/QGw.cib-3B,but seven QTLs were identified atQTgw.cib-2D.1/QGw.cib-2D/QGlw.cib-2D.1.Among them,four QTLs (QPht.cib-2D,QSl.cib-2D,QSns.cib-2D,andQGns.cib-2D.1) were detected in at least four environments with LOD values ranging from 5.93 to 53.57%.Three QTLs (QSc.cib-2D,QGnsl.cib-2DandQGns.cib-2D.2) were detected in less than four environments with LOD values ranging from 3.92 to 14.23%,and they explained 5.37-23.65% of the phenotypic variance.ForQGw.cib-4B.1,a major QTL (QPht.cib-4B) was identified in all environments,and it explained 23.14 to 35.43% of the phenotypic variance.The other two QTLs were detected in one or two environments,explaining 7.22 to 13.71% of the phenotypic variance.
To investigate the QTL×environment (QE) interaction effects,data from the multi-environment trials were analyzed using IciMapping v4.2.A total of 82 QTLs were detected in the QE interaction analysis,and 25 of them were the same as those detected in an individual environment.Among them,nine QTLs,QGl.cib-2D,QGw.cib-2D,QGw.cib-3B,QGw.cib-4B.1,QGlw.cib-2D.1,QGlw.cib-2D.2,QGlw.cib-4B,QTgw.cib-2D.1,andQTgw.cib-3B.1,showed low LOD scores and low phenotypic variance,indicating that they were stably expressed(Appendix I).
3.3.Conditional QTL analysis for TGW
GL,GW and GLW are crucial components of TGW.To explore their relationships with TGW,conditional QTL analysis for TGW was performed in QGAStation 1.0.The LOD value ofQTgw.cib-2D.1decreased significantly when TGW was conditional on GW,but it stayed at a higher level when TGW was conditional on GL and GLW.The LOD value ofQTgw.cib-3B.1dropped significantly to an extremely low level when TGW was conditional on GW,while it stayed at a higher level when TGW was conditional on GL and GLW (Appendices F and J).These results suggest that the phenotypic variations ofQTgw.cib-2D.1andQTgw.cib-3B.1were mainly contributed by GW.
3.4.The effects of major QTLs on their corresponding traits and GNS in the WC12 population
In the WC12 population,we identified seven major QTLs,QGl.cib-2D,QGw.cib-2D,QGw.cib-3B,QGw.cib-4B.1,QGlw.cib-2D.1,QTgw.cib-2D.1andQTgw.cib-3B.1.Their effects on the corresponding traits were evaluated based on the flanking markers.As expected,significant differences (P<0.05,P<0.01 andP<0.001) in the corresponding traits were observed at all seven loci in six environments and the BLUE datasets between lines with and without the positive alleles (Fig.3).
In addition,no significant effects on GNS were detected atQTgw.cib-3B.1/QGw.cib-3B,and the positive alleles of the remaining QTLs showed significantly negative effects on GNS (Fig.4).Moreover,the effects ofQTgw.cib-3B.1/QGw.cib-3Bon other agronomic traits were also assessed.The results showed no significant differences in PHT,FTN,SL,SC,SNS or GNSL (Appendix K),indicating thatQTgw.cib-3B.1/QGw.cib-3Bhas potential value in wheat breeding.
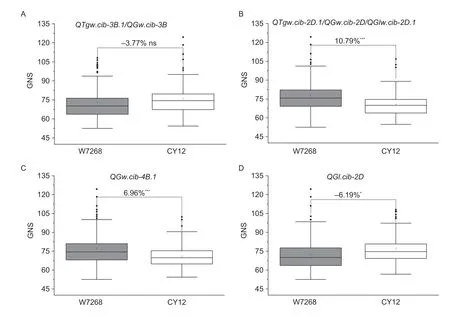
Fig.4 Effects of the major QTLs QTgw.cib-3B.1/QGw.cib-3B (A),QTgw.cib-2D.1/QGw.cib-2D/QGlw.cib-2D.1 (B),QGw.cib-4B.1 (C),and QGl.cib-2D (D) on grain number per spike (GNS) in the WC12 lines.W7268 and CY12 indicate the lines with the alleles from W7268 and CY12,respectively.* and *** represent significances at P<0.05 and P<0.001,respectively;ns represents no significance.
3.5.Additive effects of the major QTLs
Since multiple QTLs for GW (QGw.cib-3B,QGw.cib-4B.1,andQGw.cib-2D) and TGW (QTgw.cib-3B.1andQTgw.cib-2D.1) were identified,their additive effects on the corresponding traits were analyzed.For TGW,compared to lines with negative alleles,lines carrying one positive allele atQTgw.cib-3B.1orQTgw.cib-2D.1significantly (P<0.001) increased TGW by 12.46 or 12.53%,respectively;and lines with both positive alleles significantly (P<0.001) increased TGW by up to 21.95%(Fig.5-A).For GW,relative to the lines with negative alleles,lines carrying one positive allele at eitherQGw.cib-2D,QGw.cib-3BorQGw.cib-4B.1significantly increased GW by 3.70 to 5.03%;while lines carrying two positive alleles at two loci significantly (P<0.001) increased GW by 8.26 to 9.13%;and lines carrying all three positive alleles significantly (P<0.001) increased GW by 10.74% (Fig.5-B).
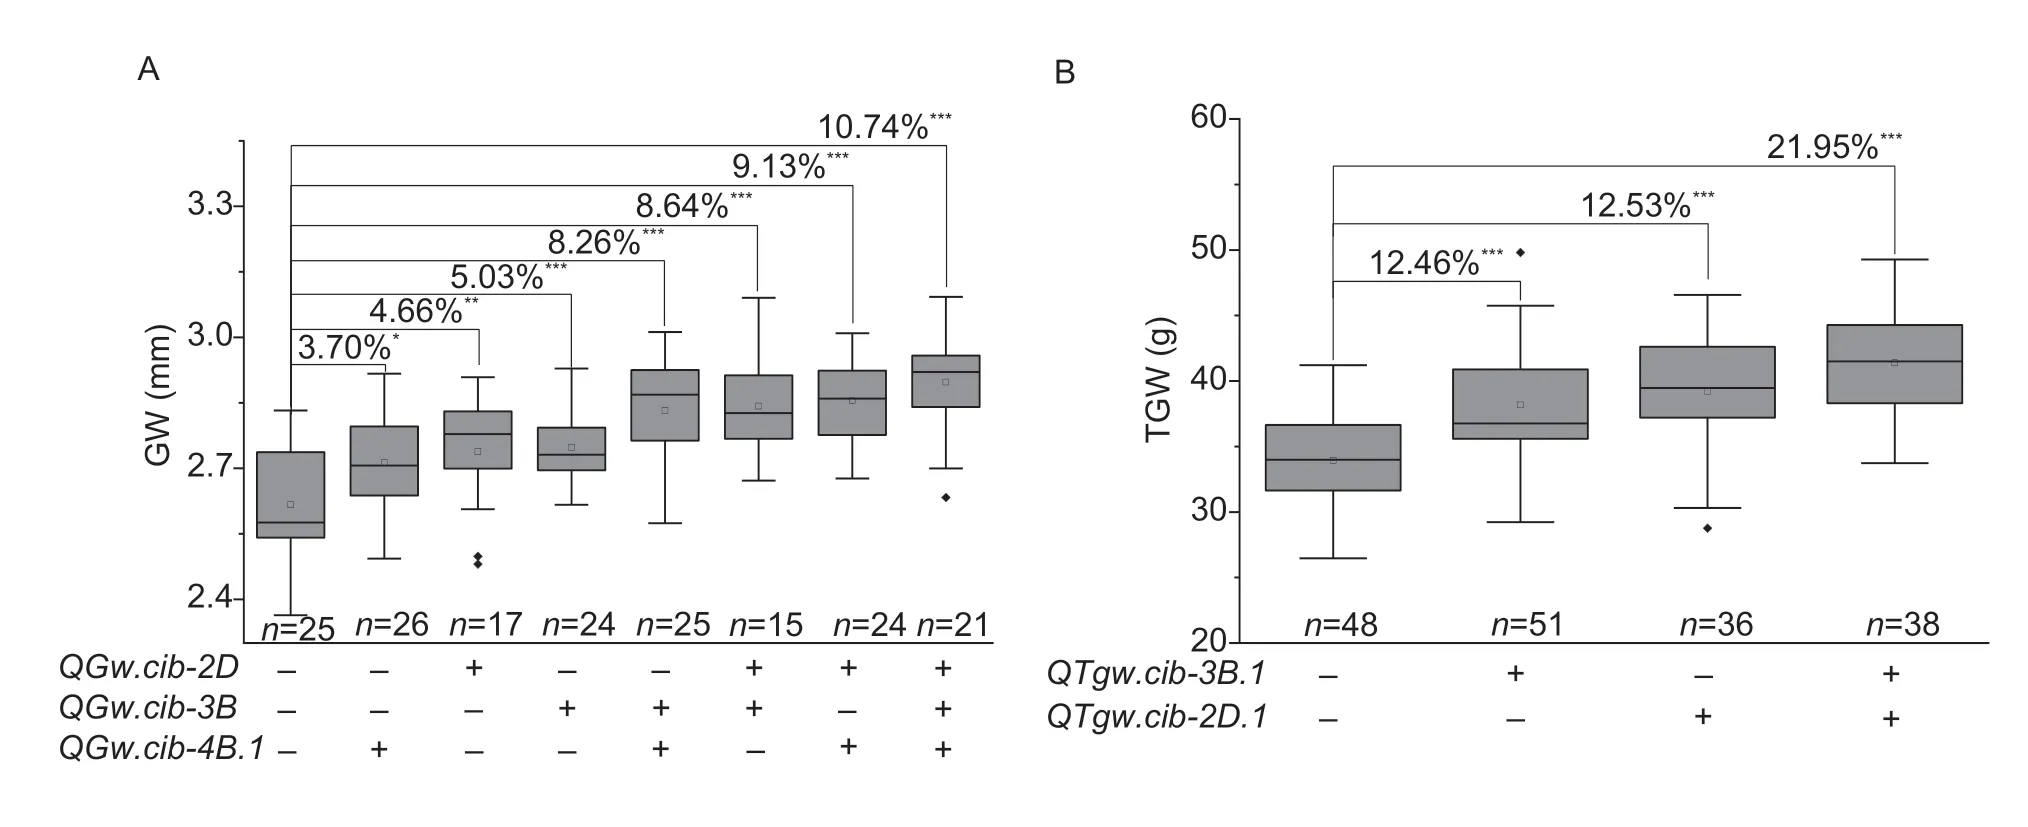
Fig.5 Additive effects of the major QTLs on grain width (GW,A) and thousand-grain weight (TGW,B),respectively.+and -represent lines with and without the positive alleles for the target QTL based on the flanking marker of the corresponding QTL,respectively.*,**,and *** represent significances at P<0.05,P<0.01,and P<0.001,respectively.
3.6.Validation of QTgw.cib-3B.1/QGw.cib-3B in a different genetic background
Fifty-one advanced lines derived from W7268 were used to assess the effects ofQTgw.cib-3B.1andQGw.cib-3Busing their flanking KASP markers.ForQTgw.cib-3B.1,lines with alleles from W7268 showed significantly(P<0.001 for E7 andP<0.01 for E8) higher TGW than those from CY12 (Fig.6-A),indicating thatQTgw.cib-3B.1had a stable genetic effect on TGW in different genetic backgrounds.Nearly two-thirds of advanced lines harbored the W7268 genotype,suggesting a strong and positive artificial selection on this genotype.In addition,the effect ofQGw.cib-3Bon GW was similar to that ofQTgw.cib-3B.1(Fig.6-B).

Fig.6 Validation of QTgw.cib-3B.1/QGw.cib-3B in advanced lines.Effects of QTgw.cib-3B.1 (A) and QGw.cib-3B (B) on thousandgrain weight (TGW) and grain width (GW),respectively.E7 and E8,Shuangliu and Shifang,Sichuan Province,China in 2021,respectively.** and *** represent significances at P<0.01 and P<0.001,respectively.
3.7.Haplotype analysis of QTgw.cib-3B.1/QGw.cib-3B in Chinese wheat
QTgw.cib-3B.1andQGw.cib-3B,the major QTLs,were colocated on chromosome 3B.To further explore the alleles preferentially transmitted in the key region ofQTgw.cib-3B.1/QGw.cib-3Bduring the artificial selection,haplotype analysis of this interval was performed.Based on the genotypes of 18 SNPs,six haplotypes (Hap-I,-II,-III,-IV,-V and -VI) were identified using the re-sequencing data of 145 historically diverse Chinese elite wheat cultivars(Appendix L).In 142 wheat germplasms,five haplotypes were identified in landraces (Hap-I,-II,-III,-IV,and VI)and modern cultivars (Hap-I,-III,-IV,VI,and VII).A new haplotype (-VII) was detected in the modern cultivars(Appendix M),while Hap-V was not detected in our wheat collection.CY12 and W7268 belong to Hap-I and -VII,respectively.
3.8.Candidate gene(s) for QTgw.cib-3B.1/QGw.cib-3B
QTgw.cib-3B.1/QGw.cib-3Bshowed no significant effect on GNS and was detected in six environments with high LOD values and phenotypic variances.Potential candidate gene(s) at this locus were predicted.The annotated Chinese Spring reference genome region(IWGSC RefSeq 2.1) between the two flanking markers contained nine high-confidence genes and 17 lowconfidence genes (Appendix N).Expression pattern analysis showed that five genes were highly expressed in grain (Appendix O).Gene annotation and comparative genomic analysis showed thatTraesCS3B03G0809000was likely associated with the grain growth and development in this study.The re-sequencing data between W7268 and CY12 revealed that an indel (two bp) and a SNP existed in the coding region and intron,respectively (Appendix P).
4.Discussion
4.1.Comparison of the major QTLs to those reported previously
In this study,seven major QTLs for grain weight were mapped on chromosomes 2D,3B,and 4B,and they explained 2.61-34.85% of the phenotypic variance (Fig.3;Table 2;Appendix F).Previously reported QTLs and cloned genes on these chromosomes are summarized in Appendix Q.In addition,the CS genome sequence(RefSeq v1.0) was used as a common coordinating system for comparison of the QTL detected in different reports.
QTgw.cib-2D.1/QGw.cib-2D/QGlw.cib-2D.1,colocated in the interval of 32.97-34.43 Mb on chromosome 2D,was identified in more than four environments.Comparative analysis indicated that it was close to several previously reported QTLs.QTgw.crc-2DandQTgw.cau-2D.1,the minor QTLs,were both located at 26.9-69.8 Mb on chromosome 2D and showed effects on TGW (Huangetal.2006;Guanetal.2018).QTgw.cau-2D.2,located at 39.40 Mb on chromosome 2D,was a minor QTL which affected TGW.TheQTgw.cib-2D.1/QGw.cib-2D/QGlw.cib-2D.1region also physically overlapped withPpd-D1,a core gene regulating photoperiod response.Ppd-D1was also reported to be associated with yield-related traits(Maphosaetal.2014).Thus,we integrated thePpd-D1-derived functional maker into our genetic map and linkage analysis showed thatQTgw.cib-2D.1/QGw.cib-2D/QGlw.cib-2D.1was tightly linked withPpd-D1(Fig.3-C).In addition,we evaluated the effect ofPpd-D1on the corresponding traits.The results suggested thatPpd-D1had significant effects on TGW,GW and GLW,which were similar to those ofQTgw.cib-2D.1/QGw.cib-2D/QGlw.cib-2D.1(Appendix R).These results showed thatPpd-D1might be the candidate gene forQTgw.cib-2D.1/QGw.cib-2D/QGlw.cib-2D.1.
QGw.cib-4B.1,located at 40.44-40.75 Mb on chromosome 4B,was detected in four environments and the BLUE dataset.Comparative analysis suggested that it was close to several previously identified QTLs for grain weight (Appendix Q).QTKW.caas-4BS,a major QTL stably detected in two populations,was located at 46.62 Mb on chromosome 4B,and explained 6.6-45.6%of the phenotypic variance (Lietal.2018).Rht-B1,a semi-dwarfing gene for plant height,was also detected in this region.AsRht-B1was reported to have pleiotropic effects on yield-related traits (Pengetal.1999;Guoetal.2010;Zhangetal.2013),we integrated theRht-B1-derived functional maker into our genetic map and the result showed thatQGw.cib-4B.1was tightly linked toRht-B1(Fig.3-B).Additionally,the effects ofRht-B1on GW and GLW were assessed.The results showed thatRht-B1had significant effects on GW and GLW (Appendix R),which were similar to the effects ofQGw.cib-4B.1/QGlw.cib-4B(Lietal.2018).Thus,the effect ofQGw.cib-4B.1might be attributed toRht-B1.
QGl.cib-2D,a major QTL identified in all environments and the BLUE dataset,was located in the interval of 500.67-501.06 Mb on the long arm of chromosome 2D.Comparative analysis showed that it overlapped withQTKW-2D(Mohleretal.2016) andQTKW.sicau-2SY-2D(Quetal.2021),and was close toQKL.sicau-SSY-2D/QTKW.sicau-SSY-2D(Quetal.2022).QTKW-2DandQTKW.sicau-2SY-2Dhad no effects on GL but they had significantly negative effects on PHT.However,QGl.cib-2Dhad no effect on PHT in the present study (Appendix S).QKL.sicau-SSY-2D/QTKW.sicau-SSY-2D,a major QTL,was detected between 521.24 and 525.27 Mb on chromosome 2D.This QTL did not affect PHT,SNS,or FTN,but significantly affected SL,which was similar toQGl.cib-2D(Appendix S).Thus,theQGl.cib-2Ddetected in this study might be the same or allelic toQKL.sicau-SSY-2D/QTKW.sicau-SSY-2D(Appendix Q).
QTgw.cib-3B.1/QGw.cib-3B,the major QTL for TGW and GW,was located in the interval of 505.29-507.14 Mb on chromosome 3B.Comparative analysis revealed that no previously reported QTL for TGW or GW overlapped with or was near this region (Appendix Q).In addition,compared with the conditional QTL analysis,QGw.cib-3Bwas detected only in the unconditional QTL analysis when the genetic effect of GW was excluded (Appendix J).This result suggested that the effect ofQTgw.cib-3B.1on TGW is mainly dependent on the effect ofQGw.cib-3Bon GW.Therefore,QTgw.cib-3B.1/QGw.cib-3Bmay be a new QTL for TGW and GW.
4.2.Haplotype variation of QTgw.cib-3B.1/QGw.cib-3B during artificial selection
Modern cultivars have undergone strong artificial selection for yield improvement and can adapt to multiple environments.As a result,landraces were gradually replaced by cultivars and the genomic regions for yieldrelated traits have been intensively selected.Recently,the whole genome re-sequencing of landraces and cultivars provided valuable insights into the cultivar development process (Chengetal.2019;Guoetal.2020;Haoetal.2020;Zhouetal.2020).During selection,the haplotype blocks in the selection sweep region were extensively changed.These selected haplotypes,which are associated with elite phenotypic performance,were strongly favored in breeding programs and their distribution frequency increased substantially in the later developed cultivars.For example,based on a pedigree-specific haplotype analysis,the haplotype with longer kernels (Hap-1A-1) contributed by Xiaoyan 6 was strongly selected and maintained in breeding programs (Haoetal.2020).
In the present study,the germplasms of 142 wheat accessions were divided into two types: 75 landraces and 67 cultivars.Significant differences in TGW were detected between them,and the TGW in cultivars was higher than that of the landraces.Six haplotypes (Hap-I,-II,-III,-IV,-V and -VI) were identified based on the results of the re-sequencing data of 145 Chinese elite wheat cultivars (Appendix L).However,Hap-V was not detected in our germplasm,which might be attributed to the diversity of this wheat collection (Appendix M).Interestingly,W7268 and the other three wheat accessions that originated from the Sichuan-Xizang area in China formed a new haplotype: Hap-VII,which was not detected in the 145 elite cultivars in China.Hap-II and -III were extensively distributed in the landraces,with seven and 44 accessions detected,respectively.However,they were almost completely absent in the modern cultivars,with zero and one accessions identified,respectively(Appendices M and T).This result indicated that Hap-II and -III were not preferred by breeders and were selected out during artificial selection.The distributions of Hap-I and -VI were relatively low in landraces (four and three accessions,respectively),but high in modern cultivars(10 and 26 accessions,respectively).These results suggested that Hap-I and -VI were transmitted during selection and enriched in the breeding program (Fig.7).Thus,theQTgw.cib-3B.1/QGw.cib-3Binterval is a hotspot region during artificial selection.

Fig.7 Haplotypes and their distribution frequencies of QTgw.cib-3B.1/QGw.cib-3B in 142 wheat accessions.TGW,thousand-grain weight.C and L represent modern cultivars and landraces,respectively.
4.3.Potential candidate gene(s) for QTgw.cib-3B.1/QGw.cib-3B
Based on the flanking KASP markers,26 genes (including nine annotated high-confidence genes) were identified in theQTgw.cib-3B.1/Gw.cib-3Binterval in the CS reference genome (Appendix N).Based on the results of expression pattern,gene annotation,and ortholog analyses,TraesCS3B03G0809000might be the candidate gene associated with the regulation of grain development(Appendices O and N).TraesCS3B03G0809000encodes a ubiquitin protein,which may be involved in protein ubiquitination to control grain size and weight (Suetal.2011;Huangetal.2017).ZmDA1,the homologue toAtDA1,encodes a ubiquitin receptor containing two ubiquitin-interacting motif domains in maize.Overexpression ofZmDA1enhanced starch accumulation and increased the grain weight (Xieetal.2018).
5.Conclusion
In this study,seven major QTLs for grain weight were identified.Among them,QTgw.cib-3B.1andQGw.cib-3Bwere co-located and the improvement in TGW was contributed by GW.Unlike other loci,QTgw.cib-3B.1/QGw.cib-3Bhad no effect on GNS.They were further validated in advanced lines using KASP markers.Six haplotypes were identified in the region of this QTL and their distribution frequencies varied between the landraces and the cultivars.The predicted gene ofQTgw.cib-3B.1/QGw.cib-3Bwill be valuable for the cloning of candidate gene(s).Collectively,the major QTLs and KASP markers reported here have advanced our understanding of the underlying genetic architecture of grain weight in wheat.
Acknowledgements
This work was supported by the Major Program of National Agricultural Science and Technology of China(NK20220607),the West Light Foundation of the Chinese Academy of Sciences (2022XBZG_XBQNXZ_A_001),and the Sichuan Science and Technology Program,China (2022ZDZX0014).We thank the Triticeae Multiomics Center (http://202.194.139.32/) for providing the integrated platform of tools and genomic data that brought convenience to our work;Wheat-SnpHub-Portal (http://wheat.cau.edu.cn/Wheat_SnpHub_Portal/) for providing the genomic variation datasets of wheat,and Bioacme Biotechnology Co.,Ltd.(Wuhan,China,http://www.whbioacme.com) for the whole genome re-sequencing analysis.Also,we thank the anonymous referees for their critical reading and revisions of the manuscript.
Declaration of competing interest
The authors declare that they have no conflict of interest.
Appendicesassociated with this paper are available on https://doi.org/10.1016/j.jia.2023.04.023
杂志排行
Journal of Integrative Agriculture的其它文章
- Advances in DNA methylation and its role in cytoplasmic male sterility in higher plants
- Assessment of molecular markers and marker-assisted selection for drought tolerance in barley (Hordeum vulgare L.)
- 3D genome organization and its study in livestock breeding
- SUPER WOMAN 2 (SPW2) maintains organ identity in spikelets by inhibiting the expression of floral homeotic genes OsMADS3,OsMADS58,OsMADS13,and DROOPING LEAF
- Coupling of reduced inorganic fertilizer with plant-based organic fertilizer as a promising fertilizer management strategy for colored rice in tropical regions
- Effect of chemical regulators on the recovery of leaf physiology,dry matter accumulation and translocation,and yield-related characteristics in winter wheat following dry-hot wind