Quantification of the adulteration concentration of palm kernel oil in virgin coconut oil using near-infrared hyperspectral imaging
2024-01-17PhiraiwanJermwongruttanachaiSiwalakPathaveeratSirinadNoypitak
Phiraiwan Jermwongruttanachai,Siwalak Pathaveerat,Sirinad Noypitak
Department of Agricultural Engineering,Faculty of Engineering at Kamphaeng Saen,Kasetsart University,Kamphaeng Saen Campus,Nakhon Pathom 73140,Thailand
Abstract The adulteration concentration of palm kernel oil (PKO) in virgin coconut oil (VCO) was quantified using near-infrared(NIR) hyperspectral imaging.Nowadays,some VCO is adulterated with lower-priced PKO to reduce production costs,which diminishes the quality of the VCO.This study used NIR hyperspectral imaging in the wavelength region 900-1,650 nm to create a quantitative model for the detection of PKO contaminants (0-100%) in VCO and to develop predictive mapping.The prediction equation for the adulteration of VCO with PKO was constructed using the partial least squares regression method.The best predictive model was pre-processed using the standard normal variate method,and the coefficient of determination of prediction was 0.991,the root mean square error of prediction was 2.93%,and the residual prediction deviation was 10.37.The results showed that this model could be applied for quantifying the adulteration concentration of PKO in VCO.The prediction adulteration concentration mapping of VCO with PKO was created from a calibration model that showed the color level according to the adulteration concentration in the range of 0-100%.NIR hyperspectral imaging could be clearly used to quantify the adulteration of VCO with a color level map that provides a quick,accurate,and non-destructive detection method.
Keywords: virgin coconut oil,adulteration,contamination,palm kernel oil,hyperspectral imaging
1.lntroduction
Virgin coconut oil (VCO) is a tropical vegetable oil that is commonly used in Southeast Asia (Alietal.2019).In 2021,Thailand’s coconut yield was 625,540 t of fresh coconuts (OAE 2021),and its coconut oil production was 28,024 t (Statista 2021),while the value of coconut oil export in 2020 was USD 6.23 million (Tridge 2020).VCO consists of the vegetable oil extracted from fresh and mature coconut meat.VCO is one of the best cooking oils and is rich in lauric acid that supports the human immune system (Yunusetal.2009).Nowadays,VCO is very popular,resulting in increasing consumer demand due to the lack of chemicals or heat treatment in its production(Manafetal.2007).
Coconut oil is high in saturated fatty acids,consisting of caproic acid (C6),caprylic acid (C8),capric acid (C10),lauric acid (C12),myristic acid (C14),palmitic acid (C16),and stearic acid (C18),with about 90% being C12 (Stroheretal.2020).Medium-chain fatty acids (MCFAs) refer to a mixture of fatty acids that generally consist of C6-C10(Nagao and Yanagita 2010).There have been reports of MCFA consumption leading to the suppression of body fat accumulation,improvement in metabolic syndrome,and induction of cancer cell apoptosis (Miyagawaetal.2018).
In order to increase the volume and hence the return,VCO tends to be contaminated with low-cost oil (Marinaetal.2009),and VCO has market demand,resulting in shortfalls in production and a subsequently high price.Contamination of coconut oil not only reduces its quality but also leads to adverse health consequences(Pandiselvametal.2019).Lately,coconut oil has been intentionally or accidentally adulterated (Alietal.2019).Palm kernel oil (PKO) is used to adulterate coconut oil because its price is 83% lower than that of coconut oil.Mixtures of these two oils that have similar physical characteristics and chemical composition make adulteration difficult to detect.Thus,rapid nondestructive technologies are of great interest for use in the quantification of adulteration with PKO in VCO.
Near-infrared (NIR) spectroscopy has been used extensively as a rapid,highly efficient,safe,nondestructive,and low-cost method (Yangetal.2022;Zhaoetal.2022) for the compositional determination of fats (Khodabuxetal.2007) and oils (Nawaf and Hmidat 2020),including the adulteration of sesame oil with soybean oil,corn oil,peanut oil (Liu and Wan 2012).Other technique such as Raman (Nokkaew 2019),infrared (Oussamaetal.2012),laser-induced breakdown(Caceresetal.2013),etc.have also been used to identify oil adulteration.Although,the conventional techniques perform well in predicting oil values,the measurements are usually taken at a single point of detection;thus,the spectra obtained from conventional techniques do not provide any spatial information on a sample.Therefore,hyperspectral imaging techniques are interesting because they can more easily produce a clear picture of the complete sample.Hyperspectral imaging combines the main advantages of spectroscopy and imaging to provide spectral and spatial data simultaneously in one system for predicting the quality of agricultural and food products (Wu and Sun 2013).
Data from a hyperspectral image is obtained as a 3D photograph called a hypercube (Wu and Sun 2013).Each pixel in the hyperspectral image provides spectral information of a unique location,allowing the visualization of biochemical elements and their distributions in samples(Priyashanthaetal.2020).In the past,many researchers have investigated hyperspectral imaging analysis.For example,Zhuetal.(2013) reported moisture and fat mapping in Atlantic salmon fillets,obtaining coefficient of determination (R2) values of 0.94 and 0.93 and root mean square error of prediction (RMSEP) values of 1.06 and 1.24% for moisture and fat,respectively.The partial least squares model was applied to the hyperspectral image of the prediction samples to visualize the lipid and moisture distributions.A principal components analysis (PCA)-derived pseudo-color map was used to more productively detect honey adulteration and adulteration levels (Shaoetal.2022).These examples show that hyperspectral imaging has been successfully used for quantitative and qualitative analyses in assessing the adulteration of foods.
Therefore,the current study evaluated an NIR hyperspectral imaging technique to establish a quantitative model for detecting the adulteration concentration of PKO in VCO,and to create a predictive map that can be used to identify the adulteration concentration of PKO in VCO at concentrations in the range of 0-100%.
2.Materials and methods
2.1.Preparation of samples
VCO was sampled from the Ruean Samut Community Enterprise in Samut Songkhram,Thailand.The PKO was purchased from Pathum Vegetable Oil Co.Ltd.in Pathum Thani,Thailand.In total,280 samples were collected,including 10 samples of pure VCO and 270 samples of VCO adulterated with PKO.The adulterated samples were prepared by mixing PKO in VCO at different levels(0-100%) by adding 3% per adulteration in the range of 1-45% and 5% per adulteration in the range of 55-100%.Samples were mixed using stirring at 32°C in a water bath until the mixed sample was clear.There were 10 samples prepared per adulteration level.
2.2.Near-infrared hyperspectral imaging system
The NIR hyperspectral imaging system is shown in Fig.1.NIR hyperspectral images were obtained using a push-broom line scanning system.The spectral camera was composed of an imaging spectrograph (Imspector N17E;Specim,Spectral Imaging Ltd.,Oulu,Finland) for the wavelength region of 864-1,696 nm with an interval of 3.3 nm,a CCD camera (Xeva 992;Xenics Infrared Solutions;Leuven,Belgium),a pixel-in-image frame with 256 pixels of wavelength×320 pixels of position,and an InGaAs photodiode array sensor and operating software (Specim’s LUMO Software Suite;Spectral Imaging Ltd.,Oulu,Finland).The distance between the camera and the sample was adjusted to 20 cm vertically for taking the measurements.The light source was three 300 W halogen tungsten lamps adjusted at 45°,with the sample in the horizontal plane.Each oil sample washeld in a Petri dish and scanned on a moving tray at a speed of 10 mm s-1with an exposure time of 9.00 ms in transflectance mode.Before every sample measurement,the reference values were determined by measuring the darkness (0% reflectance) of the shutter of the camera lens that was closed by an automatic measuring device,and the whiteness (99.9% reflectance) (Yangetal.2017) was measured using a white spectralon stick(2.5 cm×20 cm×1 cm).

Fig.1 Near-infrared hyperspectral imaging system.
Before each adulteration sample measurement,the sample in a 100-mL flask was placed in a water bath at 40°C (Hourantetal.2000).A 5-mL portion of the sample was placed into a 50-mm diameter Petri dish with a 3 mm sample thickness (Shafieeetal.2016).The Petri dish sample was placed on a 50 mm white,circular Teflon plate and then the sample was placed on the moving tray and scanned in transflectance mode.The image was recorded by dividing the sample into three images: the sample image,the white image (white reference),and the dark image (dark reference).
2.3.Physicochemical characteristic measurements
Fatty acid analysisThree samples of VCO and PKO in three replicates were analyzed for fatty acid to compare the fatty acid values of both oils.A 40-mg aliquot of oil sample was placed in a 50-mL test tube with a cap.Then,5 mL of 0.5 mol L-1NaOH in methanol solution was added,after which 1 mL of the 2,000 ppm internal standard (C17) solution was added.The sample was mixed using a Vortex mixer and refluxed in a water bath at 90°C for 5 min (then allowed to cool at room temperature for approximately 5 min).An amount (5 mL) of 14% BF3in methanol was added and mixed using a Vortex mixer for 1 min.A 10-mL sample of saturated NaCl solution and 4 mL of hexane were added to the mixture which was vortex-mixed for 5 min.Then,the sample was set aside to separate then-heptane and water phases;and then-heptane solution was poured into a vial (1 mL).The sample was injected into the gas chromatography unit and fatty acid was analyzed following AOAC (2000).
Color analysisThe color analysis was applied as in Kilicetal.(2007),which distinguishes the adulteration of various vegetable oils.All samples were analyzed for color values using a color meter (CR-400;Chroma Meter;Osaka,Japan).A sample (13 mL) was placed in the clear beaker of the instrument.The color of the oil sample was measured and values were recorded for L* (lightness,where L*=0 for black and L*=100 for white),for a* (redness(a*+) and greenness (a*-)),and for b* (yellowness (b*+)and blueness (b*-)),according to Magdicetal.(2009).
2.4.Statistical analysis
The fatty acid data of the virgin coconut and PKOs were analyzed at the 95% confidence level using thet-test method to determine the differences in fatty acid values of the two pure oils.The color values of samples for each adulterated oil level were analyzed at the 95% confidence level based on the one-way ANOVA method,and mean differences were tested using Duncan’s new multiple range test methods to determine the differences between color values at the different adulteration concentrations of PKO in the VCO.All calculations were carried out using the SPSS program version 28 (IBM;Armonk,NY,USA).
2.5.Near-infrared hyperspectral image analysis
Extraction spectraAll the spectral images were converted into a relative reflectance value using the MATLAB R2021b software (Mathworks;Natick,MA,USA)for further analysis based on eq.(1) (Yangetal.2017;Maetal.2018):
whereRλ,nis the relative reflectance at wavelengthλand pixeln,Sλ,nis the sample intensity at wavelengthλand pixeln,andWλ,nis the white reference image andDλ,nis the dark reference image,both at wavelengthλand pixeln.
The region of interest was selected at 981.42 nm where the greatest difference occurred between the reflectance values of the sample and the background,which was used as a threshold of 0.25.Then,all spectra for each image were averaged to represent the image.Each spectrum was converted from reflectance to absorbance based on eq.(2) (Andres and Bona 2005) to generate the calibration equation:
Development of the prediction equation for the adulteration content of PKO in VCOThe absorbance spectra were checked for outliers using the PCA method.PCA reduces the dimensionality for more efficient data analysis (Dongetal.2014;Zhuetal.2022).The outlier of one spectral value was found and removed.All samples were separated into a calibration set (n=186) and a prediction set (n=93),as shown in Table 1.The spectral data were pretreated using the Savitzky-Golay first derivative (1D) with three smoothing points,the second derivative (2D) with three smoothing points,multiplicative scatter correction (MSC),and the standard normal variate(SNV) (Noypitaketal.2019),to remove the noise light scattering effect and the baseline change in the process of data acquisition (Zhuetal.2020).Then,the calibration model of the adulteration concentration of PKO in VCO was created based on the partial least squares regression(PLSR) analysis,with full cross validation using the Unscrambler 9.8 program (Camo;Oslo,Norway),where the independent variable was the absorbance and the dependent variable was the adulteration concentration of PKO in VCO.The best calibration equation was determined by accuracy performance based on the highest values of the coefficient of determination of calibration (Rc2) and the root mean square error of calibration (RMSEC).The prediction equation was considered for the predictive performance based on the highest value for the coefficient of determination of prediction (Rp2),the lowest value of RMSEP based on eq.(3),and the highest residual prediction deviation(RPD).The RPD is the ratio of the standard deviation of the prediction group to the standard error of prediction(SEP) based on eq.(4),which was used to compare the predictive accuracies of the equations.
whereyiis the measured value of samplei,ypreis the predicted value of samplei,andnis the number of samples.
The interpretation of RPD values was: 0.0-2.3,not recommended;2.4-3.0,very rough screening;3.1-4.9,screening;5.0-6.4,quality control;6.5-8.0,process control;and 8.1+,any application (Williams and Norris 2007).
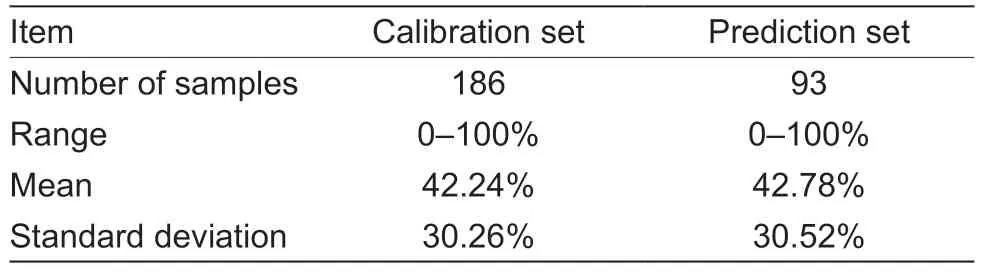
Table 1 Characteristics of adulteration concentration samples of virgin coconut oil with palm kernel oil (PKO) in calibration and prediction sets
Construction of mapping for the adulteration concentration of PKO in VCOThe mapping of samples by the adulteration concentration of PKO in the VCO was developed as a flowchart (Fig.2) using the MATLAB R2021b software (MathWorks;Natick,MA,USA),which provided a two-dimensional graphical display of the adulteration concentration of PKO in the VCO.The regression vector of the best PLSR model was used to predict the adulteration concentration of PKO in the VCO of each pixel in the image.The mapping of pure VCO and the adulteration concentration of PKO in the VCO represented pure VCO and the adulteration concentrations from 0-100% on a blue-to-red color scale.
Verification of robustness of the prediction equation using another adulterated VCO group for external validationAn unknown set was made by collecting 45 samples of VCO and PKO from different production lots.They had pure VCO and an adulteration concentration of PKO in VCO in the range of 0-100%.The standard deviation was 32.60%.The predictive performance of the external validation was considered based on the highest value for the coefficient of determination of external validation (REV2) and the lowest value of the root mean square error of external validation (RMSEEV).
3.Results and discussion
3.1.Analysis of physical and chemical characteristics of VCO and VCO adulterated with PKO
ColorThe color analysis of the adulteration of VCO with PKO is presented in Table 2.There were no significant differences in lightness (L*,28.02-28.21) for all adulteration concentrations in the pure VCO.There were significant differences in the values of a* and b*.The a* values were significantly different for 100% VCO(red tones) and 100% PKO (green tones);however,the a*values for the different adulteration concentrations could be differentiated over a wide range.The b* values were significantly different for 100% VCO (bule tones) and 100% PKO (yellow tones);however,the b* values were distinguished in a significantly different narrower range than the a* values.Because the VCO was very clear,it had no yellow tone;on the other hand,the PKO had a yellow tone.These results indicated that color analysis could show significant differences over a wide range,but the color parameters could not be used to detect or quantify adulteration by the naked eye.
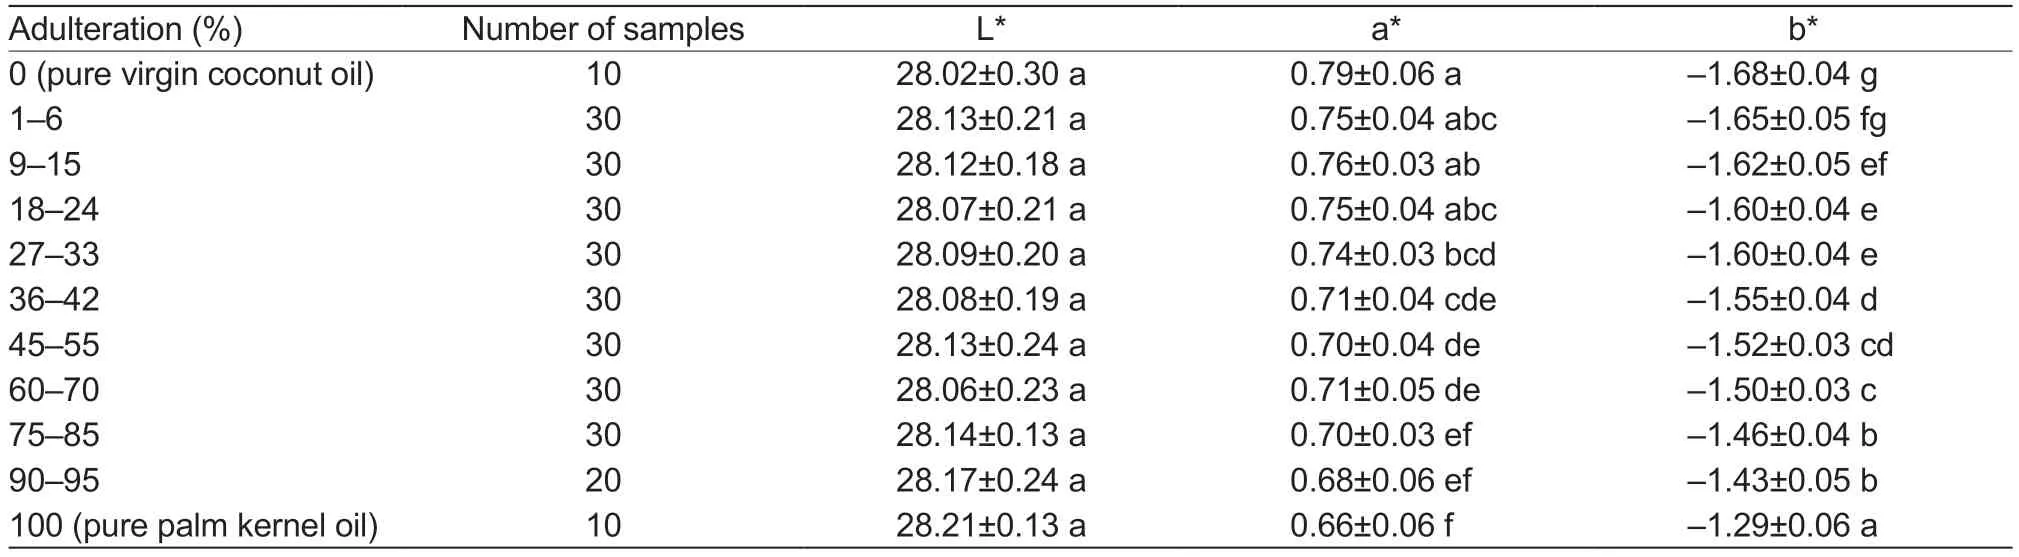
Table 2 Color analysis of the adulteration concentration of palm kernel oil in virgin coconut oil
Fatty acidFrom Table 3,the fatty acid analysis of the VCO and the PKO showed that the saturated fatty acid values for C6,C8,C10,C12,C14,C16,and C18 for the VCO were 0.27,6.23,6.94,55.98,18.25,6.80,and 1.79%,respectively,which corresponded to the VCO analysis results of Shirwaikar (2015);and the values for PKO were 0.17,3.13,4.26,61.04,16.11,5.81,and 1.16%,respectively,which corresponded to the PKO analysis results of Mancinietal.(2015).The C12 value of the PKO was significantly higher than that for the VCO,which was the same as comparable C12 values in PKO and VCO reported by Gopalaetal.(2009).Therefore,for the MCFAs,the fatty acid range C6-C10 (Nagao and Yanagita 2010) of the VCO was higher than for the PKO,with values of 13.43 and 7.55%,respectively.The results of the analysis of the VCO and the PKO conformed to Nagaoand Yanagita (2010),who reported that the MCFAs of VCO and PKO were 15 and 7.9%,respectively.Miyagawaetal.(2018) reported that the intake of MCFAs led to an improvement in metabolic syndrome,suppression of body fat accumulation,and induction of cancer cell apoptosis.In terms of unsaturated fatty acids,the oleic acid of PKO was significantly higher than that of VCO.

Table 3 Fatty acid values of virgin coconut oil and palm kernel oil
3.2.Spectral properties of the adulteration concentration of PKO in VCO
The results of the absorbance spectra of the VCO and the PKO based on NIR-hyperspectral imaging are shown in Fig.3.They are similar to the absorbance peak characteristics of adulterated palm oil (Basrietal.2017).The average absorbance spectra of 100% VCO,mixed oils (50% VCO and 50% PKO),and 100% PKO were measured in the wavelength range of 900-1,650 nm.The absorbance values of these three samples were very close with no measurable differences.Therefore,the spectral data were pretreated using the 2D method,as shown in Fig.4,where the peak below zero is at the location of the C-H overtone of the methylene group in oil at around 923 nm (Osborneetal.1993;Khodabuxetal.2007).The negative peaks at wavelengths 1,163,1,185,1,210,and 1,388 nm are the second overtones of CH stretching vibrations associated with fatty acids in the range of 1,100-1,390 nm (Khodabuxetal.2007;Chenetal.2015;Choi and Moon 2020).Absorption bands of fats and oils are evident as absorption peaks around 1,163 nm,corresponding to the bond vibration of the C-H stretching of the second overtone (Williams and Norris 2007;Workman and Weyer 2008),at around 1,185 nm that is responsible for the second overtone of HC=CH stretching vibrations (Kaufmannetal.2022),at around 1,210 nm arising from the second overtone of C-H stretching vibrations (Nawrocka and Lamorsk 2013;Zhuetal.2013) and at around 1,388 nm,arising from the first overtone of C-H stretching vibrations (Christyetal.2004).The fatty acid analysis from Table 3 compares the fatty acid differences between the VCO and the PKO,corresponding to the wavelength of Fig.4.Therefore,the difference in wavelength 1,185 nm indicated a higher absorbance of the VCO than for the mixed oils and the PKO,respectively,with negative peaks which may have been related to the MCFAs (C6-C10) of the VCO and the PKO in Table 3.On the other hand,at a wavelength of 1,210 nm,the absorbance of the VCO was less than for the mixed oils and the PKO,respectively,with the negative peak indicating the location of unsaturated fatty acids which consisted of oleic acid and linoleic acid as shown by Chenetal.(2015).Also,the band at 1,210 nm is an important wavelength for quantifying the oleic acid content in corn kernel by Weinstocketal.(2006).The important peaks are identified and shown in Table 4.

Fig.3 Absorbance spectra of virgin coconut oil,mixed oils (50% virgin coconut oil and 50% palm kernel oil),and palm kernel oil.
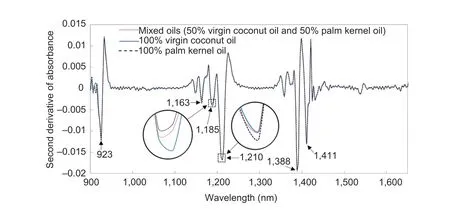
Fig.4 Absorbance spectra of virgin coconut oil,mixed oils (50% virgin coconut oil and 50% palm kernel oil),and palm kernel oil after pretreatment using the second derivative (2D) method.
3.3.Results from generating the equation for predicting the PKO adulteration concentration in VCO
The PLSR models for predicting the adulteration concentration (0-100%) of PKO in VCO are shown in Table 5.The models were obtained from the absorbance spectra,with the pretreated spectra produced based on using the 1D,2D,MSC,and SNV methods.The best predictive model was the one based on the SNV spectra(Rc2=0.990,RMSEC=3.08%,Rp2=0.991,RMSEP=2.93%,and RPD=10.37) with six latent variables,which were excellent for calibration and prediction.This statistical result indicated that this model could be used in any application (Williams and Norris 2007) for assessing the adulteration concentration of PKO in VCO.The scatter of actual adulteration concentrations and predicted adulteration concentrations of PKO in VCO for calibration and prediction are shown in Fig.5-A and B,respectively.The best predictive model for external validation had values ofREV2=0.922 and RMSEEV=8.98%.The scatter plot of the actual adulteration concentrations and predicted adulteration concentrations of PKO in VCO for the external validation set is shown in Fig.5-C.This result was consistent with Chengetal.(2017) who investigated NIR hyperspectral imaging with multivariate data analysis for predicting the oil content in peanut kernels and produced a high-performance PLSR model,and also with Basrietal.(2017) who reported that NIR spectroscopy could discriminate and quantify lard adulteration in palm oil using a highly efficient prediction model.Based on all these studies and the current work,it seems certain that an NIR hyperspectral technique has potential for the future development of on-line detection of adulteration in the VCO industry.

Table 4 Chemical assignments of observed near infrared absorption bands in pure virgin coconut oil and adulteration concentrations(0-100%) of palm kernel oil in the virgin coconut oil

Fig.5 Scatter plot of calibration (A),prediction (B) and external validation (C) results based on the standard normal variate (SNV) pretreated spectra for predicting the adulteration concentration of virgin coconut oil with palm kernel oil.
The regression coefficients modified by the SNV pretreated method are presented in Fig.6.Some important peaks are shown in Table 4,with the wavelength at around 1,160 nm being the vibration of second overtones due mainly to the presence of double bonds and C-H vibrations (Panford and John 1990)associated with the oil (Workman and Weyer 2008).The wavelengths at around 1,375 and 1,394 nm are related to C-H molecular bonds in the fatty acids (Williams and Norris 2007;Prietoetal.2008).The wavelength at around 1,662 nm is the C-H first overtones associated with fatty acids (Choi and Moon 2020).

Fig.6 Regression coefficients of standard normal variate (SNV) pretreated spectra for the calibration model for adulteration in virgin coconut oil.
Fig.7 shows the score plot of the first two components(PC1 and PC2) based on the SNV-pretreated spectral data of the pure VCO and adulterated VCO at 0-15% and 18-100%,respectively,indicating classification between the two clusters.These results show the likelihood of prediction for a low contamination group and a high contamination group.PC1 and PC2 explained 61 and 26% of the variation,respectively,with a cumulative variance percentage of 87%.However,there was some overlap of the two groups which should be clarified using adulteration mapping based on the NIR hyperspectral imaging technique.

Fig.7 Principal component analysis of standard normal variate(SNV) pretreated spectra for adulterated oil at 0-15% and 18-100%.
3.4.Visualization for prediction of the adulteration concentration
Fig.8 shows images of the pure VCO and adulteration concentrations (0-100%) of PKO in VCO,and they provide details that could not be observed by the naked eye.Fig.9 shows the predictions of the adulteration concentration mapping of PKO in VCO created from the calibration model,with the color level for the pure VCO and adulteration concentrations (0-100%) from low adulteration (blue) to high adulteration (red).Theresults for adulteration concentrations of 18% and above are colored from blue to yellow to red.More yellow to red color in a sample indicates a higher PKO adulteration concentration.Thus,the mapping from the NIR hyperspectral imaging can be readily seen by the naked eye,so the quantification of VCO adulteration is fast,accurate,and non-destructive,which offers clear advantages over conventional NIR spectral analysis.

Fig.8 Images of adulteration concentrations (0-100%) of palm kernel oil in virgin coconut oil.

Fig.9 Prediction mapping of adulteration concentrations (0-100%) of palm kernel oil in virgin coconut oil.
4.Conclusion
The quantification of the adulteration concentration of PKO in VCO and predicting the adulteration concentrations could be achieved by using the NIR hyperspectral imaging system to establish a quantitative model.The PLSR analysis results showed excellent accuracy (Rp2=0.991,RMSEP=2.93%,and RPD=10.37).NIR hyperspectral imaging could also be used for creating a visible predictive map of adulteration at different concentrations and for quantification of the adulteration concentration of PKO in VCO.Using this method,it should be possible to create a rapid adulteration detection instrument for commercial quality insurance in the VCO industry.However,if the prediction equation is used to analyze samples which are outside the range of the calibration set,it would lead to higher bias.Therefore,the prediction model should be updated,and more samples should be added to cover the wider variation in pure VCO from several reliable pure VCO producers so that a predictive model with higher accuracy can be developed.Furthermore,this NIR hyperspectral imaging technique should be developed as a real-time portable tool for further research.
Acknowledgements
This work was supported by the Thailand Research Fund through the Royal Golden Jubilee Ph.D.Program(PHD/0225/2561) and the Faculty of Engineering,Kamphaeng Saen Campus,Kasetsart University,Thailand.
Declaration of competing interest
The authors declare that they have no conflicts of interest.
杂志排行
Journal of Integrative Agriculture的其它文章
- Advances in DNA methylation and its role in cytoplasmic male sterility in higher plants
- Assessment of molecular markers and marker-assisted selection for drought tolerance in barley (Hordeum vulgare L.)
- 3D genome organization and its study in livestock breeding
- SUPER WOMAN 2 (SPW2) maintains organ identity in spikelets by inhibiting the expression of floral homeotic genes OsMADS3,OsMADS58,OsMADS13,and DROOPING LEAF
- Genetic dissection and validation of a major QTL for grain weight on chromosome 3B in bread wheat (Triticum aestivum L.)
- Coupling of reduced inorganic fertilizer with plant-based organic fertilizer as a promising fertilizer management strategy for colored rice in tropical regions